the Creative Commons Attribution 4.0 License.
the Creative Commons Attribution 4.0 License.
 | 03 Jul 2019
Drill bit noise imaging without pilot trace, a near-surface interferometry example
Mehdi Asgharzadeh
Ashley Grant
Andrej Bona
Milovan Urosevic
Acoustic energy emitted by drill bits can be recorded by geophones on the surface and processed for an image of the subsurface using seismic interferometry methods. Pilot sensors record bit signals on the drill rig and play an important role in processing geophone traces for the image. When pilot traces are not available, traces of the nearest geophone to the rig may be used in deconvolution and cross-correlation of data, but extra signal processing efforts are required to reduce the effect of source signature on cross-correlation results. In this study, we use the seismic interferometry method to image the shallow subsurface beneath a 2-D geophone array by converting geophones to virtual sources. As there is no pilot signal available for this survey, we use the nearest geophone trace for pilot cross-correlation and pilot deconvolution. We modify the spectrum of pilot cross-correlation and deconvolution results so that the effect of source function on virtual data is minimized. We then migrate the virtual shots and compare the results of interferometric imaging with the available image from 3-D (active source) survey and assess the efficiency of our approach. We show that drill bit noise data can be used to generate a reasonably accurate image of the subsurface even in the absence of pilot recordings, but the results should be checked for the appearance of virtual multiples and depth inconsistencies that are caused by errors in the migration velocity.
- Article
(8276 KB) - Full-text XML
- BibTeX
- EndNote


A significant level of acoustic energy generated by the drill bit hammering action at the bottom of a borehole is transferred into the geological formations surrounding the borehole and can be recorded by an array of geophones on the surface and processed for a subsurface image under the receiver array. Seismic while drilling records can be either transformed to inverse vertical seismic profiling (IVSP) data and imaged following standard IVSP migration methods (Poletto and Miranda, 2004) or redatumed to the surface by interferometry to form virtual surface records and then migrated for an image (Schuster, 2009, 2014; Wapenaar et al., 2010a, b).
Borehole imaging methods either place their energy source in the borehole with the receivers on the surface (i.e., IVSP methods) or place the receivers in the borehole and the source on the surface (i.e., VSP methods) to reduce the wave's propagation path to only one leg. This makes these methods less vulnerable to near-surface heterogeneity and to obtain a wider frequency bandwidth, as a result of the smaller energy absorption compared to the reflection surveys where both the source and the receivers are positioned on the surface. Interferometry transfers borehole sources or the receivers to the surface and forms virtual shot records that give the methods a much wider subsurface coverage, comparable to that of surface seismic methods. Therefore, drill bit noise imaging using seismic interferometry can be seen as superior to surface seismic imaging experiments, especially in areas where near-surface velocity complexity results in poor-quality reflection data. Nevertheless, the primary objective behind using passive seismic methods such as drill bit noise imaging is to obtain similar data to active source methods by spending less. This is particularly important in geotechnical investigations where the imaging zone is usually small and often shallow and deploying expensive active source acquisition equipment is not economically justified. Additionally, near-surface methods and geotechnical investigations are commonly implemented by drilling several shallow boreholes, which can provide enough acoustic energy for imaging the subsurface using passive seismic methods. If the cost objective is met in practice by an efficient data acquisition and processing approach, using seismic methods can become more affordable and hence more widely used by smaller mineral exploration and geotechnical investigation companies that were unable to use it before.
In drill bit noise imaging, the continuous hammering action of the bit in the borehole generates a waveform that is more similar to that of a Vibroseis sweep in active source seismic surveys (Poletto and Miranda, 2004). Similar to the role of a pilot sensor in a vibrator machine, an accelerometer is planted on the drill stem or the rig (swivel) to continuously record the bit signal as the drilling operation progresses (Rector and Hardage, 1992). This signal, the pilot trace, is then cross-correlated with the raw geophone recordings over a window of several tens of seconds to produce a seismogram with seismic events that are usually identifiable. In practice, seismic recordings associated with a short drilling interval are cross-correlated with the pilot signal and stacked to increase the signal-to-noise ratio. The autocorrelation of the pilot signal is then deconvolved from cross-correlated seismograms to produce an initial shot record that can represent an impulsive source in depth (Vasconcelos and Snieder, 2008). These seismograms are then used to produce virtual shot records on the surface following the principles of seismic interferometry or further corrected for differences in time to generate IVSP data. Cross-correlation of pilot signal with the geophone recordings results in seismic events with travel times that are relative to pilot sensor. To derive shot records that correspond to the bit at its zero excitation time, P-wave travel time along the drill string is added to cross-correlated seismograms in a step known as pilot delay correction (Poletto and Miranda, 2004). Pilot-delay-corrected shot records can then be regarded as equivalent to IVSP data and processed accordingly for a subsurface image.
Seismic interferometry states that cross-correlation of data, recorded by two receivers, transforms these data into traces that would be recorded by one receiver acting as source. Wapenaar et al. (2010a) present an example for converting a seismometer station to a virtual source of Rayleigh waves by cross-correlating its trace with the traces of 400 other seismometers (USArray stations) that cover the entire state of California. In that study, 3 years of ambient noise recordings were cross-correlated to generate the virtual source record. In the borehole, first-order VSP ghosts can be transformed into virtual primary reflection events through interferometry (Schuster, 2014). Figure 1 illustrates the concept of interferometric transformation of VSP data to surface seismic recordings schematically.
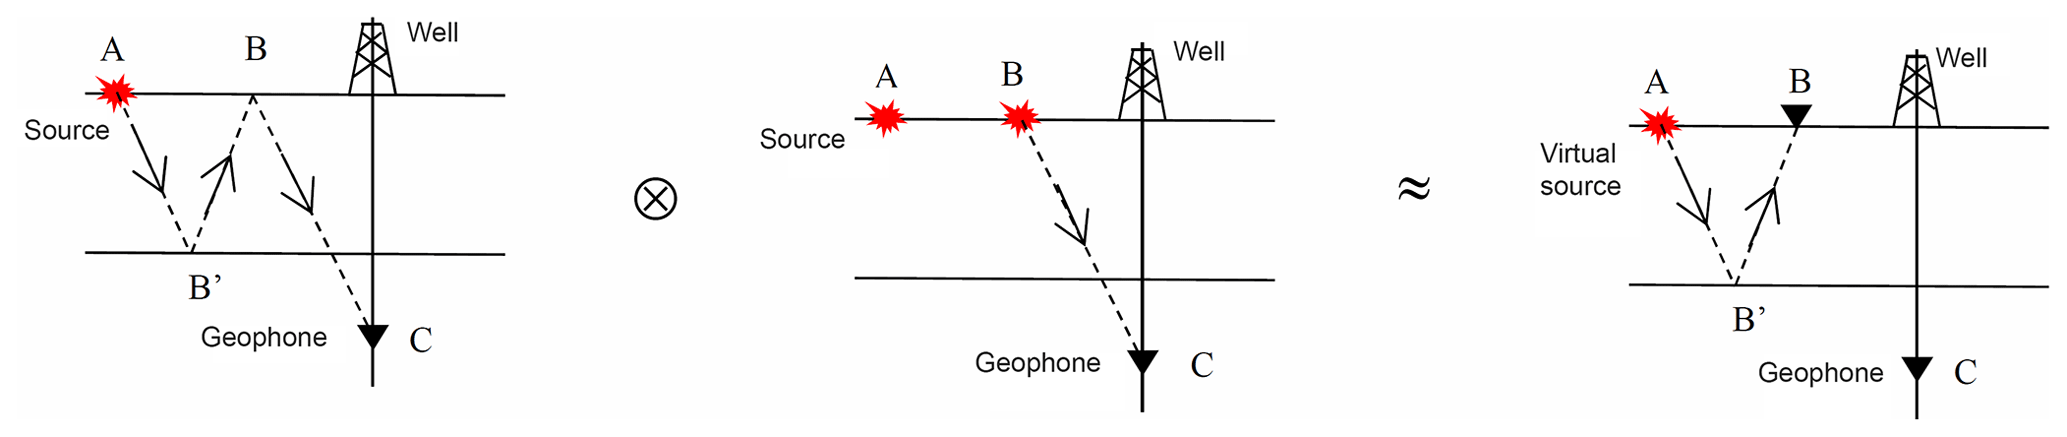
In Fig. 1, the phase associated with the common ray path (B to C) for sources A and B is canceled after the cross-correlation of traces recorded by downhole geophone C. In practice, several geophone recordings in the borehole are stacked in order to cancel out the waveform related to common ray path BC. Equation (1) describes the relationship between various modes in Fig. 1 for interferometric VSP to surface seismic transformation:
The first term in the left side of Eq. (1), d(B,t|A), describes the trace recorded by the virtual geophone at location B from the virtual source at A. The second term in the left side of Eq. (1), c(t), represents the autocorrelation of the source wavelet in A. The right side of the Eq. (1) presents the sum of the cross-correlation of the wave fields recorded by the borehole geophones at C, d(C,t|A), and d(C,t|B) from the sources at A and B, respectively. In Eq. (1), ⊗ stands for the cross-correlation operator. Equation (1) is equally valid for IVSP acquisition setup (reciprocity principle), where the stacking of cross-correlated traces takes place over a number of sources in the borehole.
Yu and Schuster (2006) present a workflow for migrating virtual source data (ghost and direct wave migration) generated by cross-correlation and stacking of IVSP data which can also be applied to drill bit passive measurements on the surface. To produce virtual sources, IVSP data are first separated into upgoing and downgoing waves, followed by source wavelet deconvolution from downgoing arrivals. Next, direct arrivals are windowed out from the downgoing and deconvolved dataset and are cross-correlated with the remaining part in the downgoing dataset. This will assure that virtual multiples are not created by correlating the traces. Finally, the results of cross-correlations for all the source positions in the borehole are summed to generate virtual source traces. Virtual source data can then be migrated by the diffraction stack migration algorithm.
Ghost and direct (interferometric) migration of IVSP data has many advantages over standard IVSP imaging methods that make it particularly desirable for drill bit noise imaging, where the drill bit position in depth is difficult to link to recorded data. In interferometric migration, source locations in the borehole need not be known as a priori information, as the cross-correlated seismograms are stacked independent of source depths. Furthermore, source-related statics do not influence the interferometric migration. This allows us to dismiss pilot delay estimation and the correction step that was necessary in standard IVSP imaging. Also, in contrast to standard migration methods, interferometric migration can be applied to non-impulsive source wavelets such as those encountered in drill bit imaging (Yu and Schuster, 2006). Finally, as stated earlier, interferometric migration creates a wider subsurface illumination zone than standard VSP migration methods. The main disadvantage of the interferometric migration of drill bit data is the introduction of virtual multiples in the final image as a result of inefficient direct wave and ghost separation before cross-correlation. To make the matter even worse, windowing out the ghost arrivals from the direct P-wave event may not be an option in drill bit imaging if the pilot deconvolution has not been effective in converting the bit signal to an impulse. In such cases, full trace recording is cross-correlated with the traces of other geophones to produce virtual shot records, but the migration results must be scrutinized for the existence of coherent virtual multiples.
Poletto et al. (2010) analyze the results of interferometric drill bit imaging for a roller cone bit drilling experiment with and without using a pilot trace. For the case where no pilot measurement is used, the standard form of interferometry, they consider the geophone trace at the location of virtual source as the reference trace and cross-correlate it with the traces of other geophones along the seismic line while deconvolving the autocorrelation of this trace (as source signal) in a process called interferometry by deconvolution (Vasconcelos and Snieder, 2008). They acknowledge that some uncorrelated noise, such as drill yard noise, that could be minimized by pilot cross-correlation may enter the results of standard interferometry and that a much better deconvolution could be obtained if pilot measurements were used. The focusing capability of large arrays of geophones on the surface can also be used to obtain the drill bit signal and the deconvolution filter. Haldorsen et al. (1994, 1995) describe this approach in four processing steps. First, apply focusing analysis to find the velocity that focuses most of the energy back at the bit location. This velocity gives the first estimate of move out times. Second, find and apply a deconvolution filter that best spikes the move-out-corrected traces in step one. Third, correct the move out times by picking the first break times on the deconvolved traces and repeat step two. Finally, migrate the deconvolved data using the generalized radon transform (GRT) migration algorithm described in Miller et al. (1987). This method nevertheless requires large (source–receiver) offset measurements on the surface in order to effectively use event separation in time (move out) for velocity estimation.
In this study, we follow the interferometry approach proposed by Poletto et al. (2010), for the case where there is no pilot signal measurement available. We evaluate the potential of a 3-D seismic while drilling dataset for subsurface imaging by comparing the passive migration results along a 2-D subset line with the images of an active source seismic survey. As pilot trace recordings on either the drill stem or the rig (the swivel) were unavailable in this survey, we used traces of the nearest geophone to the rig as an approximation to the drill bit source function and used these traces to deconvolve the autocorrelation of the source function from cross-correlated traces in virtual shot records. We then migrated the virtual shot records in depth using a simple velocity model and assessed the results against an active source seismic image. We will discuss the results of this study and propose our recommendations and conclusions at the end of this paper.
In June 2017, Curtin University acquired two sets of 3-D seismic surveys for BHP Minerals Australia over an iron ore prospect on the northern flank of the Fortescue Valley in the Pilbara region of Western Australia. The geology consists of the Marra Mamba Iron Formation, slowly dipping to the south into the Fortescue Valley. The area is covered with tertiary detrital sediment of varying thickness and composition. The aim of the seismic investigation was to image the shallow detrital–bedrock contact, image the major shale unit at the base of the iron formation, and identify the major ore-controlling structures.
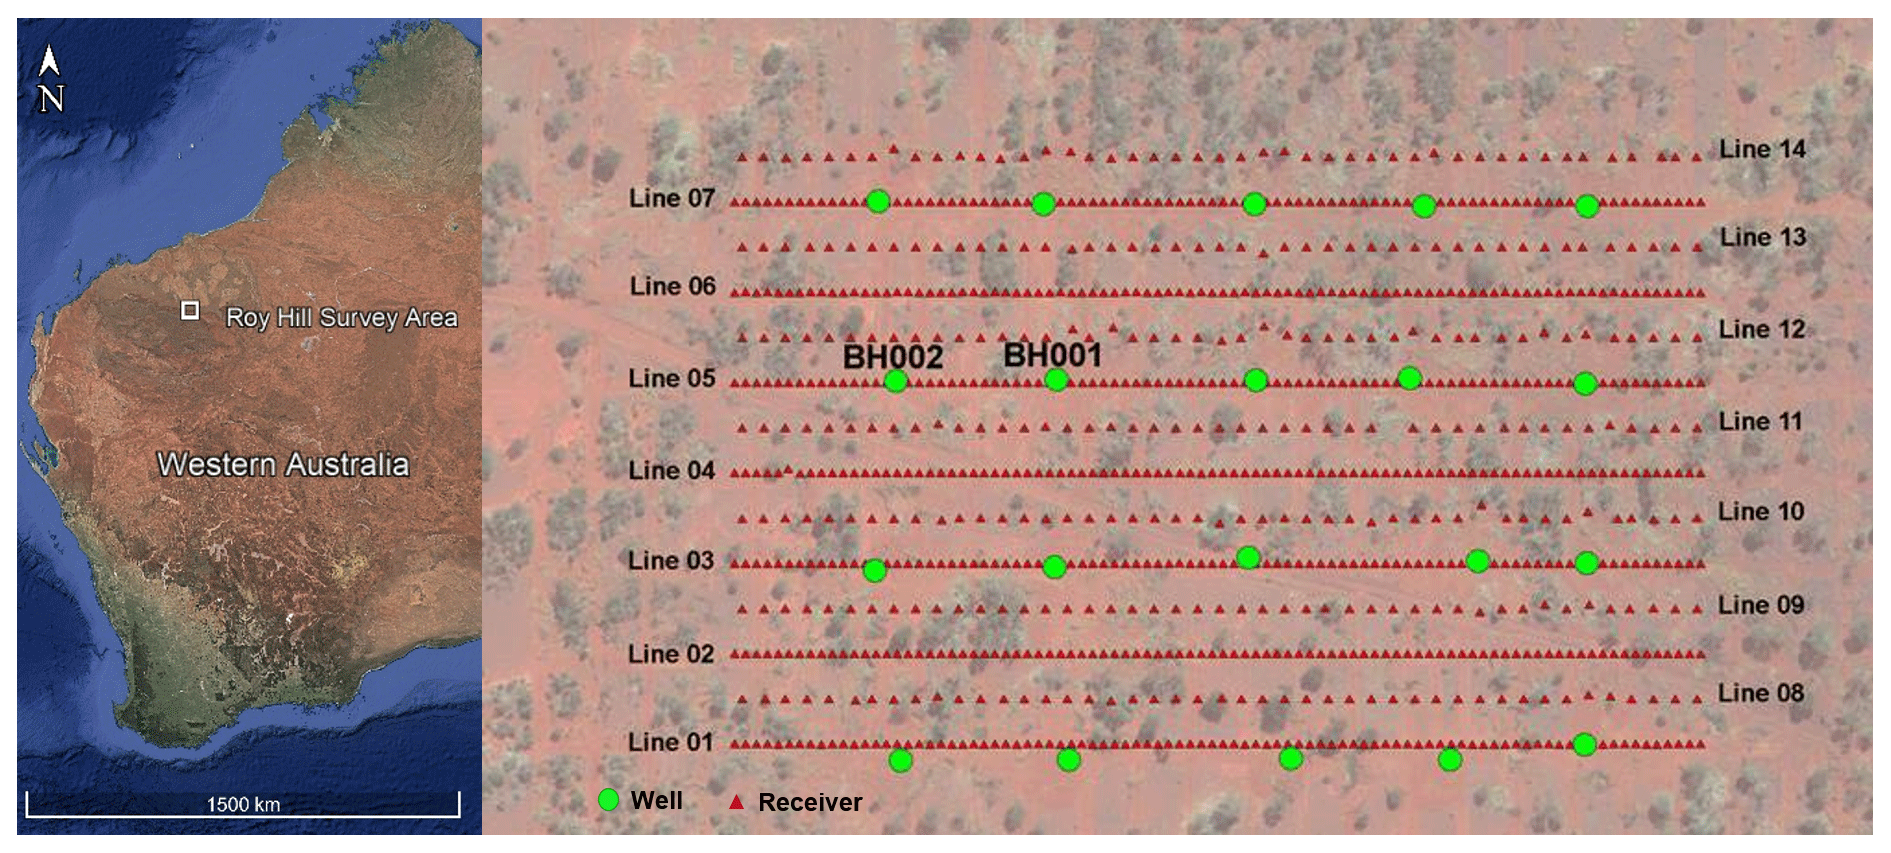
Figure 2(a) Survey area in Western Australia and (b) receiver line geometry and the location of exploration wells in the survey.
Table 1A summary of seismic survey acquisition parameters at Roy Hill. Dashes indicate that no drilling mechanism was used.

The two surveys share a common receiver spread on the surface, with a weight drop mechanism being used as the seismic energy source in the active survey. The passive survey was recorded simultaneously, with the drilling of 19 exploration wells in a 50 m by 50 m pattern in the survey area and was comprised of only vertical component geophone recordings. Drillers used the reverse circulation (RC) method to drill all the wells in the survey area. The drilling mechanism in RC methods is often comprised of a pneumatic reciprocating piston, known as a hammer, a tungsten-steel drill bit that crushes the rock, and a dual-wall drill rod that transfers rock cuttings to the surface using high-pressure air. Figure 2 illustrates the passive survey geometry and the location of wells in the survey area. Receivers are spread along 14 east–west-oriented lines at 12.5 m line intervals with alternating 96 and 49 receiver stations along receiver lines 1–7 and 8–14, respectively. Geophone spacing is 3 m and 6 m over lines 1–7 and 8–14, respectively. Only stations 1 to 90 along lines 1–7 and 1 to 45 along lines 8–14 were selected for this study. The aim of the passive seismic (while drilling) exercise was to determine if passive seismic data can be processed and imaged to provide a comparable dataset to the active seismic source dataset.
Passive survey data were recorded continuously by Sercel's autonomous Unite nodes over the course of drilling and were stored in 7359 files, with each file containing 30 s of drilling signals. Each field file records 975 traces and each trace contains 15 001 samples at 2 ms sampling rate. Table 1 provides a summary of the acquisition parameters for the passive survey at Roy Hill.
Processing seismic while drilling data for the purpose of virtual shot generation using interferometry methods requires isolating drill-bit-generated (P-wave) sound from other types of seismic waves that are recorded by geophones on the surface. Figure 3 demonstrates 2 s of raw data in both time–offset and frequency–wavenumber (FK) domains that were recorded by geophones along the receiver line 5 and while well BH001 was being drilled. Trace amplitudes in Fig. 3a were normalized and gained before FK analysis in Fig. 3b. Traces recorded by geophones over the drill pad, the white stripe in Fig. 3a, were muted before further processing.

Figure 3(a) The 2 s of passive seismic data recorded along receiver line 5 and while drilling well BH001. (b) The same data as in (a) shown in the frequency–wavenumber (FK) domain. Note the aliased airwave and appearance of strong mono-frequency energy in (b). Panel (c) shows data in (a) after the application of an FK filter where the energy outside the polygon is rejected. Note the seismograms in (c) are dominated by bit-related mono-frequency energy seen in (b).
In Fig. 3a, surface waves (ground roll) can be easily identified as the high-energy linear event dipping in opposite directions at either side of the well. In Fig. 3b, ground roll can be identified as linear events with a velocity of ±700 ms−1 and with seismic energy in the frequency range of up to 30 Hz. The noise created by wind can also be identified in Fig. 3b as a linear event that is aliased at near 60 Hz with a velocity of 340 ms−1. Flat events with high energy in Fig. 3b correspond to drilling operations and energy generated by the hammering action of the bit. These events contain a lot of energy and appear at random frequency bands in the data. After reviewing several shot records in the survey, we decided to remove the linear noise with an apparent velocity under 1500 ms−1 and frequency over 110 Hz. This was implemented by applying the FK filter specified by the polygon in Fig. 3b. Figure 3c shows the data in Fig. 3a after applying the FK filter. The monochromatic character observed in Fig. 3c is caused by the flat and high-energy modes retained inside the polygon in Fig. 3b.
Before we start cross-correlating bit data for interferometry migration, we can check the potential of using this dataset for virtual shot generation on the surface by cross-correlating the raw data gathers and comparing the results with active source data. We will cross-correlate raw geophone recordings for one of the wells and produce a virtual shot record at the location of that well. Following this, we will compare it with the raw shot record extracted from the active source survey at the location of virtual shot. Note that, in our analysis, we only select a well that is in-line with the receiver line, in order to meet the stationary source positioning requirement of the direct wave interferometry (Roux et al., 2005; Campillo and Roux, 2015; Schuster, 2014).
Figure 4a shows the virtual shot created by cross-correlating, deconvolving, and stacking (interferometry by deconvolution) of raw data recorded while well BH002 was being drilled. For each field record, the nearest geophone trace to well BH002 was taken as the source signal and was cross-correlated with the rest of the traces along line 5 while being simultaneously deconvolved from the cross-correlated traces. This process is then repeated for all the recorded files from surface to the bottom of the well and the results are stacked to produce Fig. 4a. Note that in Fig. 4a the causal time in cross-correlation starts at 30 000 ms, but energy arrives about 50 ms earlier. Figure 4b shows the traces of the shot record taken from the active source 3-D survey with the source position at well BH002 and receivers confined to line 5. The passive shot has acquired a signal-to-noise ratio proportional to that of active source measurements. High-energy ground roll, refracted P-waves, and shear waves have all been reproduced by the interferometry process.
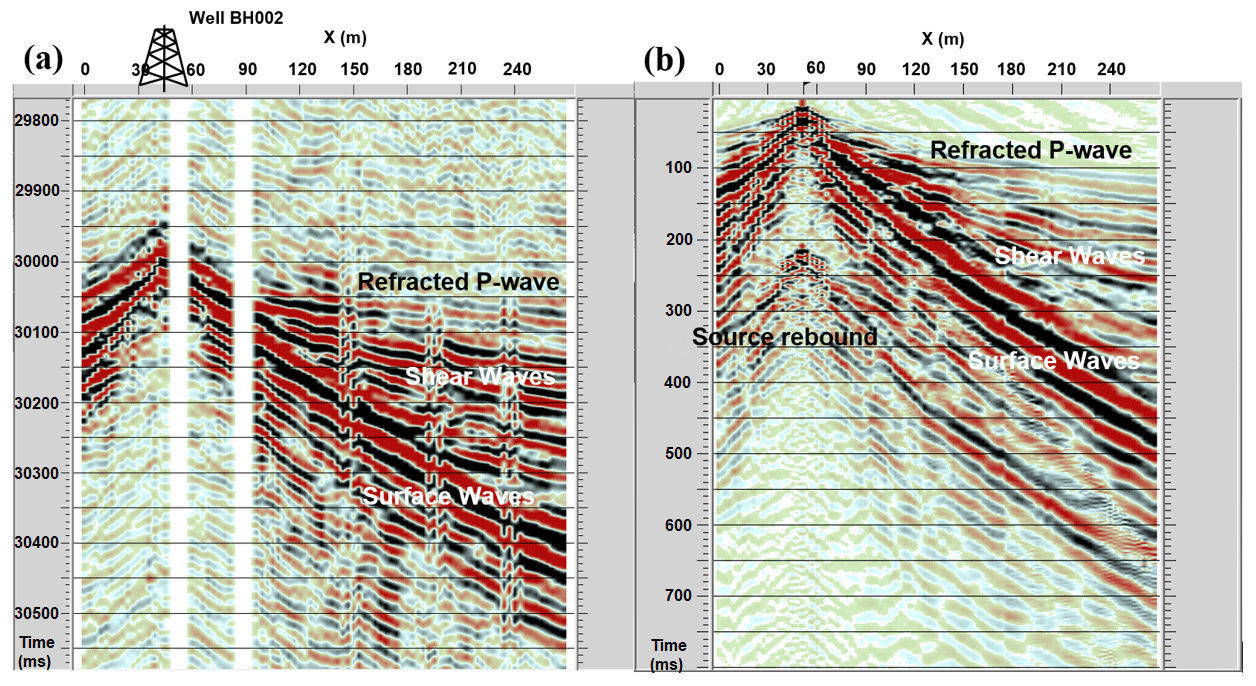
Figure 4(a) The results of interferometry by deconvolution of the raw data at the location of well BH002 against the active source gathering recorded at the same location (b). Note the weight drop source rebound energy recorded in (b).
In this step, we will first cross-correlate bit data isolated by FK filtering with the trace of the geophone at the nearest position to the well to produce initial seismograms. We will then follow the approach proposed by Poletto et al. (2010) for standard interferometry of drill bit noise data and interferometry by deconvolution (Vasconcelos and Snieder, 2008) to produce virtual shot records from the seismograms. In the final step, we will migrate the shots in depth using a three-layer velocity model.
Figure 5a shows the traces of virtual source generated from bit noise (Fig. 3c) at the location of well BH001 at X=96 m. The traces of virtual source were simultaneously deconvolved by the reference trace's autocorrelation during the cross-correlation operation. Figure 5b shows the three-layer velocity model used to migrate virtual shot records to the depth domain. For each grid point in the model, P-wave reflection travel times were computed by ray tracing from the location of the virtual source on the surface to the image point and back to the receivers on the surface. Figure 5c shows the P-wave travel time field computed by ray tracing for the migration of virtual source shown in Fig. 5a. Figure 5d shows the results of Kirchhoff migration for virtual shots generated by interferometry of passive data recorded along line 5 and while drilling well BH001. Figure 5e shows the seismic profile colocated with line 5 that was extracted from the depth-converted active source 3-D survey. Similar velocities as in Fig. 5b were used to depth-convert the surface seismic survey. Figure 5f and g show the normalized power spectrum of the passive and active source seismic profiles in Fig. 5d and e, respectively.
Making a comparison between Fig. 5d and e, in spite of using only a geophone trace for pilot cross-correlation and deconvolution, the geological character of the subsurface under receiver line 5 has been successfully recovered in the first 200 m interval. Four main seismic events (1 to 4) are highlighted in green boxes in Fig. 5d. Events with similar character can be identified in Fig. 5e that are also highlighted and numbered for comparison. There is, however, a slight mismatch in depth between the highlighted events 1 to 4 in two figures that is more likely caused by using a three-layer (flat) velocity model in migration that is not capturing all the details of near-surface heterogeneity. We refrained from using the velocity model derived using 3-D active source seismic processing, as it resulted in less coherent horizons and lower signal-to-noise ratio in the passive image. In event 5, a strong peak does not appear in interferometric image, and events 6 and 7 do not show up in active source image. Events 6 and 7 (and many other deeper events) may represent virtual multiples, as we did not separate and cross-correlate the direct wave with the later ghost arrivals as described in IVSP ghost and direct migration. This was mainly due to unavailability of pilot recordings and inadequate pilot deconvolution in this study. Incomplete pilot deconvolution results in non-impulsive direct arrivals that cannot be separated from associated ghost arrivals for more efficient ghost and direct cross-correlation.
Furthermore, we observe noticeable differences in vertical resolution between the passive image and the active source image in Fig. 5d and e. This difference can be explained by the distribution of passive and active source seismic energy in frequency domain shown in Fig. 5f and g. Passive energy drops significantly (<20 %) over 70 Hz, while this value is about 120 Hz for the active source data.

Figure 5(a) Virtual source at the location of well BH001. (b) Velocity model used in depth migrating drill bit noise and depth conversion of active source seismic volume. (c) P-wave travel time field computed for the virtual source at the location of well BH001. (d) The results of drill bit noise migration in depth. (e) Active source seismic image extracted from a depth-converted volume along receiver line 5. Panels (f) and (g) show the average (and normalized) power spectrum of the passive image and active source image, respectively.
We recorded a 3-D passive dataset using vertical component geophone nodes and while drilling several shallow exploration wells over a small iron ore prospect in the Pilbara region of Western Australia. We also recorded a second 3-D survey in the same area using weight drop sources with an identical receiver setup to that of passive survey. The objective was to check the accuracy of interferometric migration by comparing the results with the results of active source migration. To reveal the signal generated by the bit, we removed the strong linear noise (e.g., rig generated surface waves) by applying a filter in the FK domain. Here, we only used while drilling data recorded along line 5 for well BH001 to produce interferometric shots on the surface. Well BH001 is the deepest well in the survey area (with a bottom of 189 m in depth), and this enhanced the signal-to-noise ratio of the cross-correlation result by stacking more traces. This is intuitive because well BH001 penetrates into the deeper strata, meaning it faces harder rock material with a longer drilling time that leads to more acoustic energy being emitted into the surrounding formations and hence a stronger signal being recorded by geophones on the surface.
If the pilot trace recording is not available, then the geophone recording of the closest station to the rig can be used as a rough approximation of source signal. As pilot signals were not recorded for this survey, we used the recording of the nearest geophone to well BH001 for pilot cross-correlation and pilot deconvolution. This, however, impacted both the pilot cross-correlation and pilot deconvolution by producing seismograms with more a complex shape and non-impulsive appearance.
To minimize the effect of suboptimal deconvolution, we reshaped the spectra of the traces during deconvolution. This process significantly reduced the monochromatic character of the output seismograms before cross-correlation and generating virtual shots. We then produced virtual sources on the surface by cross-correlating the trace at the position of the virtual source, which was the reference trace with the rest of the traces along line 5. In this process, every geophone on the seismic line is turned into a virtual source while every other geophone becomes a virtual receiver for that source. To migrate virtual shot gathers, we used a three-layer P-wave velocity model with values close to those used in active seismic depth conversion. We generated a time field for each source by ray tracing in the model and used these time values to migrate the shots. Comparing the image derived from drill bit interferometry with the active source image verifies that despite the introduction of some strong coherent noise (virtual multiples) in the interferometric image (events 6 and 7 in Fig. 5d) that is caused by inadequate pilot deconvolution and cross-correlation, the main subsurface structure has been successfully recovered by bit noise migration. There is, however, a slight mismatch in depth between similar events in two images that is caused by using an overly smooth and simple velocity structure in the migration.
Based on the results of this study, we summarize the following important conclusions about drill bit noise imaging without a pilot signal.
-
Drill bit noise can be recorded passively and used to produce a reasonably accurate image of the subsurface using interferometry methods, even in the absence of rig pilot measurements.
-
The results of drill bit interferometric imaging with no pilot measurements should nonetheless be checked for virtual multiples and inconsistencies in depth.
-
Drilling deeper wells leads to larger signal-to-noise ratio in the final image as more data enter the stacking process described by the interferometry equation. This might be overruled, however, by the length of the wave's travel path (also spherical divergence) and the level of energy absorption in the surrounding rocks.
-
Longer receiver lines will enable us to carry out the migration in the common offset domain, where an accurate estimate of subsurface velocity can be obtained and used for a better migration.
-
Larger offset-to-depth ratios will also enable us to carry out a more effective focusing analysis on geophone data, where an active seismic source can be simulated at the bit location with an estimate of normal moveout (NMO) velocity that can be used in the migration.
Finally, for each field case, various types of passive signals and the effect of the Earth's near-surface velocity heterogeneity on drill bit noise should be fully understood and accounted for in the preprocessing step before one can apply routine seismic while drilling and interferometry algorithms to these data and offer the results as an alternative solution to active source seismic surveys.
Based on the research collaboration agreement with our sponsor and considering the nature of the dataset used in this publication we are not able to make the dataset accessible to the public at the date of publication.
MA wrote the manuscript. MA and AB developed the algorithms for virtual source generation and migration. AG and MU were consulted for the analysis and processing of passive seismic data. AG and MU designed the data acquisition and fieldwork. MU and AB supervised the analysis of passive data in this study.
The authors declare that they have no conflict of interest.
This article is part of the special issue “Advances in seismic imaging across the scales”. It is a result of the 18th International Symposium on Deep Seismic Profiling of the Continents and their Margins, Cracow, Poland, 17–22 June 2018.
The authors of this paper would like to thank BHP Minerals Australia for allowing the publication of the results of the passive seismic imaging study at Roy Hill. We greatly appreciate Halliburton for providing us with access to the Landmark seismic processing products. We appreciate MathWork for providing us with the access to MATLAB programming software. We appreciate the effort from the seismic acquisition crew at Curtin University doing the fieldwork for this study. We appreciate the support provided by Sasha Ziramov for the access to 3-D active seismic dataset. We also acknowledge Robert Verstandig's fantastic work in keeping the network, software, and cluster computers up and running during the time of this study.
This paper was edited by Charlotte Krawczyk and reviewed by two anonymous referees.
Campillo, M. and Roux, P.: Seismic imaging and monitoring with ambient noise correlations, Treatise on geophysics, Elsevier, Oxford, GB UK, 2015.
Haldorsen, J. B. U., Miller, D. E., and Walsh, J. J.: Multichannel Wiener deconvolution of vertical seismic profiles, Geophysics, 59, 1500–1511, https://doi.org/10.1190/1.1443540, 1994.
Haldorsen, J. B. U., Miller, D. E., and Walsh, J. J.: Walk-away VSP using drill noise as a source, Geophysics, 60, 978–997, https://doi.org/10.1190/1.1443863, 1995.
Miller, D., Oristaglio, M., and Beylkin, G.: A new slant on seismic imaging: Migration and integral geometry, Geophysics, 52, 943–964, https://doi.org/10.1190/1.1442364,1987.
Poletto, F. and Miranda, F.: Seismic while drilling fundamentals of drill-bit seismic for exploration, Seismic Exploration, Elsevier, Milan, Amsterdam, Boston, Heidelberg, London, New York, Oxford, 2004.
Poletto, F., Corubolo, P., and Comelli, P.: Drill-bit seismic interferometry with and without pilot signals, Geophys. Prospect., 58, 257–265, https://doi.org/10.1111/j.1365-2478.2009.00832.x, 2010.
Rector, J. W. and Hardage, B. A.: Radiation pattern and seismic waves generated by a working roller-cone drill bit, Geophysics, 57, 1319–1333, https://doi.org/10.1190/1.1443199, 1992.
Roux, P., Sabra, K. G., Kuperman, W. A., and Roux, A.: Ambient noise cross correlation in free space: Theoretical approach, J. Acoust. Soc. Am., 117, 79–84, https://doi.org/10.1121/1.1830673, 2005.
Schuster, G. T.: Seismic Interferometry, Cambridge University Press, Cambridge, 2009.
Schuster, G. T.: Seismic Interferometry, Encyclopedia of Exploration Geophysics, Q1-1–Q1-41, Society of Exploration Geophysicists, Oklahoma, USA, 2014.
Vasconcelos, I. and Snieder, R.: Interferometry by deconvolution: Part 2 – Theory for elastic waves and application to drill-bit seismic imaging, Geophysics, 73, S129–S141, https://doi.org/10.1190/1.2904985, 2008.
Wapenaar, K., Draganov, D., Snieder, R., Campman, X., and Verdel, A.: Tutorial on seismic interferometry: Part 1 – Basic principles and applications, Geophysics, 75, 75A195–75A209, https://doi.org/10.1190/1.3457445, 2010a.
Wapenaar, K., Slob, E., Snieder, R., and Curtis, A.: Tutorial on seismic interferometry: Part 2 – Underlying theory and new advances, Geophysics, 75, 75A211–75A227, https://doi.org/10.1190/1.3463440, 2010b.
Yu, J. and Schuster, G. T.: Crosscorrelogram migration of inverse vertical seismic profile data, Geophysics, 71, S1–S11, https://doi.org/10.1190/1.2159056, 2006.