the Creative Commons Attribution 4.0 License.
the Creative Commons Attribution 4.0 License.
 | 14 Nov 2019
Large-scale electrical resistivity tomography in the Cheb Basin (Eger Rift) at an International Continental Drilling Program (ICDP) monitoring site to image fluid-related structures
Tobias Nickschick
Christina Flechsig
Jan Mrlina
Frank Oppermann
Felix Löbig
Thomas Günther
The Cheb Basin, a region of ongoing swarm earthquake activity in the western Czech Republic, is characterized by intense carbon dioxide degassing along two known fault zones – the N–S-striking Počatky–Plesná fault zone (PPZ) and the NW–SE-striking Mariánské Lázně fault zone (MLF). The fluid pathways for the ascending CO2 of mantle origin are one of the subjects of the International Continental Scientific Drilling Program (ICDP) project “Drilling the Eger Rift” in which several geophysical surveys are currently being carried out in this area to image the topmost hundreds of meters to assess the structural situation, as existing boreholes are not sufficiently deep to characterize it.
As electrical resistivity is a sensitive parameter to the presence of conductive rock fractions as liquid fluids, clay minerals, and also metallic components, a large-scale dipole–dipole experiment using a special type of electric resistivity tomography (ERT) was carried out in June 2017 in order to image fluid-relevant structures. We used permanently placed data loggers for voltage measurements in conjunction with moving high-power current sources to generate sufficiently strong signals that could be detected all along the 6.5 km long profile with 100 and 150 m dipole spacings. After extensive processing of time series for voltage and current using a selective stacking approach, the pseudo-section is inverted, which results in a resistivity model that allows for reliable interpretations depths of up than 1000 m.
The subsurface resistivity image reveals the deposition and transition of the overlying Neogene Vildštejn and Cypris formations, but it also shows a very conductive basement of phyllites and granites that can be attributed to high salinity or rock alteration by these fluids in the tectonically stressed basement. Distinct, narrow pathways for CO2 ascent are not observed with this kind of setup, which hints at wide degassing structures over several kilometers within the crust instead. We also observed gravity and GPS data along this profile in order to constrain ERT results. A gravity anomaly of ca. −9 mGal marks the deepest part of the Cheb Basin where the ERT profile indicates a large accumulation of conductive rocks, indicating a very deep weathering or alteration of the phyllitic basement due to the ascent of magmatic fluids such as CO2. We propose a conceptual model in which certain lithologic layers act as caps for the ascending fluids based on stratigraphic records and our results from this experiment, providing a basis for future drillings in the area aimed at studying and monitoring fluids.
- Article
(7922 KB) - Full-text XML
- BibTeX
- EndNote


Over the last decades, methods to study the electric resistivity of the subsurface – such as magnetotellurics (e.g., Muñoz et al., 2018 or Blecha et al., 2018) and electrical resistivity tomography (ERT; e.g., Storz et al., 2000; Schütze and Flechsig, 2002; Schmidt-Hattenberger et al., 2013) – have proven to be especially useful when fluids are involved, as they are used as efficient techniques for noninvasive imaging of subsurface structures. A multitude of experiments that focus on carbon dioxide in particular have been carried out, mainly at carbon capture and storage sites, which are typically well explored and where the fluid injection system is controllable (Carrigan et al., 2013; Nakatsuka et al., 2010; Schmidt-Hattenberger et al., 2013; Bergmann et al., 2017). However, when it comes to natural CO2 emanation sites, such as volcanically or magmatically active areas, this is often not the case: the fluid system can often be very complex and variable in space and time, hence requiring special approaches (Finizola et al., 2009; Pettinelli et al., 2010; Revil et al., 2008, 2011; Gresse et al., 2017). Furthermore, many methods that focus on fluids are often limited in their resolution and/or depth when it comes to studying those fluids, their migration, and interactions with the host rock. One major target site for this kind of study is the western Eger Rift in Central Europe that has been a center of research for various mantle gas and fluid-related studies within the last 2 decades. It can be called a natural analog to carbon capture and storage sites where methods used for the detection and monitoring of CO2 and fluids in general can be applied with great success (Schütze et al., 2012).
The Cheb Basin, located in western Bohemia–CZ near the border between Germany and the Czech Republic, particularly represents the western part of the Eger Rift – the easternmost segment of the European Cenozoic Rift System (Fig. 1, Ziegler, 1992; Ziegler and Dezes, 2007). The area is characterized by ongoing magmatic processes in the intra-continental lithospheric mantle. The most recent article on that topic by Hrubcová et al. (2017) hypothesizes that this is caused by magmatic underplating. These processes take place in the absence of any currently active volcanism at the surface – the latest activity known is linked to the eruption of two scoria cones (Železná hůrka and Komorní hůrka) and two maar-diatreme volcanoes (Mýtina maar and Neualbenreuth maar, Mrlina et al., 2007, 2009; Flechsig et al., 2015; Rohrmüller et al., 2018). However, they are expressed by a series of geodynamic phenomena like the occurrence of repeated earthquake swarms, surface exhalations of mantle-derived and CO2-enriched fluids in mofettes and mineral springs, and neotectonic crustal movements, which are not expected to occur in an intra-plate region (Bräuer et al., 2008, 2009; Fischer et al., 2014).
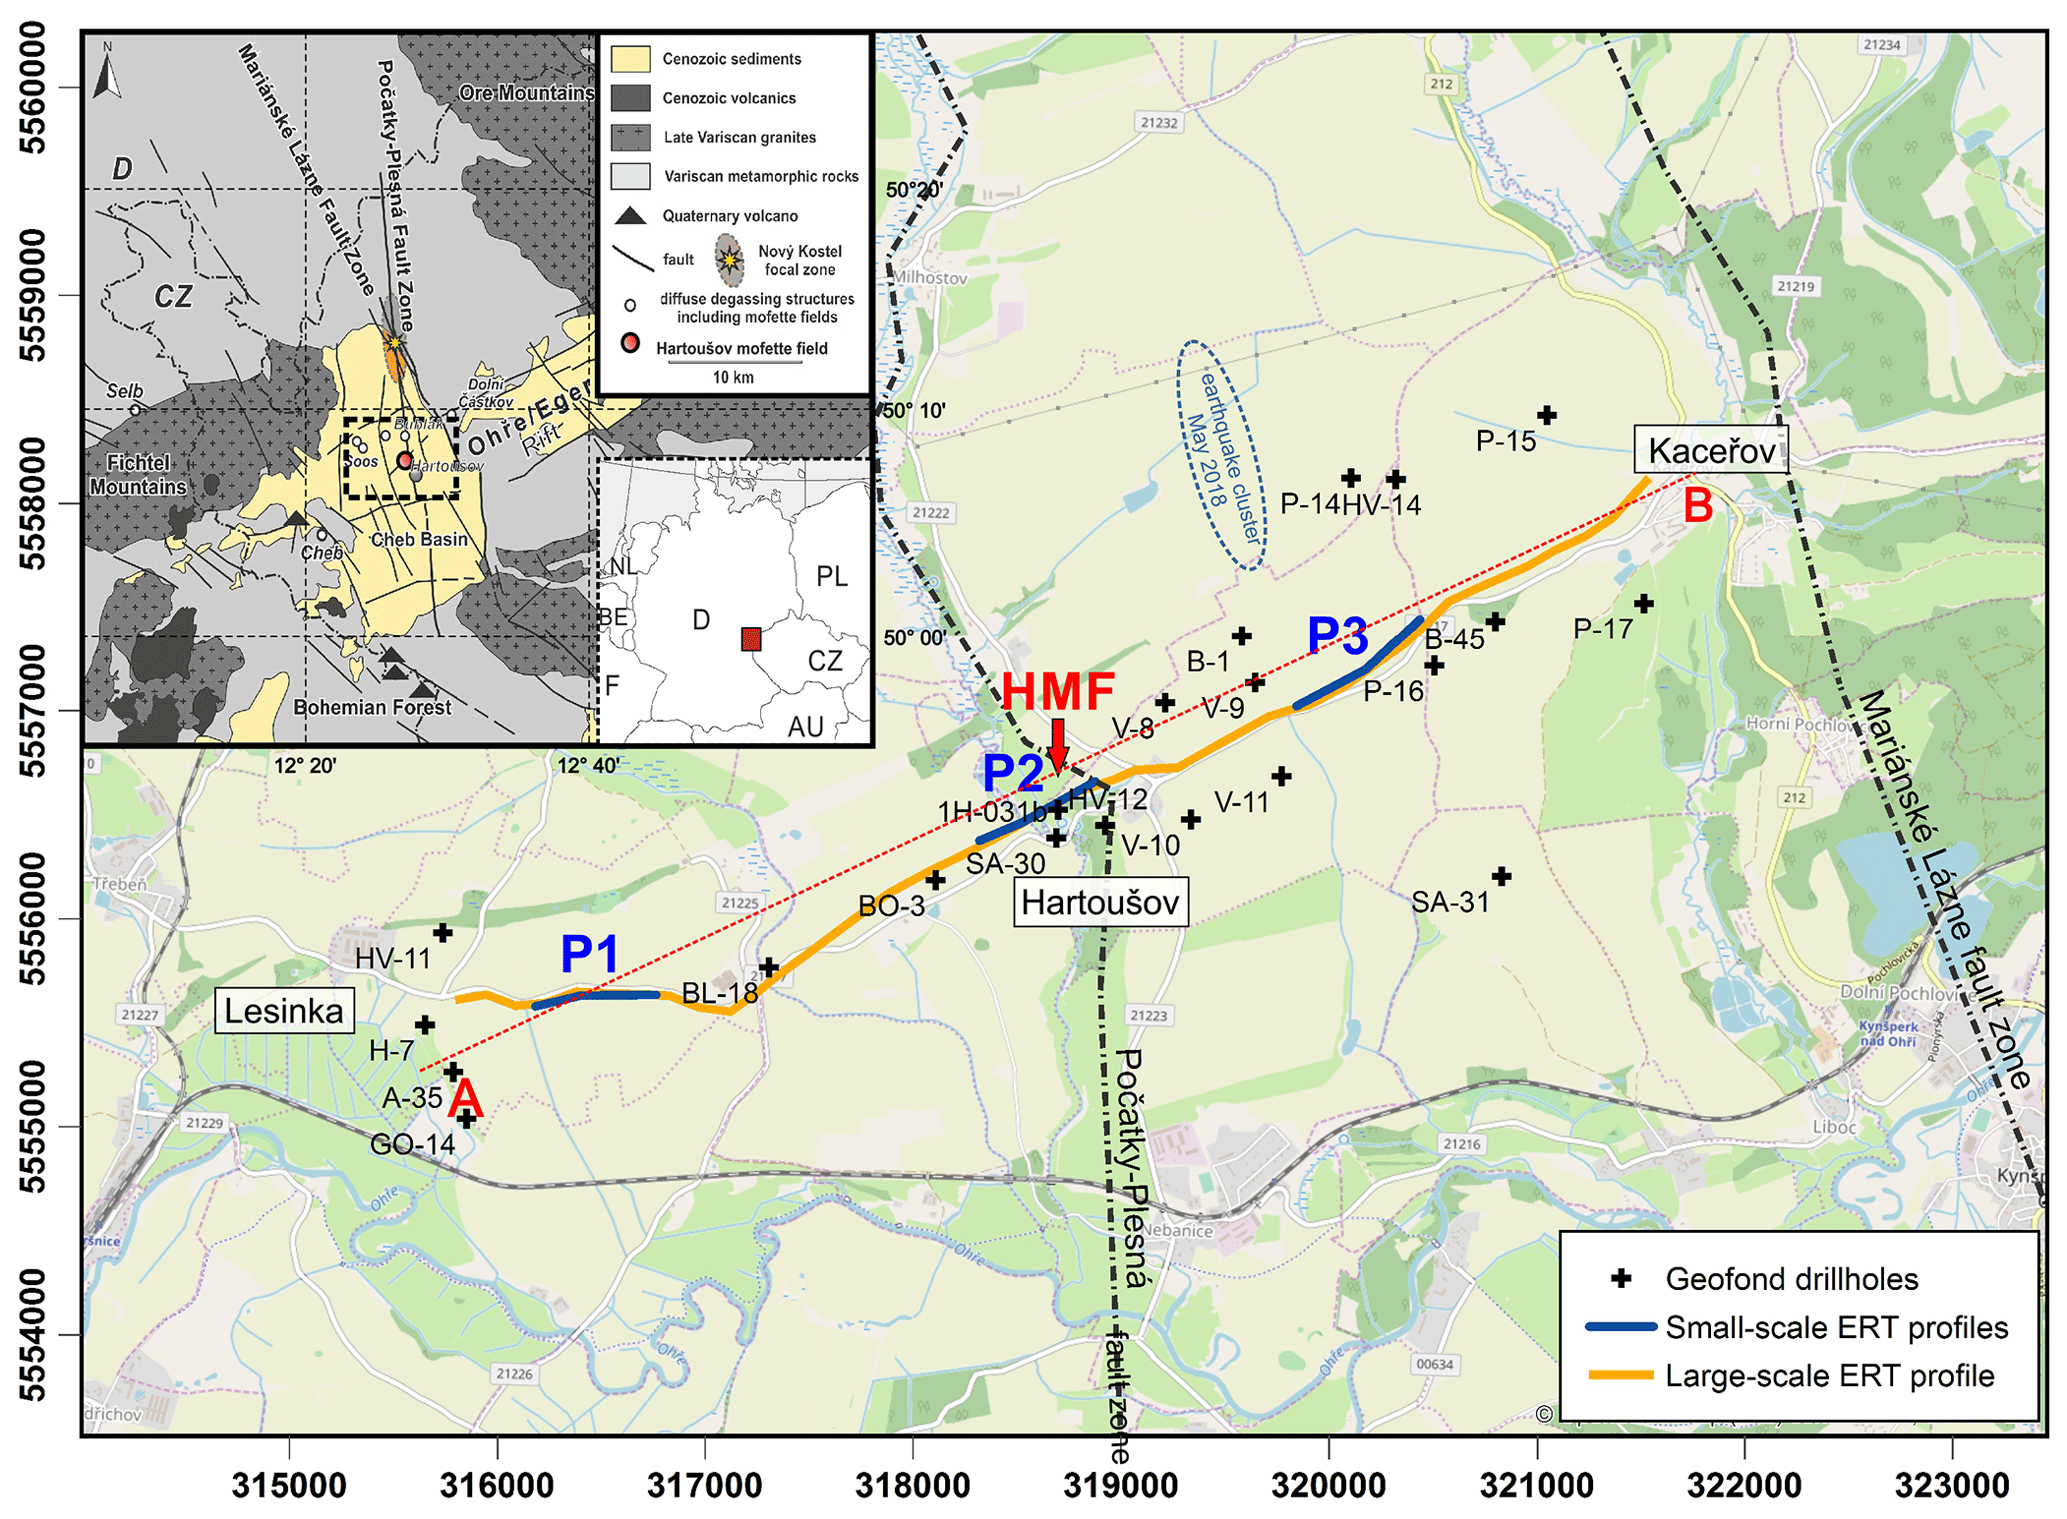
Figure 1Map of the measured large-scale ERT profile (6.5 km), small-scale 625–700 m long ERT profiles (P1, P2, P3), and existing drill holes (Czech Geological Survey) with lithological information. All coordinates are in UTM zone 33N. The red dotted line marks the location of the lithological transect in Fig. 2. The Počatky–Plesná zone (PPZ) and Mariánské Lázně fault zone (MLF) are drawn as the main tectonic features. HMF: Hartoušov mofette field. Inset: geological sketch map of the western Bohemia–Vogtland area and the Cheb Basin near the German–Czech border in Central Europe, modified from Flechsig et al. (2008), Dahm et al. (2013), and Bussert et al. (2017).
At present, the highest release of energy via earthquakes since 1985 and the emission of mantle-derived CO2 are taking place in the Cheb Basin – the former in the area around Nový Kostel and the latter at the Bublák and Hartoušov mofette fields at the surface, which is approximately 10 km south of the Nový Kostel focal area (Fig. 1). Earthquake swarms are sequences of hundreds or thousands of earthquakes with low to moderate magnitudes, mainly without main shock or aftershock behavior, that occur over weeks or months and that are typical for recent active volcanic, hydrothermal, or geothermal regions. Fluids are involved in these sequences, but their propagation and dissipation within the earth's crust has not yet been fully clarified. Several authors have discussed the potential influence of these fluids in triggering the earthquake swarms, in which CO2-dominated fluids of mantle origin migrate through the lithosphere, and how they are expected to act on fault zones (Weinlich et al., 1998; Heinicke and Koch, 2000; Bräuer et al., 2005, 2008, 2009; Kämpf et al., 2013; Fischer et al., 2014; Hainzl et al., 2016), but the relation between earthquake swarms and CO2 degassing is still in discussion (e.g., Babuška et al., 2016). The main focus of the current International Continental scientific Drilling Program (ICDP) project “Drilling the Eger Rift” is to understand the processes behind the origin of the swarm earthquakes in relation to the fluid and CO2 ascent, as well as their movement through and within the subsurface (“fluid-triggered lithospheric activity”) supported by a network of five boreholes (maximum depth 400 m) that serve different seismological, microbiological, and fluid monitoring aspects (Dahm et al., 2013). One of these key drill sites, the Hartoušov mofette field (HMF) near the village of Hartoušov, will consist of three separate drill holes of different depths (30, 108, and approximately 400 m) that will serve as monitoring stations for gas signature analyses, innovative sampling and monitoring of fluids and microorganisms, and seismological measurements. This drilling site was selected according to preliminary geological and geophysical investigations conducted in the area of the mofette field (Flechsig et al., 2008; Kämpf et al., 2013; Sauer et al., 2013; Schütze et al., 2012; Nickschick et al., 2015; Bussert et al., 2017) with information about the first 80–100 m.
Within the ICDP project “Drilling the Eger Rift”, we carried out a field experiment using large-scale electrical resistivity tomography (ERT; Fig. 1) as the favorable geophysical method to detect fluid signatures within the geological units to provide information about their migration through the basin based on electric resistivity. The method was chosen due to its high sensitivity to pore properties (porosity, salinity, fluid and gas content), as well as clay content. Profile lengths of more than 6 km are necessary to obtain investigation depths of over 1000 m and to resolve structures at this depth sufficiently precisely. ERT has proven to be a useful exploration technology for many geological, environmental, and engineering survey problems, since computerized multi-electrode devices composed of a transmitter and receiver in one unit are available. Unfortunately, the use of multi-electrode devices is limited to small layouts (approximately 100 electrodes and a spacing of 5–20 m in most cases between the electrodes), resulting in near-surface investigation depths of several tens of meters. In order to gain insight into greater depths, specific investigation strategies (dipole–dipole arrays), equipment (high-power sources and separate data loggers for voltage measurements), and extensive data processing are necessary.
The first theoretical considerations and practical tests for deep electrical sounding with dipole–dipole arrays are documented by Alfano (1974) and Alfano et al. (1982). Because of the logistical effort of large-scale ERT, just a few experiments with exploration lines up to approximately 20 km are documented. Storz et al. (2000) imaged geological units and fault zones at the German continental deep-drilling site KTB (Kontinentale Tiefbohrung) on a profile up to 20 km. Schütze and Flechsig (2002) conducted a 22 km profile across the Long Valley caldera volcano. The results reveal prominent conductivity structures interpreted as faults with circulating hot fluids and the present-day flow regime of hydrothermal fluids (Pribnow et al., 2003). Günther et al. (2011) described how a fault zone can be imaged with large-scale ERT and additional structural information from seismic images along a 2.5 km long profile. Bergmann et al. (2017) used a surface-downhole ERT survey line (approximately 4–5 km) for monitoring the progress of carbon dioxide sequestration at Ketzin, Germany. Ronczka et al. (2015) used iron boreholes as long electrodes to investigate inland saltwater intrusion into a 4×4 km wide area. Flechsig et al. (2010) conducted a feasibility survey in a 20×20 km area inside the Eger Rift zone as a first test for this method's suitability in this particular area with industrial noise. A coarse block model was derived from the sparsely distributed current and voltage dipoles and the incorporation of known geological and structural information, such as faults and lithological units. It could be demonstrated that even under noisy conditions, artificial signals can be measured over distances of more than 10 km with sufficient quality despite the electrical noise sources in the Eger Rift, such as power lines, power plants, and machines used in lignite mining.
Our study specifically focuses on the main fluid escapement center – the Hartoušov mofette field. This particular site is characterized by sediment coverage of ≈85 m, shows a high and widely distributed CO2 flux (Kämpf et al., 2013; Nickschick et al., 2015), has a phyllitic basement, and is situated at a known N–S-striking fault zone (Počatky–Plesná fault zone – PPZ; after Bankwitz et al., 2003b). The SW–NE-trending ERT profile presented here, measured in June 2017, features a total length of about 6.5 km and crossed the proposed ICDP drill site and the surface traces of the PPZ. Additional results from several ERT profiles with lengths of 100–750 m and an investigation depth of about 80 m are available and had been partly conducted before and during the survey campaign (Flechsig et al., 2010; Nickschick et al., 2015).
The key aspects of the geoelectrical research and expected contributions to answering the following scientific questions are listed here.
-
We aim to image the electrical resistivity distribution and characteristics in a near-surface scale of approximately 1000 m, including the interpretation of the structural patterns: which characteristic geological and structural settings and geometries of the resistivity distribution in the subsurface of the target areas with a resolution less than 50 m are evident? What is the lateral and spatial extension of the fault zone derived from the resistivity distribution?
-
We aim to image the possible fluid pathways and the feeding system of the degassing area: which structures are linked to the migration of CO2? Do we recognize potential structures acting as a fluid trap?
-
We aim to identify characteristic tectonic structures caused by the ongoing geodynamic processes. Is it possible to find weakness zones that can act as permeable fluid transport pathways?
-
We aim to establish a reference resistivity subsurface model for possible future long-term monitoring projects.
2.1 Geology and geodynamic activity
The Cenozoic Eger Rift with the central Eger Graben, the NNW–SSE-trending Mariánské Lázně fault zone (MLF), and the Cheb–Domažlice Graben are prominent tectonic structures of the Bohemian Massif, which is the eastern part of the European Cenozoic Rift System (Bankwitz et al., 2003b; Malkovský, 1987; Ziegler, 1992; Peterek et al., 2011). The Eger Rift contains several basins (e.g., Cheb Basin, Sokolov Basin, Most Basin) with similar sedimentary and tectonic evolution (Pešek et al., 2014). The investigation area, the geodynamically active Cheb Basin, a shallow Neogene intra-continental basin with a maximal depth of approximately 350 m, was formed at the intersection of the NE–SW-striking Eger Graben and the NNW-striking Cheb–Domažlice Graben (Špičáková et al., 2000; Peterek et al., 2011). The Cheb Basin is bounded on its eastern side by the morphologically distinct scarp of the NNW–SSE-trending Mariánské Lázně fault, the down-dipping Smrčiny–Fichtelgebirge Mountains to the west, and the Bohemian Forest to the south (Fig. 1, Peterek et al., 2011; Bussert et al., 2017). At the west and east border of the Cheb Basin, the basement has an offset of more than 200–400 m. To the north and south, the bottom of the basin thins out gradually to the surface (Bankwitz et al., 2003b; Rojik et al., 2014).
Babuška et al. (2007) point out that the Cheb Basin is located above a triple junction of the Variscan crustal units of the Saxothuringian in the northwest, the Teplá–Barrandian in the central region, and the Moldanubian in the southeast. The basin is embedded into Proterozoic and Paleozoic magmatic and metamorphic rocks of the northwestern Bohemian Massif – predominantly granites, gneisses, mica schists, and phyllites. The sedimentary fill of the Cheb Basin around the area of interest itself consists mainly of less than 300 m of continental clastics (representing debris of these rocks; Bussert et al., 2017; Fig. 1) and overlies the deeply weathered mica schists with interbeds of metaquartzite, metabasite, and crystalline limestone that are intruded by granitoid plutons (Variscan Smrčiny, Fichtel, and Žandov plutons; Pešek et al., 2014). Several uplift and subsidence events due to varying extensional and compactional stress within the Eger Rift since the Eocene affected the sedimentation within the basin (Peterek et al., 2011; Pešek et al., 2014; Rojik et al., 2014; Bussert et al., 2017). After the local deposition of clays and sands in the Eocene (Staré Sedlo formation), sedimentation continued with the deposition of Oligocene to Miocene gravel, sand, and clays (called the Lower Argillaceous–Sandy formation or the Lower Clay–Sand formation). During the Lower Miocene, wetlands dominated the area and led to the deposition of the coal- and lignite-bearing Main Seam formation. As the result of ongoing tectonic activity, a lake developed in which the clay-dominated Cypris formation was deposited. After a hiatus, sedimentation started again in the Pliocene with lacustrine clays, sands, and gravels of the Vildštejn formation and continued without an obvious break into the Quaternary.
Currently, the area around Nový Kostel (Fig. 1) is the most active earthquake swarm zone in western Bohemia–Vogtland (Fischer et al., 2014). The activity at the Nový Kostel focal zone is supposed to be related to the reactivation of a system of faults, e.g., at the intersection between the NNW–SSE-trending MLF and the N–S-trending PPZ. The earthquake foci are located at depths between 6 and 13 km and clustered along vertical faults, forming an almost continuous, about 15 km long belt striking NNW to SSE and steeply dipping westwards (Fischer and Michálek, 2008; Fischer et al., 2014). Normal and strike-slip faulting are the typical focal mechanisms for these intra-plate events here. Most of the micro-earthquake hypocenters are aligned in a N–S direction and thus follow the course of the PPZ, whereas the NNW–SSE-striking MLF seems to be only partially seismically active (Bankwitz et al., 2003b; Fischer et al., 2014). The PPZ forms an escarpment of more than 20 m height in Pliocene–Pleistocene sediments and has probably been active since the late Pleistocene (Bankwitz et al., 2003b; Peterek et al., 2011; Bussert et al., 2017). Strike-slip faults with a vertical component run across the basin in an E–W direction (e.g., Nová Ves fault) according to Bankwitz et al. (2003a). The combination of seismological and especially hydrological analyses points out that the Nový Kostel zone is also part of the gas uplift system and must be linked to the near-surface water flux. The model, which Neunhöfer and Hemmann (2005) proposed, provides an explanation for the active ascent of fluids in relation to the phenomenon of earthquake swarms. The model takes a special two-phase system formed by water and CO2, in contrast to other mixed models (Bräuer et al., 2008, 2009), into account. Furthermore, Horálek and Fischer (2008) assumed that ascending crustal fluids could play a key role in the alteration of the preexisting, favorably oriented faults from a subcritical to critical state due to pore pressure increase. Although ascending fluids from deep crustal root zones are considered to be the main factors inducing recurring earthquake swarms by pore pressure increase (Špičak and Hóralek, 2001; Weinlich et al., 1998; Heinicke and Koch, 2000; Weise et al., 2001; Bräuer et al., 2005, 2009; Kämpf et al., 2013; Fischer et al., 2014), the relation between earthquake swarms and the source of CO2, CO2 ascent, and degassing is still a matter of discussion (Babuška et al., 2016).
One of the main fluid discharge centers for carbon dioxide via mofettes at the surface is located approx. 10 km south of Nový Kostel along the course of the PPZ (Bublák and Hartoušov mofette fields). Only isolated CO2 vents and mineral springs are found close to the MLF (e.g., Dolni Častkov mofette). The numerous cold CO2 emanations with >99 % vol CO2 and a mantle signature (He and N isotopes) are supposed to be generally connected to the seismic activity and to stem from upper mantle reservoirs (Weinlich et al., 1998; Geissler et al., 2005; Bräuer et al., 2009, 2011). From the high gas flux rates and high 3He∕4He ratios, the mofette field Bublák–Hartoušov appears to act as deep-seated fluid migration zone along the PPZ (Bräuer et al., 2011; Kämpf et al., 2013). The tectonic setting of the area has a great influence on the increased degassing of CO2 at the surface. Since the early work of Irwin and Barnes (1980), it has become evident that a close relationship exists between the tectonic activity and anomalous crustal emissions of CO2. Due to their hydraulic permeability, faults can act as preferential pathways for the upward migration and release of deep fluids to the atmosphere in this area (Bankwitz et al., 2003a; Geissler et al., 2005). At the surface, CO2 emission occurs often at gas vents with diameters <1 m (Kämpf et al., 2013; Nickschick et al., 2017), with high flux rates and in moderate amounts diffusely over the larger area in general (Kämpf et al., 2013; Nickschick et al., 2015, 2017, see also Sect. 2.2). However, the deep structure, geometry, and lateral extension due to the depth of the fluid pathways in the crust layers are still unknown. Despite the geodynamic–geophysical and especially seismological research (Švancara et al., 2000; Růžek and Horálek, 2013; Fischer et al., 2014) in this area, many questions about the settings for the fluid regime and the generation of the earthquake swarms remain unanswered. Besides the local and regional stresses, as well as contrasts in rheological rock properties, the fluid movement and distribution are essential factors influencing the seismicity of the region. One peculiar phenomenon is the spatial separation of the earthquakes near Nový Kostel and the CO2 degassing near Hartoušov, despite having a similar source behind them. However, in May 2018, a cluster of several (>70) small-magnitude earthquakes was registered (Czech PEPIN seismological catalog; http://www.ig.cas.cz, last access: 7 November 2019) a few hundreds of meters to the NE of the mofette field Hartoušov.
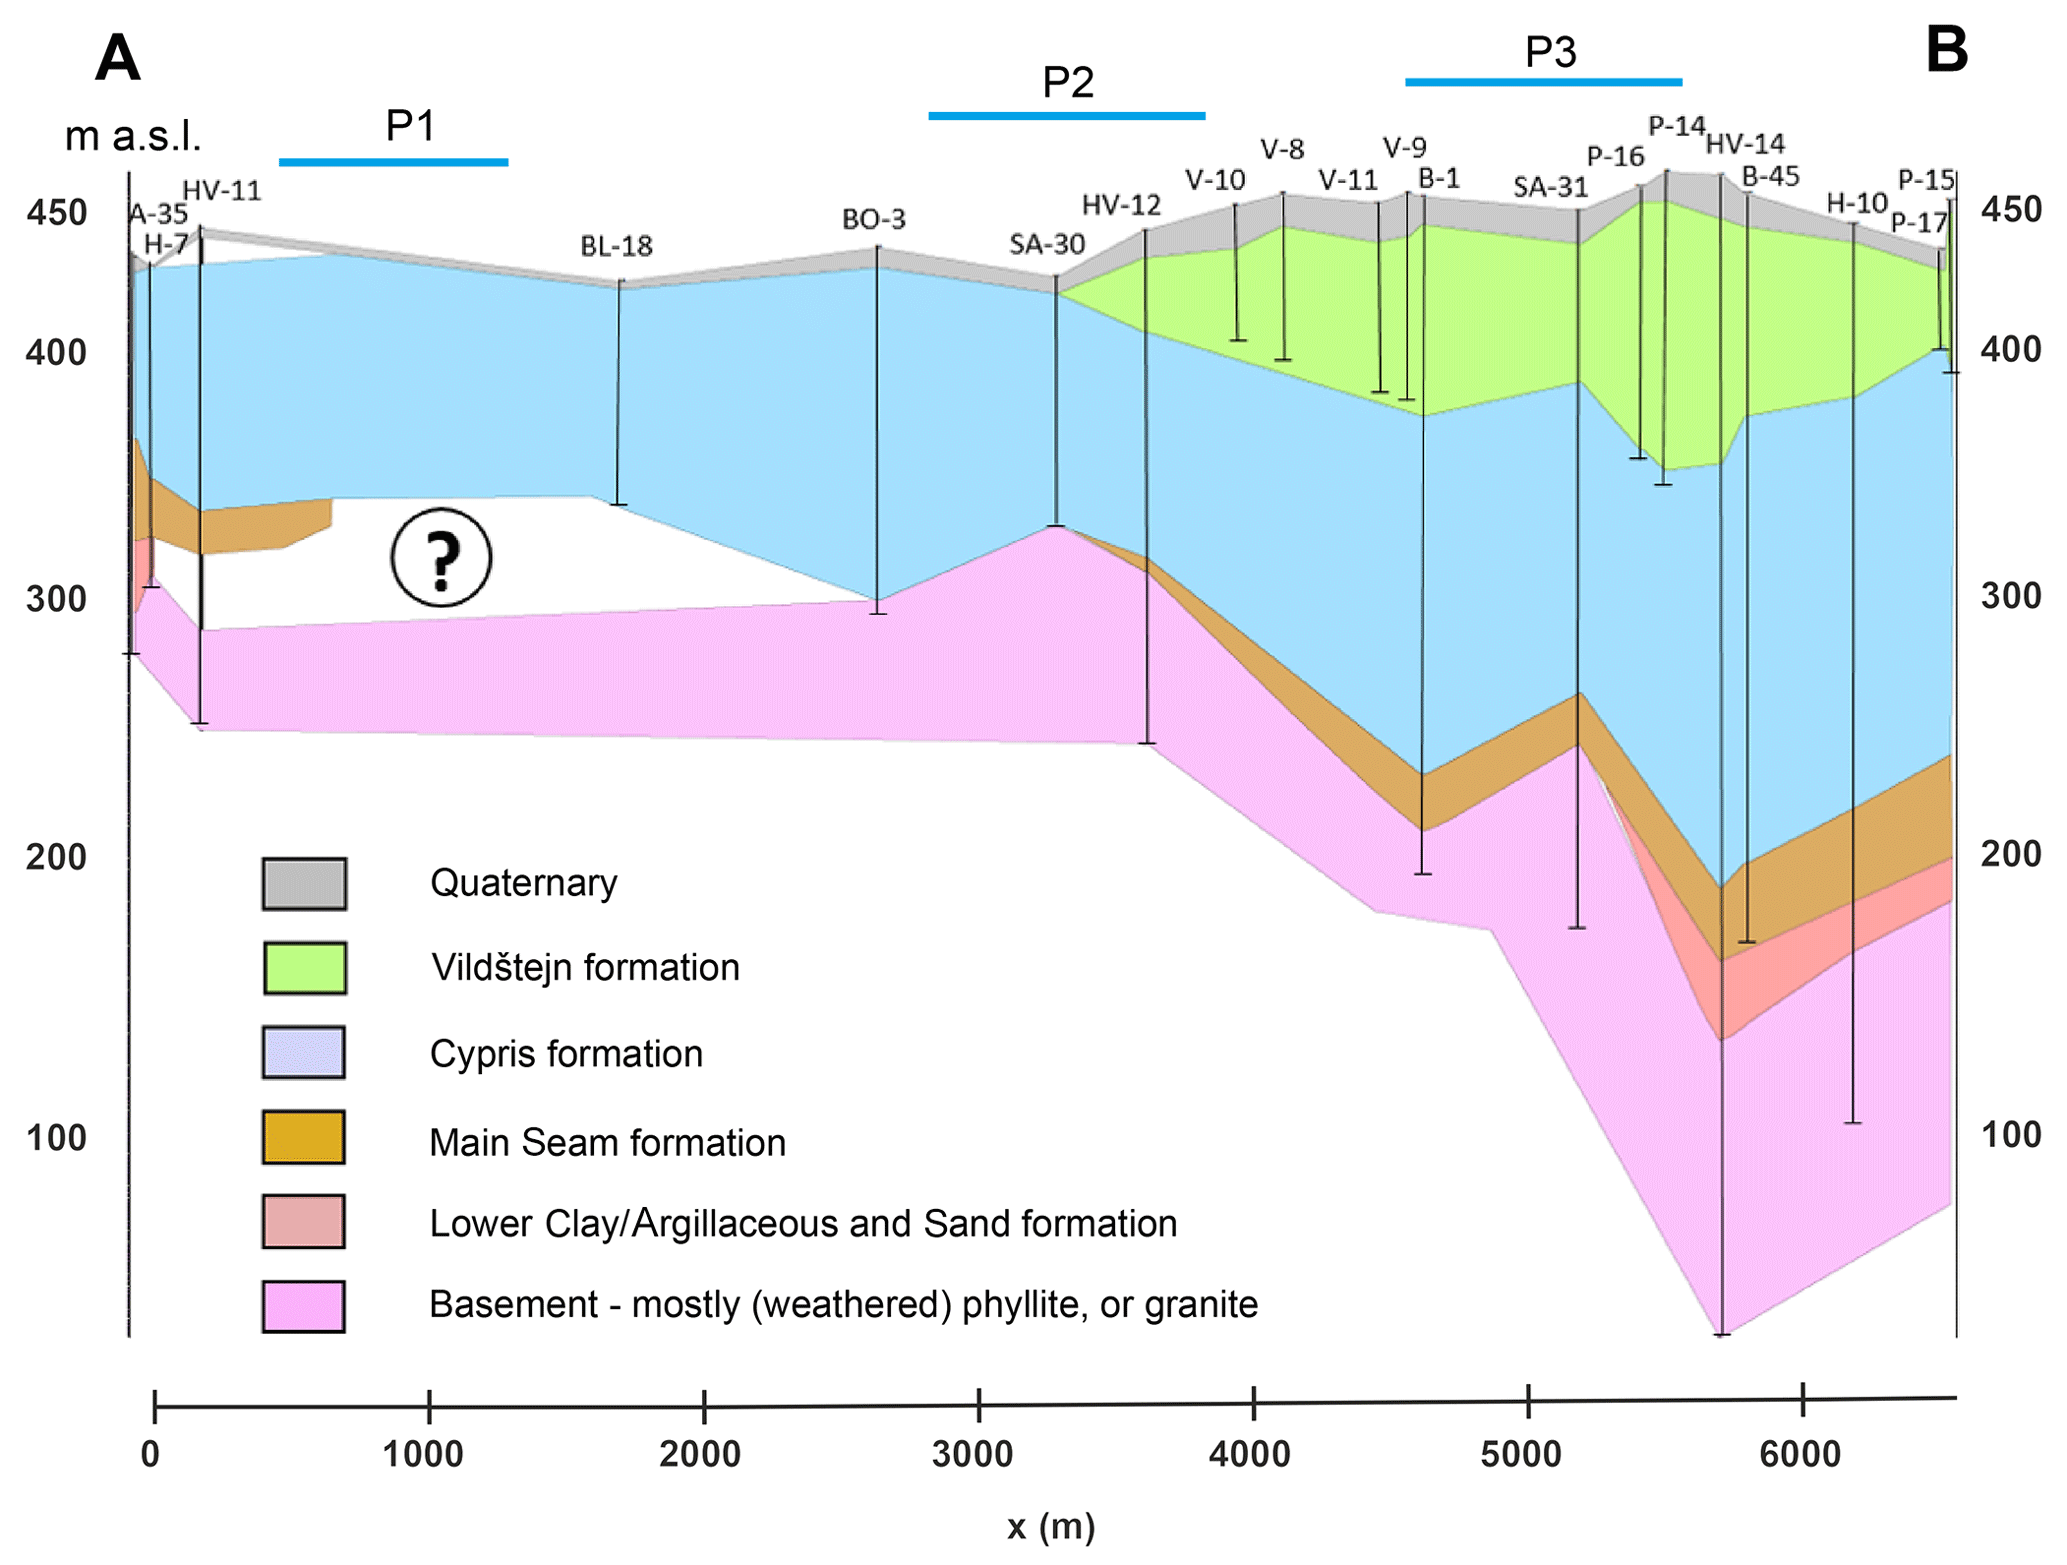
Figure 2Lithological transect along the large-scale profile based on the descriptions of boreholes from the Czech Geological Survey (formerly GEOFOND). The question mark indicates an area of unknown lithology and the uncertainty of whether Main Seam and Lower Clay (or Argillaceous) and/or Sandy formations are present in this area. P1–P3 mark the locations of the small-scale ERT profiles. For each drill's location, please refer to Fig. 1.
2.2 Existing geophysical results and lithological data
From previous geoelectrical investigations, results from several 2-D ERT profiles with lengths of 100–750 m and an investigation depth of approx. 80–100 m across the main faults of the Cheb Basin (MLF and PPZ; Fig. 1) are available (Flechsig et al., 2008, 2010; Fischer et al., 2014; Nickschick et al., 2015, 2017; Blecha et al., 2018). The obtained resistivity models reveal the characteristics and width of the fault zones in the shallow subsurface by means of resistivity anomalies, variations in sediment thickness, and vertical layer displacement. Significant resistivity anomalies in the subsurface reveal the location of both the MLF and PPZ, and typical conductive features indicate potential fluid transport paths and regions with mineral alteration. Essentially, both fault zones are characterized by an extended subsurface region (100–250 m) controlled by multiple, more or less parallel sub-faults with different strike angles. As a local comparative geoelectric (3-D small-scale ERT), soil gas, and sediment study of a CO2 degassing vent in the Hartoušov mofette field, near-surface structures to a depth of 20 m were investigated by Flechsig et al. (2008). The investigations reveal substantial structural features that are to be directly or indirectly related to high CO2 flow (anomalies of electrical resistivity, self-potential, and sediment properties). With the aim of reaching deeper structures up to 5 km, several magnetotelluric investigations in the western margin of the Bohemian Massif and along the 9HR seismic profile (Cerv et al., 1997, 2001; Pícha and Hudeková, 1997; Di Mauro et al., 1999) have been carried out since 1990, resulting in very coarse conductivity models.
Recent information about the regional distribution of electrical resistivity up to 25 km of depth came from a 2-D magnetotelluric experiment on a 50 km long N–S profile with 25 stations crossing the Cheb Basin in 2017 (Muñoz et al., 2018). The most prominent deep-reaching structure is a channel of higher conductivity compared to the surroundings, which extends from the surface at the mofette field of Bublák–Hartoušov into the lower crust (approximately 25 km) to the north, possibly correlated with the hypocenters of the seismic events of the Nový Kostel focal zone. This channel has been interpreted by other authors as a pathway from a mid-crustal fluid reservoir to the surface along deep-reaching faults. Whereas the overall resistivity is very high (>500–1000 Ω m) in parts of the model, very low resistivity (<30 Ω m) could be found near the surface at the mofette fields of Bublák and Hartoušov and their feeding system. Further relevant data and information from other geophysical methods for interpretation of the measured ERT profile are not available or not in the necessary scale.
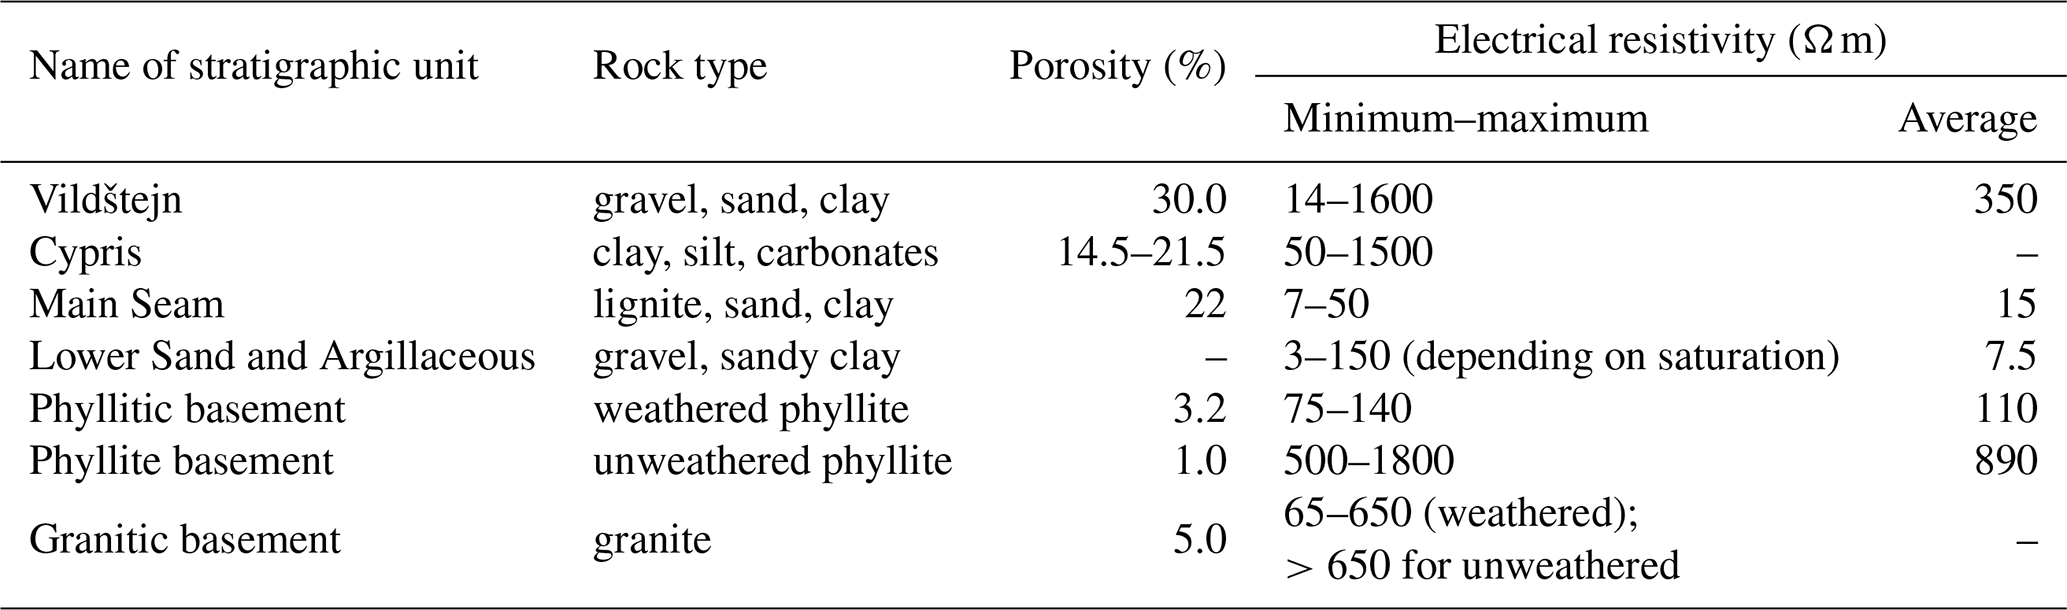
To interpret the subsurface resistivity situation around our survey target, borehole descriptions from the Czech Geological Survey (formerly GEOFOND) were gathered. In order to establish a conception of the encountered lithologic units in this experiment, we generated a 2-D transect based on the borehole data to a depth of 50 to 400 m (Figs. 1 and 2). From the available drills in the investigation area, we selected 20 that provided sufficient depth and were closest to our ERT profile. The GeODin software was used to generate the transect that can be seen in Fig. 2. Please note that none of these drills have reached the crystalline phyllite in its unweathered state and only describe the basement phyllite as weathered or highly weathered. In addition to this geological constraint, we regarded the results from Dobeš et al. (1986): their report contains valuable petrophysical information from previous studies about the different stratigraphic units in and below the Cheb Basin, which we have summarized in Table 1. The phyllitic–granitic basement is characterized by low porosities of less than 5 % compared to the sedimentary deposits on top, which feature porosities of 15 %–30 %. Resistivity, however, may vary drastically, depending on heterogeneities within the sediments and whether fluids such as mineral waters or CO2 are present or not, and the report does not specifically state where the samples were taken from. For this area, Bussert et al. (2017) provide additional information. Not only do they mention the occurrence of highly mineralized water in the central part of the HMF, but their geophysical log of the HJB-1 drill also reveals resistivities of 5–10 Ω m for the Cypris formation and 10–20 Ω m for the topmost part of the weathered phyllites. They are about 1 order of magnitude lower than the values presented in Dobeš et al. (1986) – stressing the importance of regarding the occurrence or absence of fluids even more.
Table 1Petrological description of the stratigraphic layers of sediments in the Cheb Basin and the basement below, translated from Dobeš et al. (1986).
The resistivity of rocks is notably sensitive to the presence of fluids that dominate the conductivity over the rock matrix and weakening effects of the rock matrix due to fluid–rock interactions. Therefore, ERT is qualified for the detection of fluid signatures in the subsurface structures in different scales, like fluid pathways and fluid–rock interaction processes. Modern ERT inversion and modeling techniques (Günther, 2004; Günther et al., 2006) can then been applied to the data to retrieve a detailed conductivity image. In the framework of this experiment, one large-scale profile and several small-scale profiles were carried out in June 2017. The SW–NE-trending 6.5 km profile crossed the proposed ICDP drill site (Dahm et al., 2013; Bussert et al., 2017) at the HMF and the surface traces of the N–S-trending PPZ. Figure 1 shows a location map with existing boreholes and the individual ERT profiles that are subsequently discussed.
3.1 Large-scale ERT survey
The data acquisition was performed using the dipole–dipole configuration (AB MN, with A and B being the current injection electrodes and M and N being the potential electrodes), which is, considering the cost–effect relation for practical and theoretical reasons, most suitable for this large-scale ERT experiment. Transmitter and receiver units are physically separated on two lines reaching maximum dipole separations of 6.5 km (Fig. 1) while keeping the total length of required cables to a minimum as only neighboring electrodes have to be connected. Considering crop growth in June in this rural area and traffic by agricultural farming machines in general, other arrays are not effective with large cable spreads of several kilometers. Furthermore, we expected vertically oriented features (faults, “fluid channels”), as seen in previous studies (Nickschick et al., 2015), supporting the choice of using a dipole–dipole setup and achieving good results in previous studies at different locations with a similar setup (Flechsig et al., 2010; Pribnow et al., 2003; Schmidt-Hattenberger et al., 2013).
The experiment setup included 59 transmitter and voltage dipole locations by using 150 m dipole lengths in the outer (10 dipoles in the western and 11 in the eastern part of the profile) and 100 m length in the central part. While the receivers are stationary at fixed places during the campaign, the transmitter with the source dipole is moved to the feeding positions. Since the profile crosses streets and rural roads, small gaps needed to be left for current injections and voltage registrations, leading to a total number of 54 voltage reading positions and 47 current injections. To determine the horizontal position, we used a handheld GPS (Garmin GPS map 62s) with an accuracy of about 3 m. Elevations were then taken from a high-resolution digital elevation model. Two high-power transmitters (10 kW SCINTREX TSQ-4 and a self-developed 40 kW power transmitter) were used to inject a square-wave signal with an 8 s signal period and 50 % duty cycle (2 s positive, 2 s off, 2 s negative, 2 s off) using at least six cross-shaped, stainless-steel metal rods (1.5 m long) for grounding. For a total length of 20 min, current was injected. For 15 min of each 20 min injection period (112 total periods), we injected with the highest current possible, resulting in clear signals even at distances of several kilometers, and 5 min (37 total periods) with reduced power in case of overloads at nearby data loggers. The maximum injection current into the ground was 22.4 A with an average of 10.2 A for all injections. As voltage electrodes, non-polarizable electrodes (Ag–AgCl and Cu–CuSO4) were used to avoid polarization effects over the current injection time. To register voltages, two data recorder types were used (24 RefTek Texan-125A single-channel recorder and 10 self-developed remote-controlled three-channel data loggers; Oppermann and Günther, 2018). A continuous registration of the full time series with a 100 Hz sampling rate for the single-channel recorder and 200 Hz sampling rate for the three-channel data logger was carried out during the survey to account for possible high-frequency noise signals. The field experiment is followed by comprehensive data preprocessing, including data storage, compilation of the raw data in a database system, raw data quality analysis, and raw data processing.
3.2 Small-scale ERT survey
In preparation for the large-scale experiment, several near-surface surveys using a commercial GeoTom multi-electrode device were carried out in proximity to the large profile. Due to the specific setup of the large-scale experiment and the limited resolution within the first tens of meters, additional surveys with small electrode spacings provide useful information about the near-surface resistivity. A total of 100 steel electrodes with a spacing of 5 m were used in these surveys, resulting in a total length of 495 m for a single profile. The setup is similar to the ERT profiles shown by Nickschick et al. (2015) and Nickschick et al. (2017) for comparison purposes. Thus, we also measured in Wenner alpha and Wenner beta configuration due to the good results from these previous studies. Both arrays have been combined and were inverted with the BERT software (see Sect. 3.4) using a vertical-to-horizontal smoothness factor (Coscia et al., 2011) of 0.2, i.e., making vertical gradients 5 times more sensitive than horizontal ones.
3.3 Processing of the large-scale ERT data
Natural and anthropogenic sources and industrial facilities near the profile lead to noise within the acquired voltage time series. To reduce noise and eliminate unwanted signals, data processing is required. This issue was addressed by a signal enhancement procedure with a selective stacking approach from Friedel (2000). The approach aims at stacking the acquired voltage time series U(t) (Fig. 3a) into separate cycles.
The first step in the processing procedure is a drift correction to remove the DC voltage parts and long-periodic drift components (Fig. 3b). This is realized by applying a filter function, yielding the drift-corrected function Udr(t) that subtracts the moving mean value of the time series U(t) with a window size of the injection signal period M from the original time series U(t), as suggested by Friedel (2000):
This provides correct results in the case of a symmetric signal with an identical positive and negative amplitude, which is given in this case by controlling the source and assuming that the signal is not distorted by having a very high signal-to-noise ratio. The next step is to reduce short-term noise. In this case, this is done by stacking the events using the α-trimmed mean stack (Naess and Bruland, 1979; Friedel, 2000; Oppermann and Günther, 2018), in which every sample within the stacked signal period is sorted by amplitude, and the smallest and largest amplitudes that exceed a portion of α are rejected. Here, we used a rejection rate of α=10 %, resulting in a mean that is less susceptible to outliers by removing the most deviating 10 % of the samples. To determine the phase shifts between the injection signal and registered signal, a cross-correlation between the stacked signal and an ideal waveform needs to be found. This is done by stacking at an arbitrary point and determining the phase of maximum cross-correlation. As a final step, the response time of the current switching (transients) before reaching the plateau has be considered. A window is selected that ignores a fixed number of samples (typically 10 %) before and after the current switch. In the end, we get a stacked signal as seen in Fig. 3d. The voltage U is the half-difference between the positive (Up) and negative (Un) plateau voltages,
This has to be done for each of the 54 receiver dipoles at the 47 current injections, leading to a theoretical number of 2538 current–voltage pairs for this setup. However, this is reduced to a number of 2397 because voltage is not measured at the current electrodes.
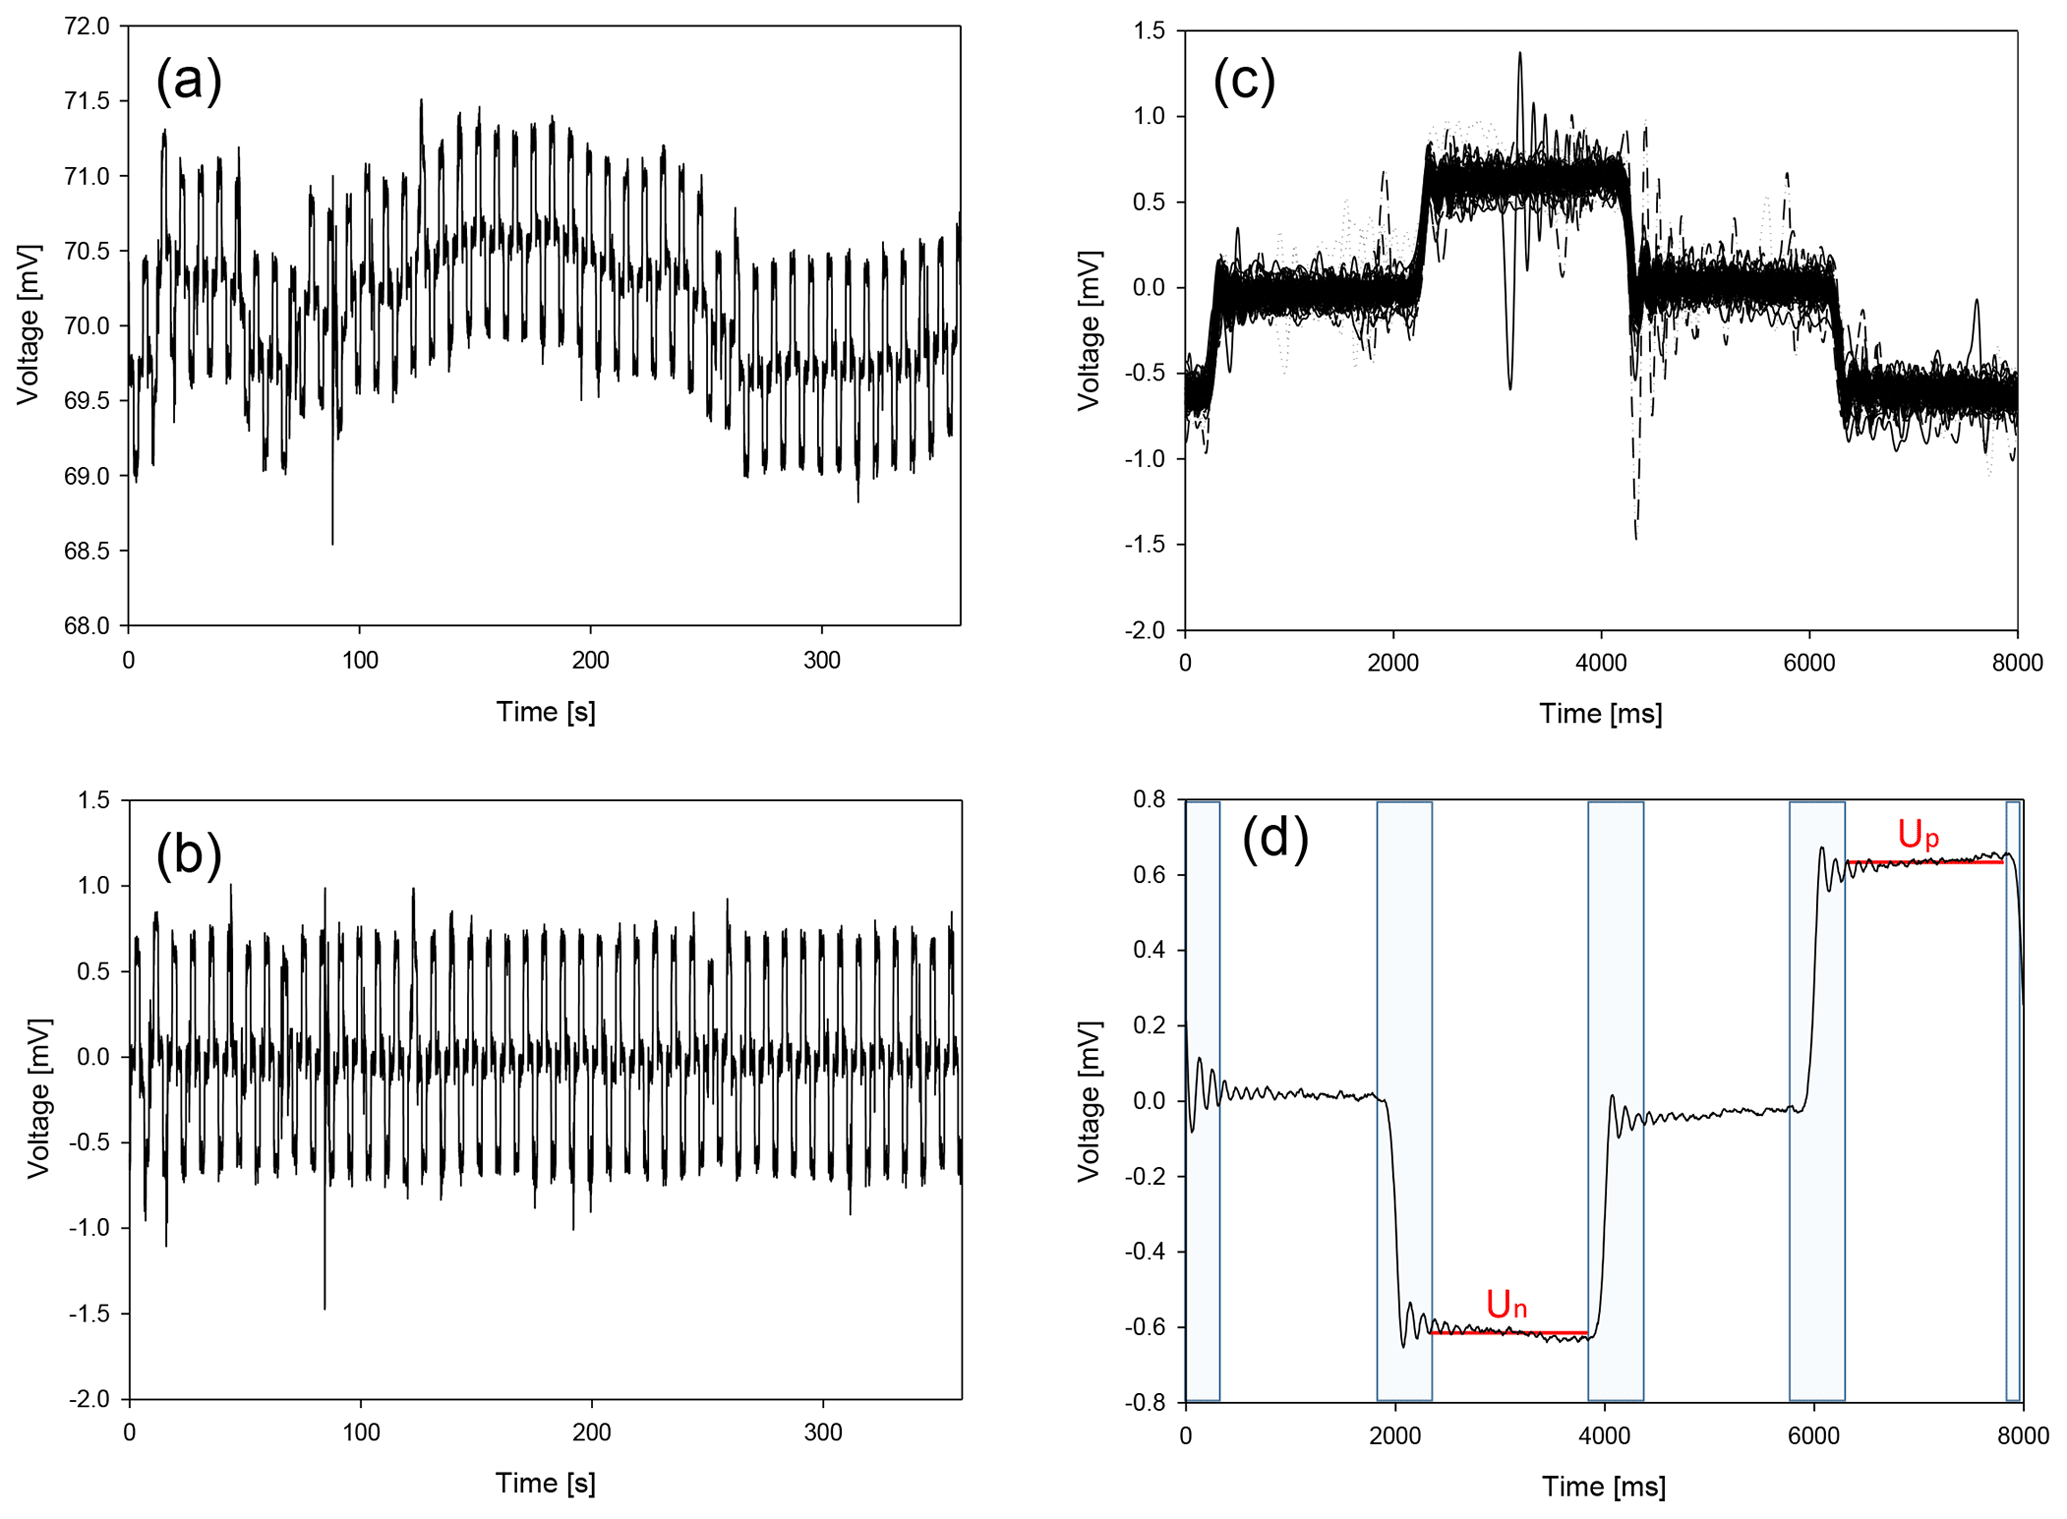
Figure 3Processing steps of time series as an example. (a) Raw time series U(t), (b) time series Udr(t) after drift correction, (c) stack distribution after cross-correlation, and (d) mean stacked signal with rejection windows to delete current switch effects (greyish areas) with positive (Up) and negative (Un) mean plateaus.
In theory, every combination of current and voltage dipole is measured twice by taking into account the principle of reciprocity, which states that voltage and current can be interchanged. By comparing the apparent resistivity for forward values (AB dipole ahead of MN), , with the backward (AB behind MN) values, , one can compute the relative reciprocity error as
for each reciprocal pair. This value should be zero, but in practice it is not due to (i) different coupling of current injection fields compared to potential electrodes and (ii) individual noise levels at different voltage gains leading to different signal-to-noise levels. Therefore, it can be used as a measure of data consistency and also to derive error models (Udphuay et al., 2011) but only if a statistically large number of data are available.
Figure 4a shows the raw apparent resistivity ρa cross-plot as a function of current and voltage dipoles, which should be theoretically symmetric. White areas are blank due to injections at the respective voltage reading positions (three inner diagonals), dominant noise in the time series, or a missing cable connection. In the few cases in which the voltage was too high (e.g., at neighboring dipoles), the smaller current injection was chosen to fill in the missing data. In all other cases, the injection with higher currents leads to better signal-to-noise ratios.
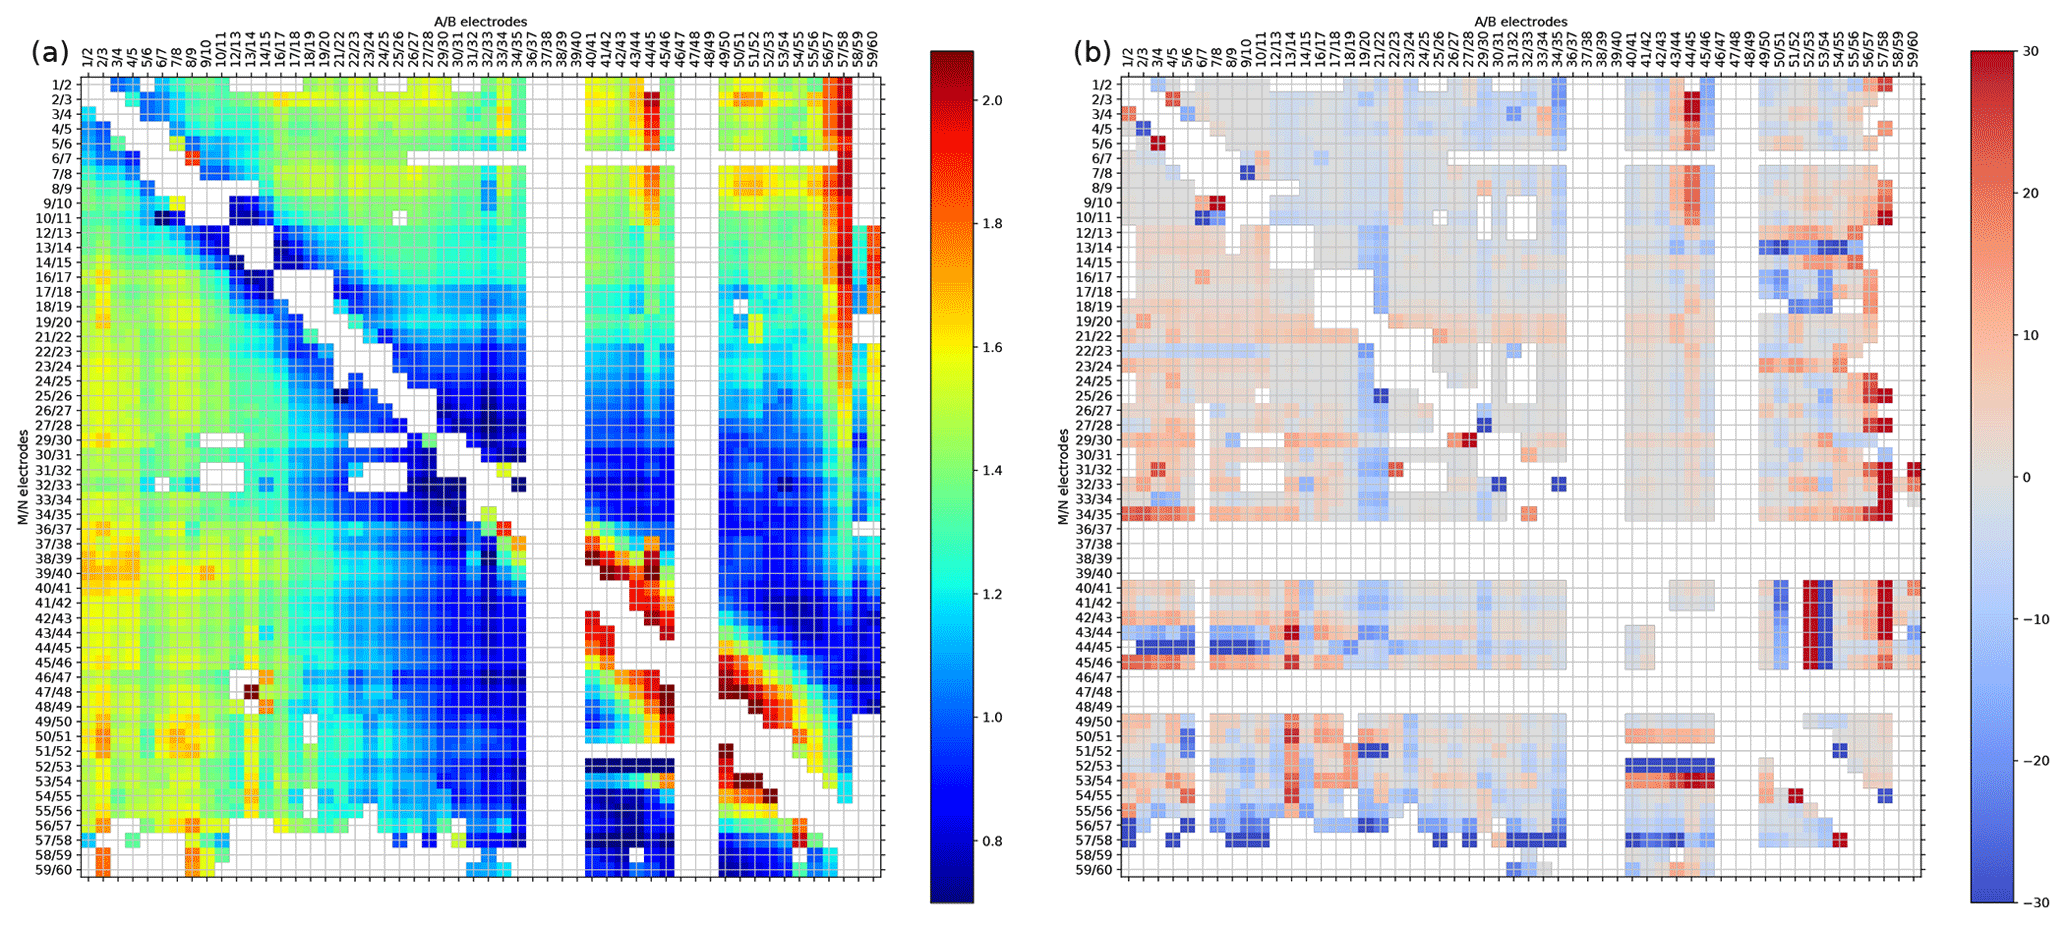
Figure 4Raw data (all retrieved AB–MN pairs) as a function of current AB and potential MN dipoles. (a) Apparent resistivity (log ρa; Ω m) and (b) relative reciprocal error between forward (starting with current dipole 1∕2) and reverse measurements (%).
Many factors interfere with the experiment and the voltage readings, decreasing the amount of reliable data. Strong, irregular signals of 16.7 Hz superimpose the data record of the westernmost logger (1∕2), which can be attributed to rail traffic 800 m south of the western part (Fig. 1) of the profile, leading to a high artificial signal input in general. The easternmost voltage readings (58∕59 and 59∕60) are often overlain by anthropogenic signals from the village of Kaceřov. Furthermore, the current injections show a highly disturbed injection signal, which we attribute to a buried gas pipeline, as indicated by their appropriate sign in the vicinity. Therefore these data had to be removed. Some of the planned injection dipoles (35∕36 to 38∕39 and 47∕48 to 48∕49) could not be accessed with the trailer-mounted current source due to roadside ditches and high crop growth at that time. Fortunately, the missing data (white columns) are mainly available through their reciprocals.
The reciprocal error is displayed in Fig. 4b. A large portion of the area appears grey; i.e., forward and backward data agree very well. For some data with short spacing (near the diagonal) the values deviate from zero due to different coupling. In general, reciprocal errors increase with increasing dipole separation and reflect the decreasing signal-to-noise ratio as a result of the strongly decaying signal strength.
In order to appraise the quality of the partially redundant sub-datasets, we used both data types in preliminary inversion runs with default parameters. It turns out that the root mean square (RMS) misfit of the upper right triangle was explicitly lower (11 %) compared to the lower left triangle (27 %), which shows more systematic structures in the misfit plot. Therefore, we decided to fill in missing data in the former with the latter. The further workflow has the aim of generating a homogenized pseudo-section. It consists of the following steps (see Oppermann and Günther, 2018):
-
removing bad data (single outliers visible as points or point groups such as the aforementioned AB pair 44∕45);
-
filling the missing values in the upper right triangle with the corresponding data in the lower left triangle;
-
computing the data reciprocity for the doubled data from the resistivity; and
-
replacing the corresponding resistances by the current-weighted mean of the two.
As a result, we obtain an apparent resistivity pseudo-section as known from multi-electrode measurements (Fig. 5), i.e., plotting the value as a function of the midpoint position and the separation (dipole distance normalized by dipole length).
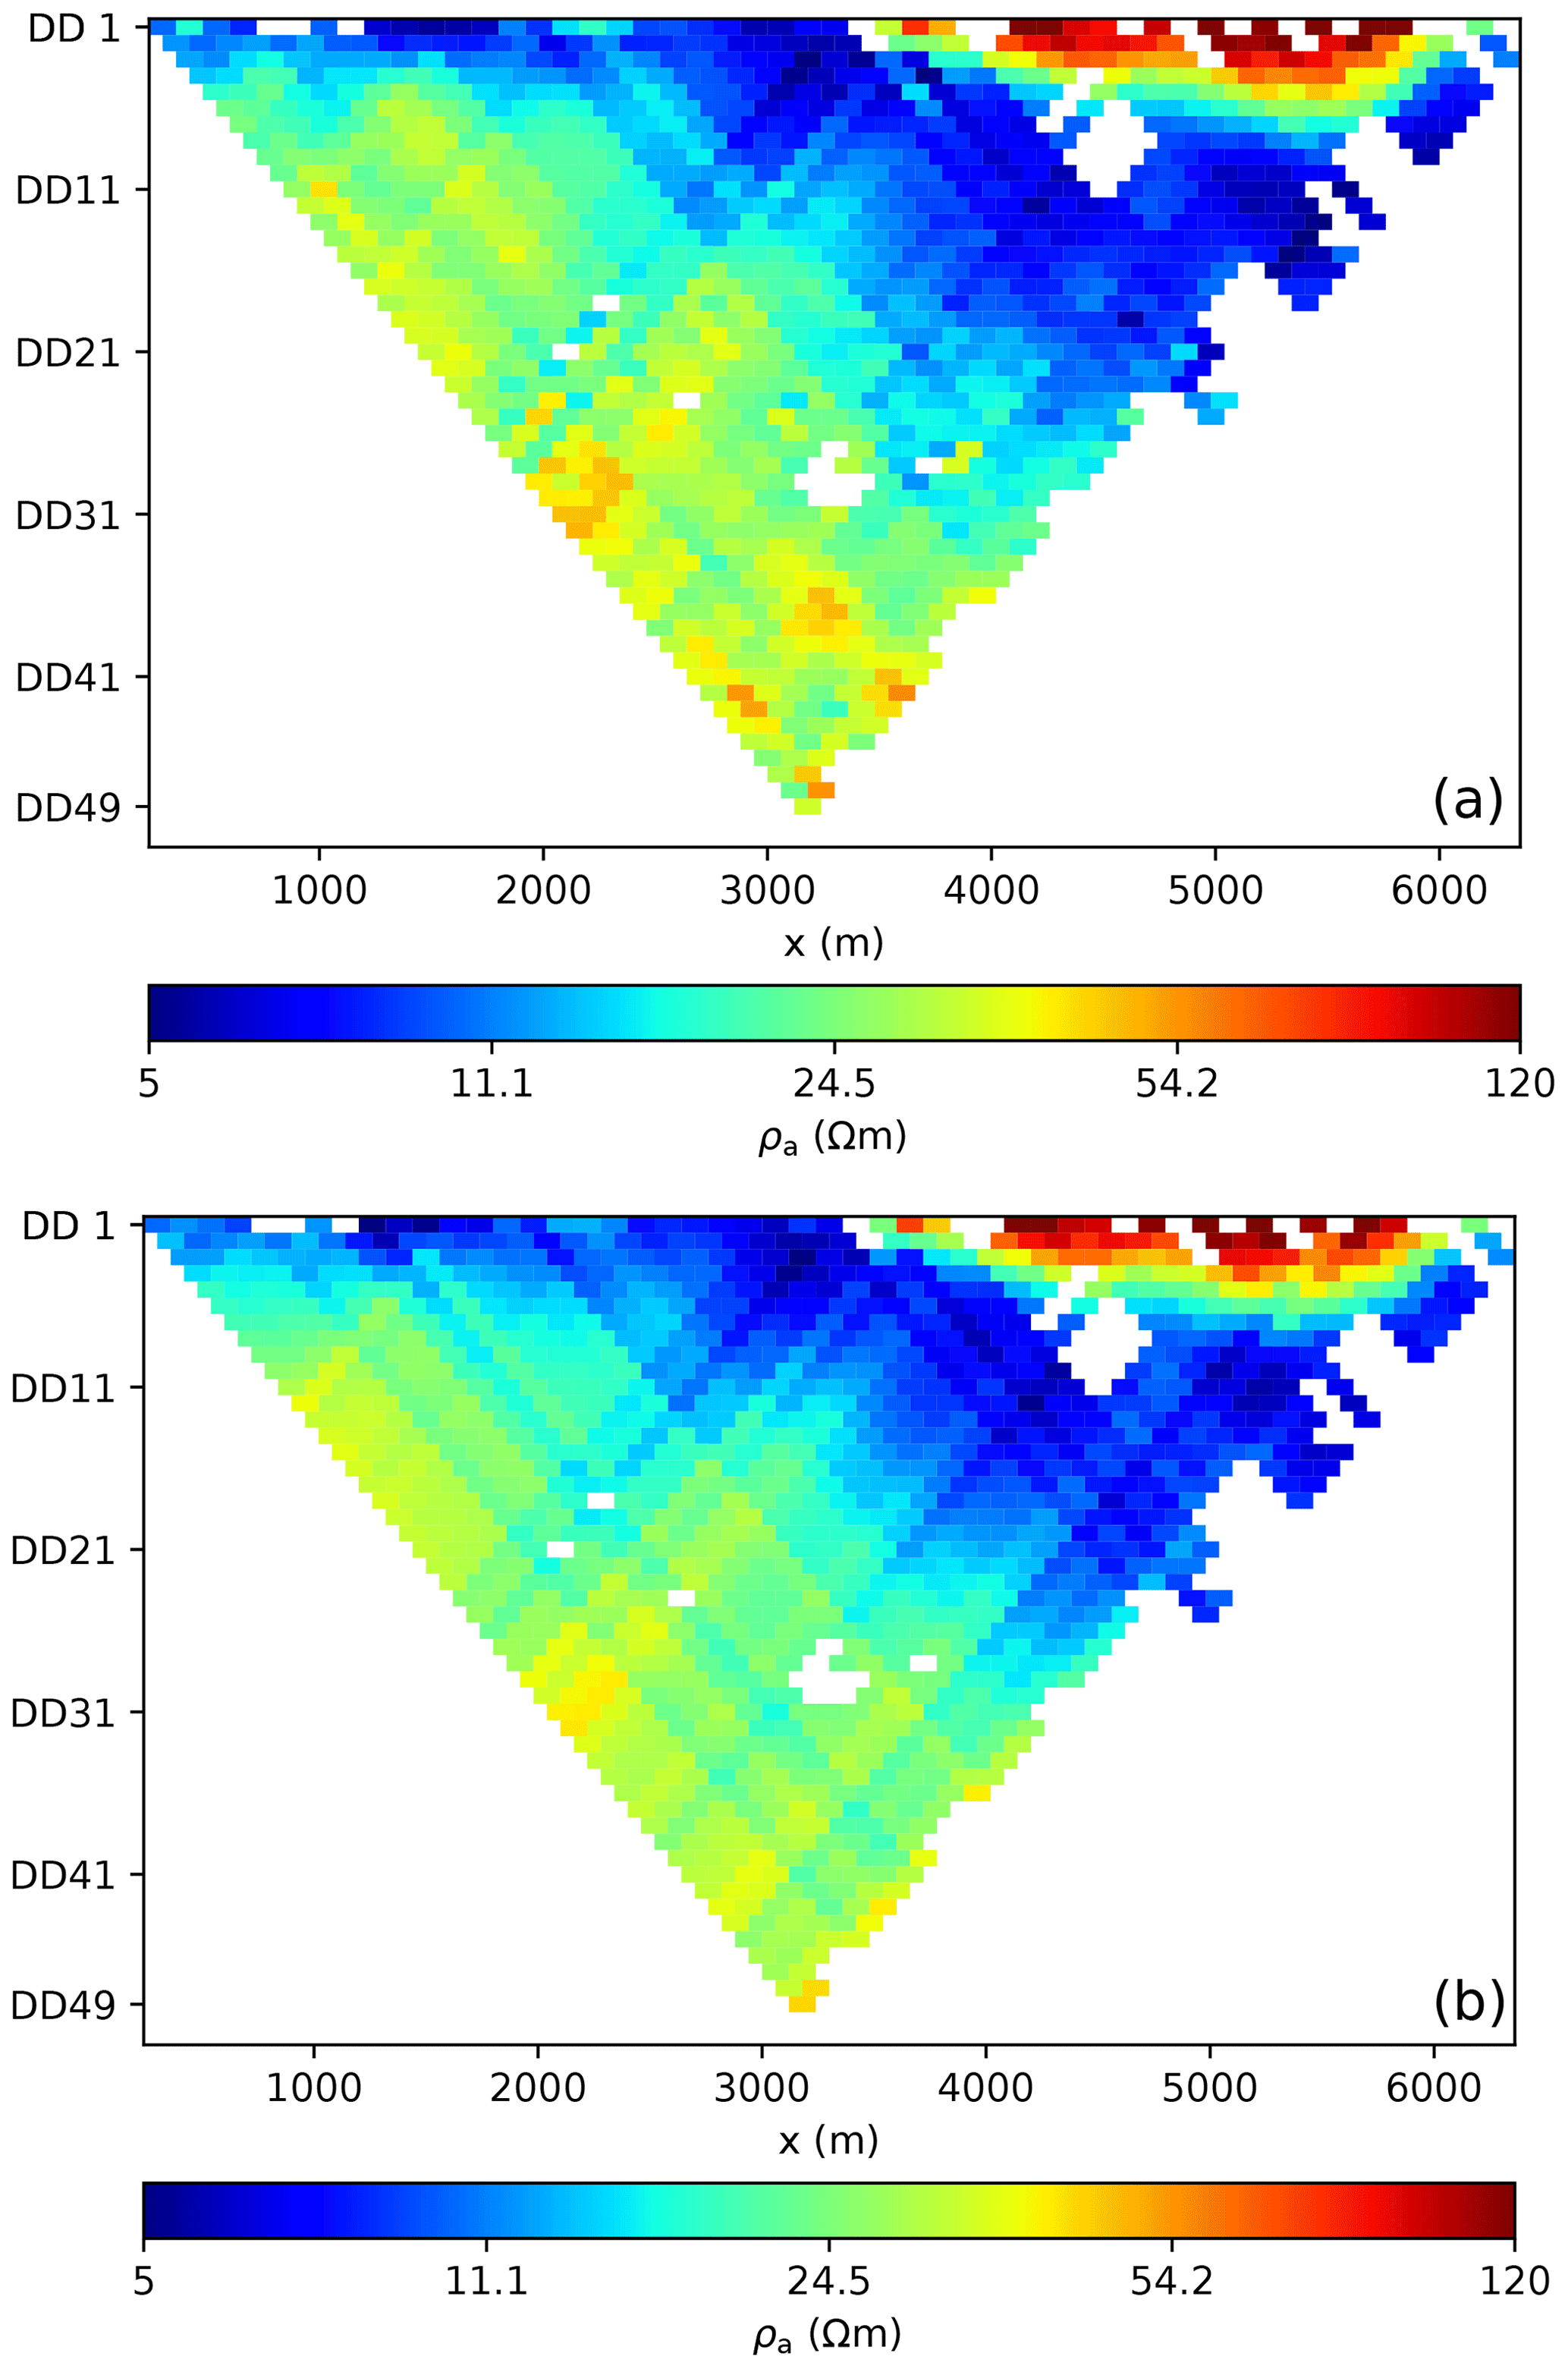
Figure 5Unified dataset as apparent resistivity pseudo-section: measured data (a) and model forward response (b).
For small separations, we observe low values (5–20 Ω m) in the west and higher values (40–200 Ω m) in the east. The apparent resistivity increases with separation, which is more pronounced in the western part. There are still two white stripes for a dipole with a missing registration.
3.4 Modeling and inversion of the resistivity data
The aim of the inverse modeling is to find a subsurface resistivity distribution that is able to reproduce the measured data. We use a smoothness-constrained Gauss–Newton inversion (Günther et al., 2006) implemented in the freely available software BERT (Günther and Rücker, 2019). The whole data processing and visualization uses the pyGIMLi framework (Rücker et al., 2017) in Python. The subsurface is discretized by triangles so that the measured topography can be taken into account accurately. The maximum model depth is determined by 1-D sensitivity analysis with about 130 m for the small profiles and 1300 m for the long one.
In the inversion process, the individual data points are weighted by error estimates consisting of a percentage error and an absolute voltage error so that measurements with lower voltage gain have less importance than those with strong signals. Reciprocal data can be analyzed statistically in order to obtain numbers for this error model (Udphuay et al., 2011). In our case, we determined a percentage error of 5 % and a voltage error of 2 µV, leading to maximum error estimates of 20 % for the large-scale ERT weakest signal at maximum distance. For the small-scale ERT profiles, no reciprocal data were available so we used the default value of 3 % plus 100 µV.
For the regularization, we used smoothness constraints of 1st order as described by Günther et al. (2006). However, to account for predominantly layered structures (larger correlation length in the x direction compared to the z direction), we applied a vertical smoothness factor (see Coscia et al., 2011) of 0.1; i.e., purely vertical gradients in the model are 10 times less penalized than purely horizontal gradients. The overall regularization parameter (300) was chosen such that the data were fitted within the estimated noise level, i.e., with a chi-square error (root mean square of error-weighted misfit) of about 1. Whereas this corresponds to RMS values of about 5 % for the short profiles, the large profile shows a relative misfit of about 12 %.
The forward response, i.e., the apparent resistivity theoretically measured over the retrieved resistivity subsurface, is displayed in Fig. 5. One can see that the main structures are reproduced by the model but not the detailed outliers due to error weighting, resulting in the overall misfit of 12 %.
3.5 Gravity survey
In conjunction with the resistivity survey, we also measured gravity along the ERT profile in order to have additional geophysical data for interpretation. For this purpose, a LaCoste & Romberg D-188 gravimeter was used for gravity surveys in 2017 along the ERT profile. Its resolution is 0.001 mGal, and we achieved an accuracy of 0.006 mGal. In the central part of the profile, very detailed measurements from the previous investigation of the Hartoušov degassing zone from 2012 on profile 2 from Nickschick et al. (2015) were included. To double-check the accuracy of the new surveys in comparison to the older one, several points from that profile were located and remeasured. The average difference was only 0.008 mGal. The spacing on the profile between each measurement station was 40–60 m, while the spacing in the central zone on this profile is denser (10–40 m). Thus, a total of 170 stations exists along the profile. The gravity measurements were referenced to the Czech national gravity network. All essential corrections were applied (drift, tidal, latitude, free-air, Bouguer, terrain). Coordinates were observed by Trimble R9 real-time kinematic (RTK) technology, and the accuracy of all these measurements was better than 0.03 m in the vertical component. Terrain corrections were calculated from an accurate digital elevation model (DEM) of 1 m resolution to the distance of 250 m, the outer part of the correction to 167 km from the SRTM90 DEM. As the profile was located in the Cheb Basin, the reduction density of 2300 kg m−3 was applied to compute the Bouguer anomalies.
4.1 Small-scale ERT

Figure 6Resistivity distribution of the small-scale ERT profiles: 1 (a), 2 (b), and 3 (c) (z: m a.s.l.; see Figs. 1 and 2 for locations and lithology). Transparency represents the coverage (cumulative sensitivity) and helps avoid the interpretation of uncertain model parts. The relative RMS values are 4.7 %, 17.4 %, and 4.5 %, respectively.
The three short ERT profiles (625–700 m long) provide insight into the uppermost (approximately 100 m) resistivity distribution along the large-scale profile (Fig. 6). We chose an identical color scale for all results that helps comparison with the large-scale profile. We used the coverage (cumulative sensitivity of the final model) for the alpha shading of the inversion results so that poorly covered model regions will not be interpreted. We refer to Ronczka et al. (2017), who substantiate the use of coverage as a simple approximation for the model resolution by using synthetic and field ERT data.
Profile 1 (Fig. 6a; final RMS after three iterations is 4.7 %), located in the western part of the large-scale profile, reveals that the first 5 m of this profile feature resistivities of less than 100 Ω m. This layer is on top of a rather massive and homogeneous compound of conductive rocks that is characterized by resistivities of 15–60 Ω m between 5 and 20 m of depth and an even more conductive (<15 Ω m) zone beneath. This resistivity distribution encountered here fits into the geological description of drilling B-18. The first few meters consist of resistive Quaternary sand and loam compared to the lower resistivity that is the underlying Cypris formation. The drill log describes the area beneath 20 m as water-saturated, so it can be assumed that the first 20 m are not saturated and thus slightly less conductive.
Profile 2 (Fig. 6b; final RMS after nine iterations is 17.4 %), crossing the mofette field Hartoušov, confirms the findings from Nickschick et al. (2015): a resistive (> 150 Ω m) layer of ca. 15 m thickness can be measured on top of the more conductive zone. At approximately 400 m of profile distance, just as the elevation increases towards the east, a significant thickening of the high-resistivity near-surface layer can be observed. The resistivity distribution in the western part of profile 2 fits the description of drilling SA-30 and the new drilling HJB-1 (Bussert et al., 2017): the first 15 m consist of gravel, sand, and peat, resulting in overall higher resistivities compared to the Tertiary sediments below. Discrepancies in the core description between drills SA-30 and HJB-1 reveal that deposits (clay and gravel) from the Vildštejn formation are found in the area. We link the sudden shift in resistivity and elevation from 400 m onward to the increased thickness of the Vildštejn deposits towards the east, as stated by the drill logs. This sudden and sharp lithology shift is linked to the course of the PPZ and vertical offsets of a few tens of meters due to various stages of subsidence and lifting (Bankwitz et al., 2003a; Peterek et al., 2011; Kämpf et al., 2013; Rojik et al., 2014; Nickschick et al., 2015). It is to be noted that the vertical plume-like anomalies could be linked to areas of strong CO2 degassing at the surface as reported in previous studies (Flechsig et al., 2008; Nickschick et al., 2015, 2017).
Profile 3 (Fig. 6c; final RMS after 14 iterations is 4.5 %) reveals a 10–15 m thick layer with resistivities above 300 Ω m on top of a massive compound of rocks with about 150 Ω m, which is significantly higher than in profiles 1 and 2. At about 100 m of depth, resistivity decreases, but this represents the investigation depth limit. Core descriptions from nearby drills, such as B-1 and SA-31, indicate a 10–12 m thick layer of Quaternary deposits as the topmost layer. Clayey and silty–sandy Vildštejn deposits, however, have reached thicknesses of 60–80 m in this area according to the core descriptions, which reflects higher resistivities compared to the very conductive Cypris formation at the bottom.
4.2 Large-scale ERT profile
Figure 7 shows the inversion result of the long profile after four iterations (RMS evolution – 81 %, 29.9 %, 18.5 %, 14.6 %, and 14.5 % as the final RMS). On top, the lithology provided by the neighboring drills is plotted as colored box columns, indicating the limited depth that has been achieved by the drills.
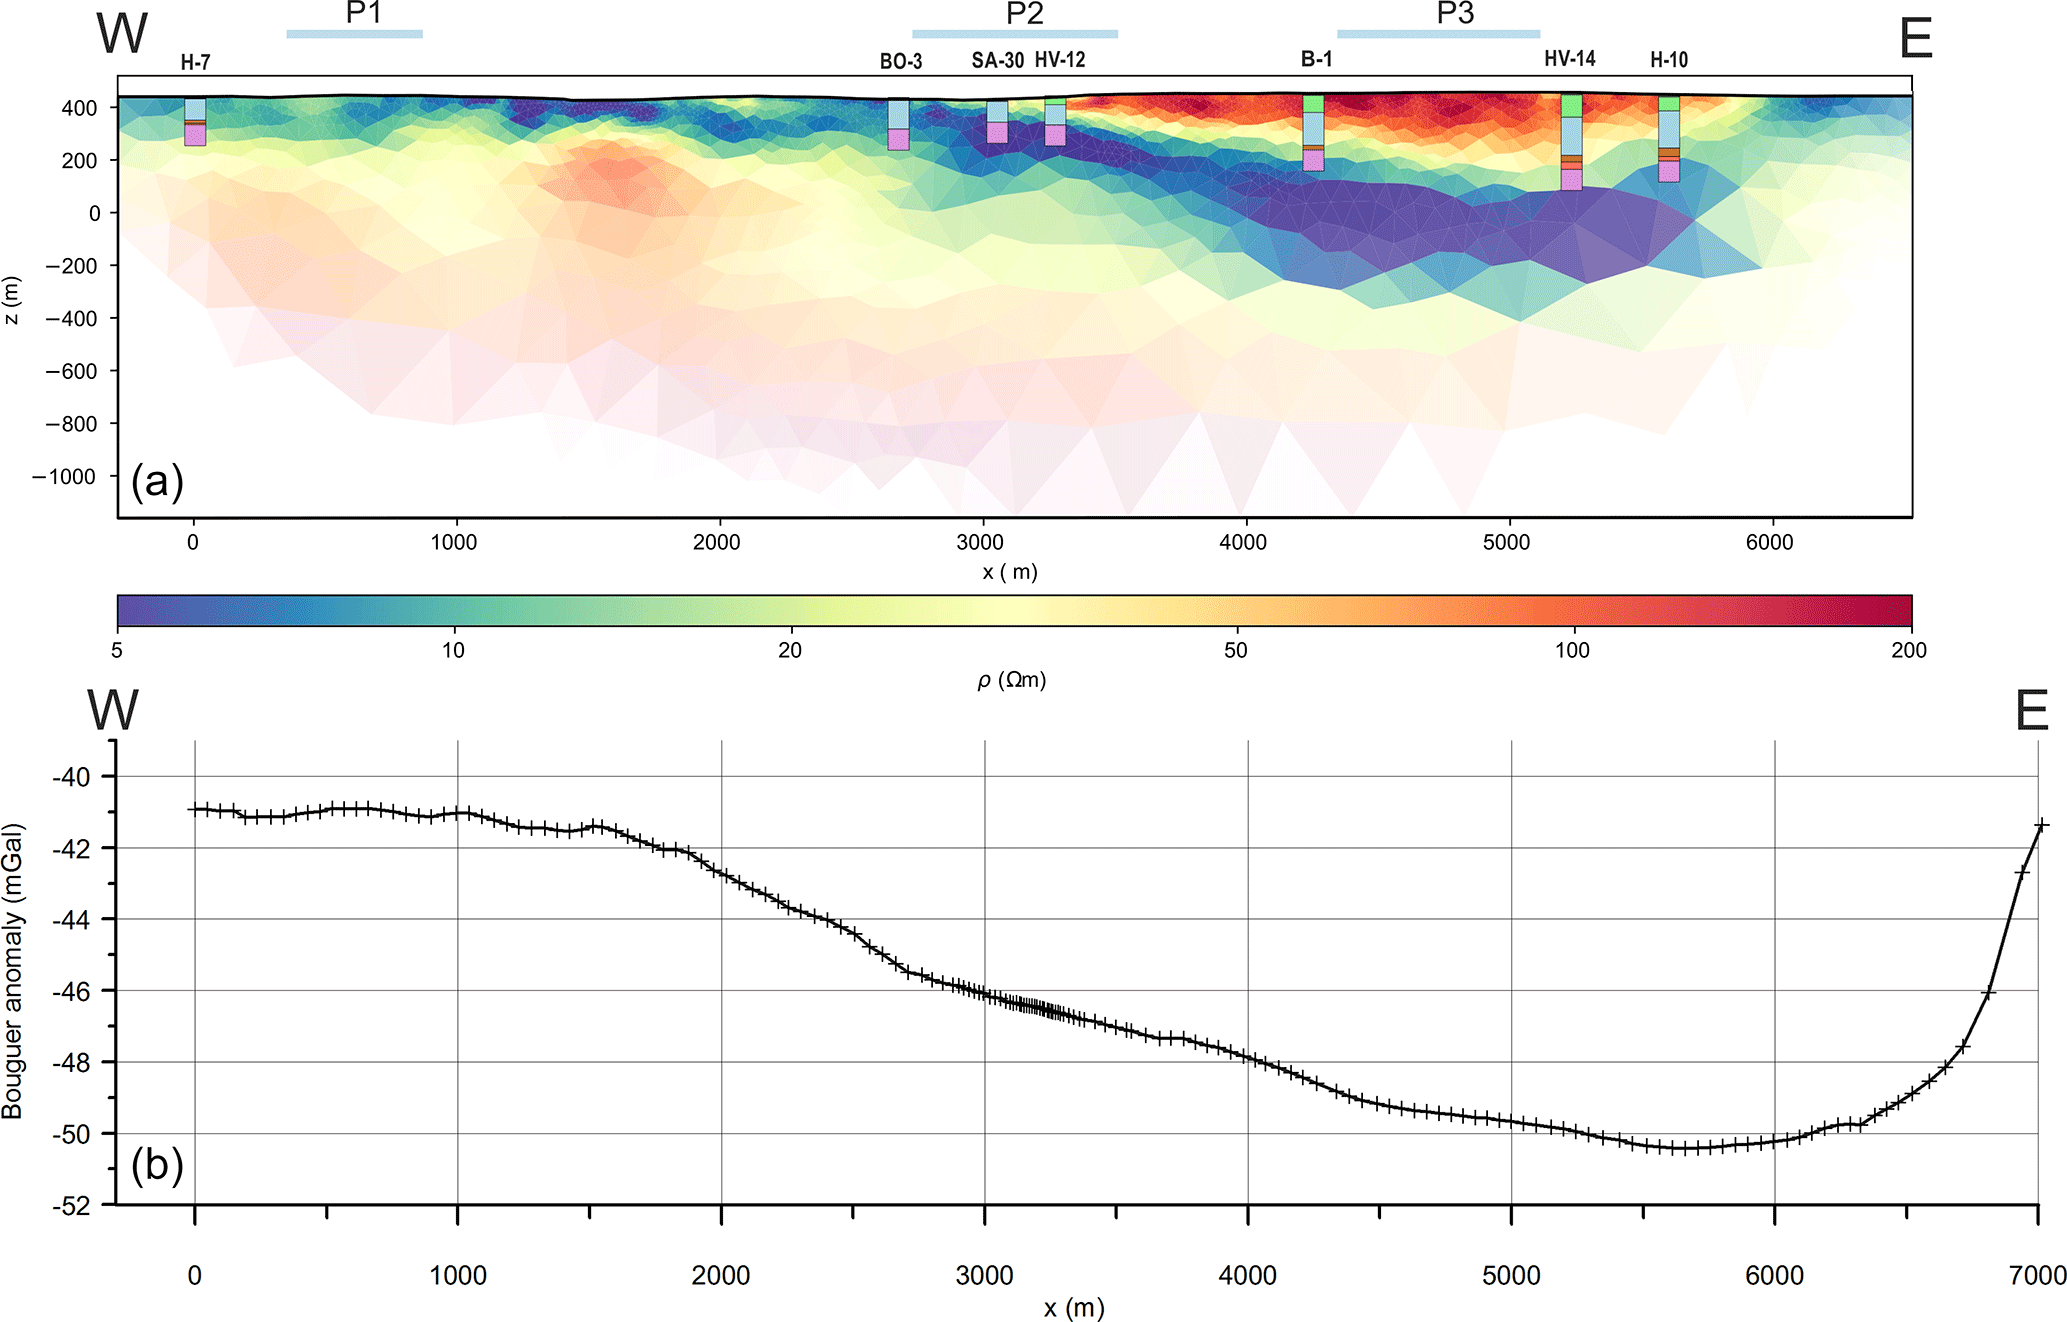
Figure 7Inversion result (resistivity distribution) of the large-scale profile with the lithology columns of the boreholes (a) and the Bouguer gravity (b) (z: m a.s.l). Colors for each stratigraphic unit are identical to Fig. 2: green – Vildštejn formation, light blue – Cypris formation, brown – coal, red – Lower Sand formation, pink – phyllitic–granitic basement. The relative RMS is 14.5 %, and coverage-based alpha shading is used as in Fig. 6.
The 2-D resistivity distribution of the profile shows remarkable differences in the structural composition in the western half of the profile compared to the eastern half. We observe a highly conductive layer of <30 Ω m of about 200 m thickness above a basement of higher resistivity (>100 Ω m) in general. The transition is gradual. At about 2500–3000 m along the profile, these layers dip towards the east and form a trough-like structure before ascending again upwards to the eastern end. This also leads to the occurrence of another layer of >100 Ω m at the surface between 3200 and 5800 m, which reaches a maximum thickness of about 300 m. The lowest resistivities (5 Ω m) are found along 4000–5000 m along the profile at a depth of 300–500 m.
4.3 Gravity
The gravity survey (Fig. 7c) reveals a total maximum relative gravity difference of about 9 mGal along the profile between the local maximum at ≈1500 m and the minimum at 6300 m. It is to be noted that the gravity minimum is measured at the point of highest elevation. The maximum is located where a high-resistivity anomaly is observed in the profile, and the minimum is slightly west of the area where the lowest resistivities were measured. The slight shift between these two observations might be related to the different sensitivity of the electric resistivity and density towards changes in the lithology in north or south of the profile. This gravity trend is enhanced by the W–E-trending contact of phyllitic (on the southern side) and granitic (on the northern side) rocks in the basement, according to Hecht et al. (1997). The central section around the Hartoušov mofette field is located on the crossing of this zone with the Počátky–Plesná fault zone and the gravity gradient delineating the deepest part of the basin. Such tectonic and structural zones form permeable channels for deep fluids and have been mentioned before for this area (Bankwitz et al., 2003b; Kämpf et al., 2013; Bräuer et al., 2008; Fischer et al., 2014, 2017). In Nickschick et al. (2015), we proved that detailed microgravity measurements in the mofette area are capable of locating particular small-scale degassing channels due to decreased bulk density of the rocks, which are in the range of a few tens of microgals and thus not visible on this scale. At the eastern end of the profile, a gravity increase indicates the contact of sediments with outcropping basement of the Krušné hory Mountains.
Using available drill logs from the Czech Geological Survey, we can interpret the upper part of the resistivity distribution as lithologic units: the topmost few meters are generally marked by a high-resistivity layer and relate to Quaternary deposits, mainly gravel and sand, as described in these logs. This layer is, due to its low thickness, only visible in the near-surface ERT results (Fig. 6). We can clearly relate the high-resistivity zone between 3200 and 5800 m to the deposits of the Vildštejn formation with the help of the drill core descriptions. The higher amount of silt and sand results in a higher resistivity compared to the underlying Cypris formation, whose higher portion of clay minerals results in the overall highly conductive layer and provides a rather sharp contrast. The transition to the basement is, however, not well-defined: most of the existing drill core and borehole data only provide information up until the base of the Cypris formation or, in the eastern part, until the coal–lignite and Lower Sand formation has been reached (Fig. 2). Stratigraphic records mention the occurrence of phyllite at the base, yet it is described to be very heavily weathered and/or altered (Dobeš et al., 1986; Špičáková et al., 2000; Fiala and Vejnar, 2004; Bussert et al., 2017).
As mentioned before, reliable data on the thickness of the weathering zone itself and the transition to unweathered phyllite are scarce. To our knowledge, only one drill in the vicinity provides sufficient information for depths >0.5 km: borehole HV-18 (E: 314979, N: 5553582 in UTM 33∘ N), with a total depth of 1200 m, that is well-described by Fiala and Vejnar (2004) and Dobeš et al. (1986). From this drill hole we can infer that underneath the compound of Tertiary deposits, different types of phyllite–mica schist occur. It is described as mostly normal phyllite with varying additional horizons of tuffitic, silicified, metabasite-bearing, or FeS2-bearing layers (Dobeš et al., 1986). The petrophysical measurements on core and outcrop samples reveal resistivities of over 500–1500 Ω m for slightly weathered to unweathered phyllite (Table 1), which we do not observe in our survey even in the deepest parts. Dobeš et al. (1986) also mention the high variability of the thickness of the weathered phyllite within the Cheb Basin but assumed it to be within several tens of meters, which is characterized by resistivities of 75–140 Ω m. It is to be noted that these values are higher by 1 to 2 orders of magnitude than the resistivities in the Tertiary sediments. While the sediments of the Cypris formation are characterized by porosities of 21.2 % for the porous sandstone parts and 14.5 % for compact carbonate layers, the basement phyllites are characterized by low porosities (≈3.2 % for weathered phyllite and 1.0 % for unweathered phyllite; Table 1). However, our experiment reveals low-resistivity rocks of only 5–10 Ω m up to several hundred meters of depth – much lower than expected from previous studies. A similar phenomenon was also presented by Muñoz et al. (2018) in which a N–S-running magnetotelluric survey revealed an unusually conductive zone within the topmost kilometer beneath the degassing centers of Bublák and Hartoušov. This observation also makes the interpretation of the gravity data significantly harder. While, generally speaking, the Tertiary deposits should feature a distinct density and porosity contrast compared to a solid basement, the assumption of a massive compound of weathered and/or alterated phyllite – and the induced density shift – in between makes a gravity-based model without further constraints nearly impossible.
One key aspect in the low resistivities we observe (see Fig. 6, profile P2) might be related to the circulation and ascent of heavily mineralized water and CO2-rich fluids. Bussert et al. (2017) mention pumping tests at the HJB-1 drill site within the main degassing area around Hartoušov and, after drilling through a caprock-like layer and hitting a supposed aquifer at 79–85 m, encountering subthermal mineral water with a high conductivity of around 6800 µS cm−1 (about 1.5 Ω m). The more porous sandy parts within the Tertiary deposits are particularly aquiferous, and penetrating them resulted in a sudden outburst of gaseous CO2 and water (Bussert et al., 2017). While the pelitic layers can be considered especially impenetrable to groundwater, intense tectonic faulting is made responsible for the mixture of groundwater with deeper water-bearing formations along faults, joints, and chasms, as well as with the aquiferous Lower Argillaceous, Sandy, and Main Seam formations (Dobeš et al., 1986; Peterek et al., 2011; Bussert et al., 2017). This is stressed by geoelectric borehole logging in the HJB-1 drill at the HMF where throughout the Tertiary sediments resistivities of 5–10 Ω m were measured, and even within the topmost layers of the (weathered) basement (phyllite) resistivities did not exceed 20 Ω m. Another prominent example for the complexity of the hydrogeological situation is the nearby Soos Nature Reserve, which is just about 3 km to the NW of our survey profile (Fig. 1). Other mineral and ochre springs and mofettes are found within a few kilometers (Weinlich et al., 1998; Bräuer et al., 2005; Kämpf et al., 2013), and Karlovy Vary, Františkovy Lázně, Mariánské Lázně, Bad Brambach, and Bad Elster are well-known for their spas and diverse mineral water sources.
Our survey shows that, even within the Cypris formation, resistivities vary depending on the hydrogeological situation. Especially in the eastern half of the profile where the basin deepens, we observe higher resistivities than in the western half. One major key factor could be the absence of circulating mineral water in the sedimentary deposits in this part of the region due to a lack of tectonic faults. Instead, the lowest resistivities can be measured underneath in the phyllitic basement, indirectly implying an unusually high porosity or fractures within the basement and the occurrence of ion-enriched water in pelites, which are supposed to be compact and rather dense. Several studies (Fiala and Vejnar, 2004; Špičáková et al., 2000; Rojik et al., 2014; Peterek et al., 2011; Bankwitz et al., 2003b) provide indications for heavy strain of the Paleozoic basement. The intrusion of the Smrčiny pluton in the Carboniferous, whose contact zone with the phyllitic basement is close to our profile, and the rifting of the Eger Rift since the early Oligocene (Ziegler, 1992; Ziegler and Dezes, 2007) with several extensional and compressional stress regimes have particularly led to alterations and faults in the basement. These studies all show a basement that is heavily distorted by horsts and grabens, and it can be assumed that at least some of these provide preferential pathways for mineralized and CO2-rich water within the upper crust. Along our profile at the HMF, these fluids can propagate to the surface through the Tertiary sediments along the PPZ, but also at other sites, expressions of fluid flow can be observed (Weinlich et al., 1998; Kämpf et al., 2013; Bräuer et al., 2014). In addition, the E–W-running contact zone of the Smrčiny pluton with the crystalline basement itself has been assessed as a major migration path of juvenile CO2 (Dobeš et al., 1986, and articles therein). One striking feature in our survey is the gravity and resistivity anomaly between 1500 and 2000 m along the profile at a depth of >200 m. Since other authors (e.g., Dobeš et al., 1986; Fiala and Vejnar, 2004; Špičáková et al., 2000; Pešek et al., 2014) also mention local basaltic effusive rocks at the base of the Tertiary deposits, a possible explanation might be the existence of such an intrusion at this point. Another hypothesis could be a rather substantially lifted block of the basement due to tectonic compression. Most tectonic-based publications (Špičáková et al., 2000; Bankwitz et al., 2003b; Peterek et al., 2011) discuss the occurrence of multiple N–S-running faults in the Cheb Basin, such as the PPZ and the Skalná fault. Bankwitz et al. (2003b) and Peterek et al. (2011) mention the so-called Lužni fault as N–S-striking, 1 km to the east of and parallel to the PPZ, whose presence is derived from drainage patterns and the course of the Lužni brook and Sázek river. The projection of this fault onto our profile coincides with the resistive anomaly we measured. However, a potential fault in this case would rather lead to a negative gravity anomaly and not the positive one that is observed.
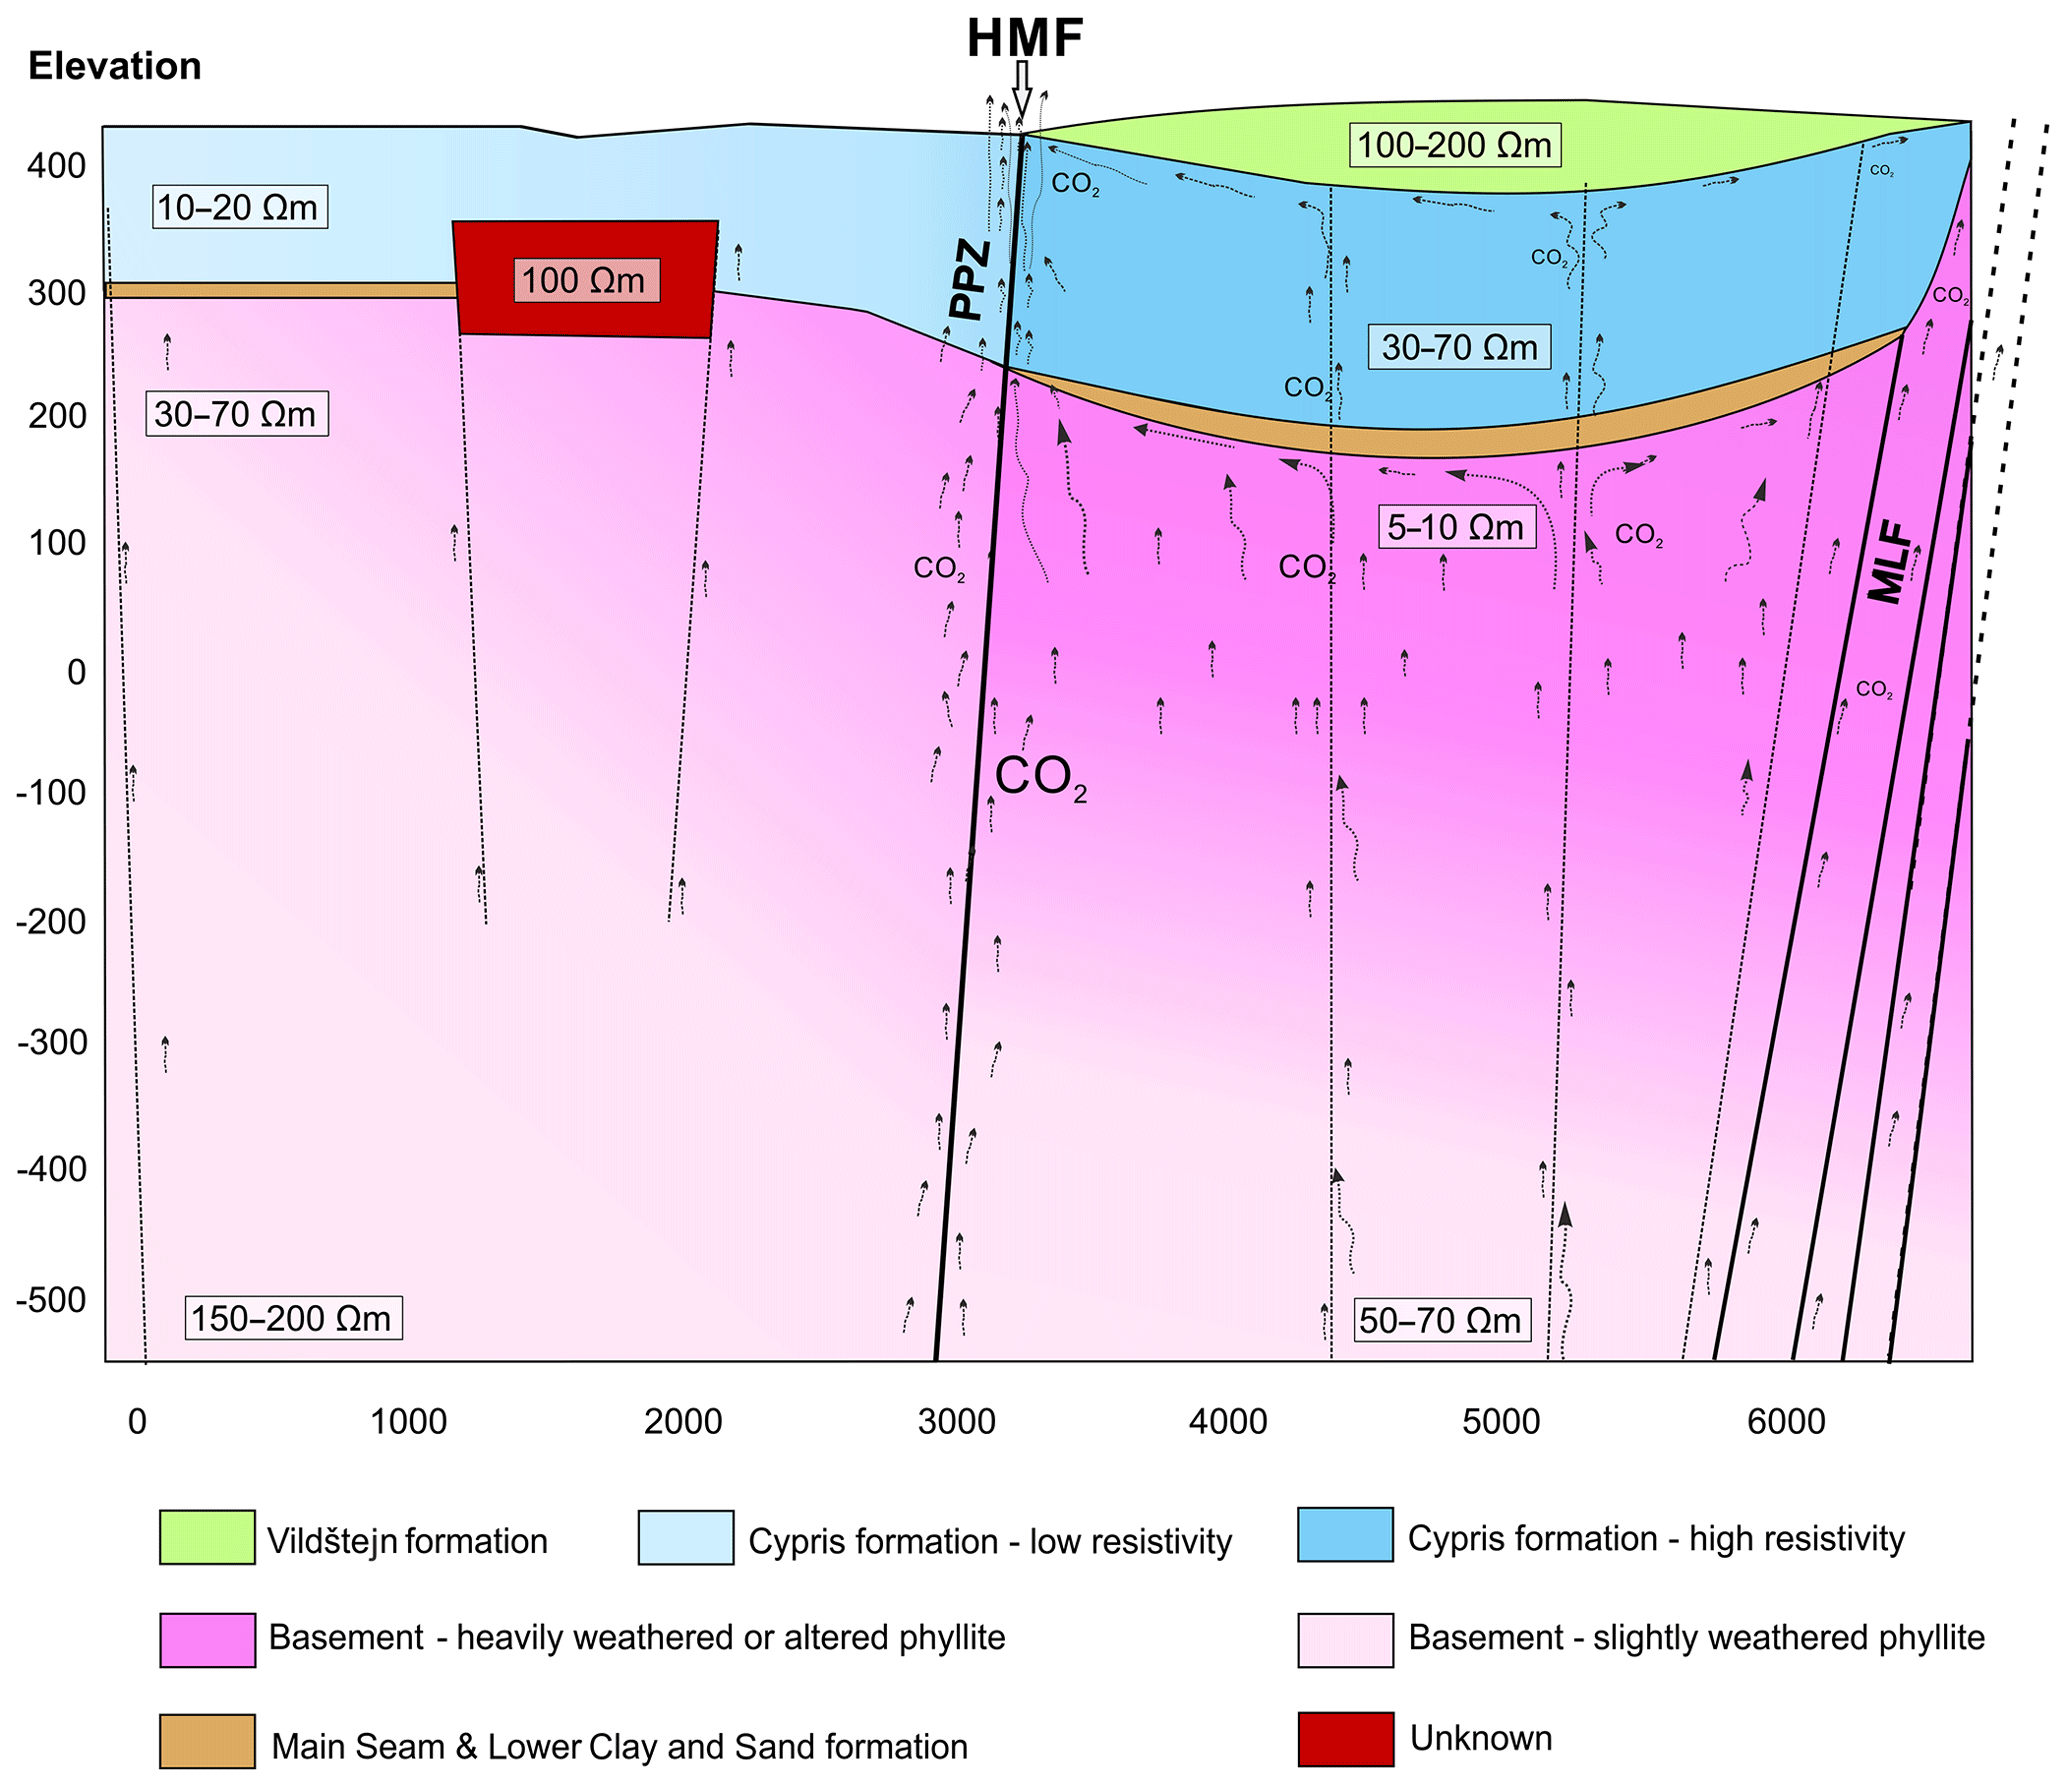
Figure 8Conceptual W–E model of the topmost 1000 m of the survey area. Stratigraphic units are based on drill core information from Fig. 2 for the first 100–300 m. While the Cypris and Vildštejn formations are characterized by higher resistivities in the eastern part, the basement features lower resistivities, which is attributed to CO2 ascent, rock alteration, and highly mineralized water. Dashed lines are inferred faults. The first few meters of Quaternary coverage are not shown.
Clear limitations of this experiment occur at depths at which stratigraphic records do not exist and thus do not provide essential information, but several assumptions can still be made about the relevant parameters.
-
Clay content. Basically, the whole basin and basement are dominated by clay minerals: the Vildštejn formation has a very high but varying clay content, the Cypris basin is made of mudstone, and the basement consists of phyllite, claystone, and mudstone, which are weathered and remineralized as clay minerals.
-
Saturation. The groundwater level is very high overall, ranging from about 5 m in the center to a few tens of meters at the eastern and western flank; otherwise, the clay-dominated rocks can be considered saturated, and considering our resolution of 100 m, this transition from unsaturated to saturated is barely noticeable in the large-scale profile. The separation of free CO2 from its solved state in water is interpreted at about 50 m, according to findings from Nickschick et al. (2015), but heavily depends on pressure.
-
Porosity. It is nigh impossible to make specific statements about the porosity at a depth of >300 m due to the complex interaction of lithostatic pressure, hydrostatic pressure, pore size change by mineral alteration, mobilization, and precipitation from the aggressive fluids and general occurrence of joints and chasms by earthquake activity and the p−T conditions in this geodynamic setting. Information on none of these can be found for the lower two-thirds of the model.
-
Fluid conductivity. This can also be assumed as highly variable. We have one single measured value for the mineral water conductivity at the central mofette site (6800 µS cm−1) (Bussert et al., 2017) for this specific area. However, we have to consider groundwater, various different mineral water springs, CO2-bearing water (dissolved CO2 and a high fraction of solved ions), free gas near the surface, and supercritical CO2 at some hundreds of meters of depth that all change depending on the location, depth, and aquifer.
Studying these in the future will be interesting when additional data might be available from this ICDP drilling or seismic exploration. Until then, the high variability of each parameter can only be estimated very roughly with this large-scale experiment and its resolution.
In Fig. 8 we combined our findings from this survey and existing lithologic information for the topmost 600 m. We can observe less resistive Tertiary deposits in the west than in the east, which we link with the occurrence of the rather thick Main Seam and Lower Sand and Clay formations working as a cap for the ascending fluids in the eastern part. On the other hand, the basement features very low resistivity in the (weathered) basement in the eastern part. Assumed pathways in the conceptual model are derived from the following facts.
-
Ascending, magmatic CO2, and fluids are migrating to the surface through the basement and basin sediments.
-
Existing faults are used as preferential pathways (PPZ and MLF as confirmed faults, several sub-faults as mentioned by Špičáková et al. (2000) and Pešek et al., 2014) with mofette activity on top.
-
The eastern side of the Tertiary sediments appears to be dry compared to the western side, while it is the other way around within the basement, indicating that the lignite and Lower Clay and Sand formations act as a fluid trap for the ascending fluids, which forces accumulation and hinders further ascent.
Due to setup and resolution limits, including additional data in the form of stratigraphic records would provide valuable information, especially for these cap-like formations, by clearly distinguishing stratigraphic units from changes in the electric resistivity and determining the very thick 500–600 m unit of low-resistivity rocks that are interpreted as heavily weathered or alterated phyllitic basement.
Our field survey aimed to image the fluid-related or fluid-affected conductivity structures beneath the Hartoušov mofette field (and its surroundings), the most prominent degassing site and center of future and present drills in the Cheb Basin. The planned 400 m ICDP drilling (Dahm et al., 2013) and the related fluid and microbiology studies will have to account for these results. Previously, it was thought that only the Tertiary sediments are significantly influenced by the water∕CO2 mixture. Instead, we showed that even the basement seems to be very reactive towards the chemical and physical alteration caused by these fluids – not only the first tens of meters, but rather a few hundreds of meters. This also means that the electric resistivity can vary significantly even within one stratigraphic unit. However, we were not able to find a distinct fluid channel at depth in the large-scale experiment. This might be related to the setup and resolution issues as we can trace fluid-related resistivity changes in the small-scale ERT profiles at the HMF. We are also not capable of finding direct evidence for the existence of the PPZ, but based on previous statements from Bankwitz et al. (2003b) and Peterek et al. (2011) and their estimations of only up to 30 m of vertical shift, we cannot hope to see it from resistivity observations alone at depth. It is possible that currently undetected, diffuse gas emissions might also occur further to the east and west. Further, additional deep-reaching investigations (e.g., seismic profiles) are needed to substantiate our interpretations and to obtain more insight into the CO2 pathways, potential rock alteration, and the subsequent influence on the petrophysical parameters (resistivity and density).
Data are available through Zenodo under the persistent DOI https://zenodo.org/record/3485127\#.XaSQc2ZCSUk (Günther et al., 2019). Contained there are the readily processed data, not the raw time series, in the unified data format plus the BERT configuration file with which the results can be reprocessed through bert cfgfile all show.
TN and CF planned the survey. TN processed a large part of the time series, did inversions, and made interpretations. CF is the PI of the project and helped with background and interpretation. FL did the small-scale ERT in his MSc project and constructed the geological section from boreholes. FO processed a part of the time series. TG did the analysis of the processed data including inversion. JM acquired and processed gravity data along the profile and prepared the gravity map. TG did data processing and quality assurance, as well as inversion and modeling. All authors helped in the field and wrote essential parts of the text.
The authors declare that they have no conflict of interest.
We would like to thank the other members of the field crew (Robert Meyer, Dieter Epping, Vitali Kipke, and Michael Grinat from LIAG Hannover; Theresa Rein, Helen Melaku, Andreas Lenz, Lutz Sonnabend, Roland Hohberg, and Rene Voigt from Leipzig University; Vaclav Polak (IG CAS Praha) for GPS measurements during gravity survey; and Claudia Schütze from UFZ Leipzig) for their enthusiastic work under challenging field conditions. We also would like to express our gratitude to Marceau Gresse and two more anonymous referees who helped to improve this article with their helpful remarks and suggestions. The joint project was funded by the German Research Council (Deutsche Forschungsgemeinschaft – DFG) under grants FL271/16-1 and GU1095/5-1.
This research has been supported by the Deutsche Forschungsgemeinschaft (grant nos. FL271/16-1 and GU1095/5-1).
This paper was edited by Ulrike Werban and reviewed by Marceau Gresse and two anonymous referees.
Alfano, L.: A modified geoelectrical procedure using polar-dipole arrays and examples of application to deep exploration, Geophys. Prospect, 22, 510–525, 1974. a
Alfano, L., Carrara, E., Pascale, G., Rapolla, A., and Roberti, N.: Analysis procedure and equipment for deep electrical soundings in noisy areas, Geothermics, 11, 269–280, 1982. a
Babuška, V., Plomerová, J., and Fischer, T.: Intraplate seismicity in the western Bohemian Massif (central Europe): a possible correlation with a paleoplate junction, J. Geodyn., 44, 149–159, 2007. a
Babuška, V., Růžek, B., and Dolejš, D.: Origin of earthquake swarms in the western Bohemian Massif: Is the mantle CO2 degassing, followed by the Cheb Basin subsidence, an essential driving force?, Tectonophysics, 668–669, 42–51, https://doi.org/10.1016/j.tecto.2015.12.008, 2016. a, b
Bankwitz, P., Bankwitz, E., Bräuer, K., Kämpf, H., and Störr, M.: Deformation structures in Plio- and Pleistocene sediments (NW Bohemia, Central Europe), in: Subsurface Sediments Mobilization, edited by: Van Rensbergen, P., Hills, R. R., Maltmann, A. J., and Morley, C. K., Geol. Soc. London, Spec. Publ., 2003a. a, b, c
Bankwitz, P., Schneider, G., Kämpf, H., and Bankwitz, E.: Structural characteristics of epicentral areas in Central Europe: study case Cheb Basin (Czech Republic), J. Geodyn., 35, 5–32, 2003b. a, b, c, d, e, f, g, h, i, j
Bergmann, P., Schmidt-Hattenberger, C., Labitzke, T., Wagner, F., Just, A., Flechsig, C., and Rippe, D.: Fluid injection monitoring using electrical resistivity tomography – five years of CO2 injection at Ketzin, Germany: Fluid injection monitoring, Geophys. Prospect., 65, 859–875, https://doi.org/10.1111/1365-2478.12426, 2017. a, b
Blecha, V., Fischer, T., Tábořík, P., Vilhem, J., Klanica, R., Valenta, J., and Štěpančíková, P.: Geophysical evidence of the Eastern Marginal Fault of the Cheb Basin (Czech Republic), Studia Geophysica et Geodaetica, 62, 660–680, https://doi.org/10.1007/s11200-017-0452-9, 2018. a, b
Bräuer, K., Kämpf, H., Niedermann, S., and Strauch, G.: Evidence for ascending upper mantle-derived melt beneath the Cheb basin, Central Europe, Geophys. Res. Lett., 32, L08303, https://doi.org/10.1029/2004GL022205, 2005. a, b, c
Bräuer, K., Kämpf, H., Niedermann, S., Strauch, G., and Tesař, J.: The natural laboratory NW Bohemia-comprehensive fluid studies between 1992 and 2005 used to trace geodynamic processes, Geochem. Geophys., 9, L17309, https://doi.org/10.1029/2009GL039615, 2008. a, b, c, d
Bräuer, K., Kämpf, H., and Strauch, G.: Earthquake swarms in non-volcanic regions: what fluids have to say, Geophys. Res. Lett., 36, L17309, https://doi.org/10.1029/2009GL039615, 2009. a, b, c, d, e
Bräuer, K., Kämpf, H., Koch, U., and Strauch, G.: Monthly monitoring of gas and isotope compositions in the free gas phase at degassing locations close to the Novy Kostel focal zone in the western Eger Rift, Czech Republic, Chem. Geol., 290, 163–176, https://doi.org/10.1016/j.chemgeo.2011.09.012, 2011. a, b
Bräuer, K., Kämpf, H., and Strauch, G.: Seismically triggered anomalies in the isotope signatures of mantle-derived gases detected at degassing sites along two neighboring faults in NW Bohemia, central Europe, J. Geophys. Res.-Sol. Ea., 119, 5613–5632, https://doi.org/10.1002/2014JB011044, 2014. a
Bussert, R., Kämpf, H., Flechsig, C., Hesse, K., Nickschick, T., Liu, Q., Umlauft, J., Vylita, T., Wagner, D., Wonik, T., Flores, H. E., and Alawi, M.: Drilling into an active mofette: pilot-hole study of the impact of CO2-rich mantle-derived fluids on the geo–bio interaction in the western Eger Rift (Czech Republic), Sci. Dril., 23, 13–27, https://doi.org/10.5194/sd-23-13-2017, 2017. a, b, c, d, e, f, g, h, i, j, k, l, m, n
Carrigan, C., Yang, X., LaBrecque, D., Larsen, D., Freeman, D., Ramirez, A., Daily, W., Aines, R., Newmark, R., Friedmann, J., and Hovorka, S.: Electrical resistance tomographic monitoring of CO2 movement in deep geologic reservoirs, Int. J. Greenh. Gas Con., 18, 401, https://doi.org/10.1016/j.ijggc.2013.04.016, 2013. a
Cerv, V., Pek, J., Pecová, J., and Praus, O.: Geological model of Western Bohemia Related to the KTB Borehole in Germany, vol. 47, chap. Deep geo-electrical research in the western margin of the Bohemian Massif, Czech Geol. Survey, pp. 139–148, 1997. a
Cerv, V., Kováiková, S., Pek, J., Pecová, J., and Praus, O.: Geoelectrical structure across the Bohemian Massif and the transition zone to the West Carpathians, Tectonophysics, 332, 201–210, 2001. a
Coscia, I., Greenhalgh, S., Linde, N., Doetsch, J., Marescot, L., Günther, T., and Green, A.: 3D crosshole apparent resistivity static inversion and monitoring of a coupled river-aquifer system, Geophysics, 76, G49–59, 2011. a, b
Dahm, T., Hrubcová, P., Fischer, T., Horálek, J., Korn, M., Buske, S., and Wagner, D.: Eger Rift ICDP: an observatory for study of non-volcanic, mid-crustal earthquake swarms and accompanying phenomena, Sci. Dril., 16, 93–99, https://doi.org/10.5194/sd-16-93-2013, 2013. a, b, c, d
Di Mauro, D., Gianni, V., Manzella, A., Zaja, A., Praticelli, N., Cerv, V., Pek, J., and De Santis, A.: Magnetotelluric investigations of the seismically active region of Northwest Bohemia: preliminary results, Ann. Geofis, 42, 39–48, 1999. a
Dobeš, M., Hercog, F., and Mazáč, O.: Die geophysikalische Untersuchung der hydrogeologischen Strukturen im Cheb-Becken, Sbor. Geol. Věd. Geol., 21, 117–158, 1986. a, b, c, d, e, f, g, h, i, j
Fiala, J. and Vejnar, Z.: The lithology, geochemistry, and metamorphic gradation of the crystalline basement of the Cheb (Eger) Tertiary Basin, Saxothuringian Unit, Bull Geosci, 79, 41–52, 2004. a, b, c, d
Finizola, A., Aubert, M., Revil, A., Schütze, C., and Sortino, F.: Importance of structural history in the summit area of Stromboli during the 2002–2003 eruptive crisis inferred from temperature, soil CO2, self-potential, and electrical resistivity tomography, J. Volcanol. Geoth. Res., 183, 213–227, 2009. a
Fischer, T. and Michálek, J.: Post 2000-swarm microearthquake activity in the principal focal zone of West Bohemia/Vogtland: Space-time distribution and waveform similarity analysis, Stud. Geophy. Geod., 52, 493–511, 2008. a
Fischer, T., Horálek, J., Hrubcová, P., Vavryčuk, V., Bräuer, K., and Kämpf, H.: Intra-continental earthquake swarms in West-Bohemia and Vogtland: A review, Tectonophysics, 611, 1–27, https://doi.org/10.1016/j.tecto.2013.11.001, 2014. a, b, c, d, e, f, g, h, i
Fischer, T., Matyska, C., and Heinicke, J.: Earthquake-enhanced permeability – evidence from carbon dioxide release following the ML 3.5 earthquake in West Bohemia, Earth Planet. Sc. Let., 460, 60–67, https://doi.org/10.1016/j.epsl.2016.12.001, 2017. a
Flechsig, C., Bussert, R., Rechner, J., Schütze, C., and Kämpf, H.: The Hartoušov Mofette Field in the Cheb Basin, Western Eger Rift (Czech Republic): A Comparative Geoelectric, Sedimentologic and Soil Gas Study of a Magmatic Diffuse CO2-Degassing Structure, Z. Geol. Wiss., 36, 177–193, 2008. a, b, c, d, e
Flechsig, C., Fabig, T., Rücker, C., and Schütze, C.: Geoelectrical Investigations in the Cheb Basin/W-Bohemia: An Approach to Evaluate the Near-Surface conductivity structure, Stud. Geophys. Geod., 54, 417–437, 2010. a, b, c, d
Flechsig, C., Heinicke, J., Mrlina, J., Kämpf, H., Nickschick, T., Schmidt, A., Bayer, T., Günther, T., Rücker, C., Seidel, E., and Seidl, M.: Integrated geophysical and geological methods to investigate the inner and outer structures of the Quaternary Mýtina maar (W-Bohemia, Czech Republic), Int. J. Earth Sci., 104, 2087–2105, https://doi.org/10.1007/s00531-014-1136-0, 2015. a
Friedel, S.: Über die Abbildungseigenschaften der geoelektrischen Impedanztomographie unter Berücksichtigung von endlicher Anzahl und endlicher Genauigkeit der Messdaten, PhD thesis, University of Leipzig, Shaker Verlag, Aachen, 2000. a, b, c
Geissler, W. H., Kämpf, H., Kind, R., Bräuer, K., Klinge, K., Plenefisch, T., Horalek, J., Zednik, J., and Nehybka, V.: Seismic structure and location of a CO2 source in the upper mantle of the western Eger (Ohre) rift, Central Europe, Tectonics, 24, TC5001, https://doi.org/10.1029/2004TC001672, 2005. a, b
Gresse, M., Vandemeulebrouck, J., Byrdina, S., Chiodini, G., Johnson, T., Ricci, T., Vilardo, G., Mangiacapra, A., Lebourg, T., Grangeon, J., Bascou, P., and Metral, L.: Three‐Dimensional Electrical Resistivity Tomography of the Solfatara Crater (Italy): Implication for the Multiphase Flow Structure of the Shallow Hydrothermal System, J. Geophys. Res.-Sol. Ea., 122, 8749–8768, https://doi.org/10.1002/2017JB014389, 2017. a
Günther, T.: Inversion Methods and Resolution Analysis for the 2D/3D Reconstruction of Resistivity Structures from DC Measurements, PhD thesis, University of Mining and Technology Freiberg, available at: http://nbn-resolving.de/urn:nbn:de:swb:105-4152277 (last access: 7 November 2019), 2004. a
Günther, T. and Rücker, C.: Boundless Electrical Resistivity Tomography BERT v2.2 – the user tutorial, LIAG Hannover, TU Berlin, available at: http://www.resistivity.net/download/bert-tutorial.pdf (last access: 7 November 2019), 2019. a
Günther, T., Rücker, C., and Spitzer, K.: 3-D modeling and inversion of DC resistivity data incorporating topography – Part II: Inversion, Geophys. J. Int., 166, 506–517, https://doi.org/10.1111/j.1365-246X.2006.03011.x, 2006. a, b, c
Günther, T., Schaumann, G., Musmann, P., and Grinat, M.: Imaging of a fault zone by a large-scale dc resistivity experiment and seismic structural information, in: Near Surface 2011 – the 17th European Meeting of Environmental and Engineering Geophysics, Leicester, UK, https://doi.org/10.3997/2214-4609.20144437, 2011. a
Günther, T., Nickschick, T., Flechsig, C., Löbig, F., and Oppermann, F.: ERT Datasets for the paper of Nickschick et al. (2019) in Solid Earth [Data set], Zenodo, https://zenodo.org/record/3485127\#.XaSQc2ZCSUk, 2019. a
Hainzl, S., Fischer, T., Čermáková, H., Bachura, M., and Vlček, J.: Aftershocks triggered by fluid intrusion: Evidence for the aftershock sequence occurred 2014 in West Bohemia/Vogtland, J. Geophys. Res.-Sol. Ea., 121, 2575–2590, https://doi.org/10.1002/2015JB012582, 2016. a
Hecht, L., Vigneresse, J., and Morteani, G.: Constraints on the origin of zonation of the granite complexes in the Fichtelgebirge (Germany and Czech Republic): evidence from a gravity and geochemical study, Geol. Rundsch., 86, Suppl. S93–S109, 1997. a
Heinicke, J. and Koch, U.: Slug flow – a possible explanation for hydrogeochemical earthquake precursors at Bad Brambach, Germany, Pure Appl. Geophys., 157, 1621–1641, 2000. a, b
Horálek, J. and Fischer, T.: Role of crustal fluids in triggering the West Bohemia/Vogtland earthquake swarms: just what we know (a review), Stud. Geophys. Geod., 52, 455–478, 2008. a
Hrubcová, P., Geissler, W. H., Bräuer, K., Václav, V., Tomek, V., and Kämpf, H.: Active Magmatic Underplating in Western Eger Rift, Central Europe, Tectonics, 36, 2846–2862, https://doi.org/10.1002/2017TC004710, 2017. a
Irwin, W. P. and Barnes, I.: Tectonic relations of carbon dioxide discharges and earthquakes, J. Geophys. Res., 85, 3115–3121, 1980. a
Kämpf, H., Bräuer, K., Schumann, J., Hahne, K., and Strauch, G.: CO2 discharge in an active, non-volcanic continental rift area (Czech Republic): Characterisation (13C, 3He∕4He) and quantification of diffuse and vent CO2 emissions, Chem. Geol., 339, 81–83, 2013. a, b, c, d, e, f, g, h, i, j, k
Malkovský, M.: The Mesozoic and Tertiary basins of the Bohemian Massif and their evolution, Tectonophysics, 137, 31–42, 1987. a
Mrlina, J., Kämpf, H., Geissler, W. H., and van de Boogard, P.: Proposed Quatenary maar structure at the Czech/German boundary between Mýtina and Neualbenreuth (Western Eger Rift, Central Europe), Z. Geol. Wiss., 35, 213–230, 2007. a
Mrlina, J., Kämpf, H., Kroner, C., Mingram, J., Stebich, M., Brauer, A., Geissler, W. H., Kallmeyer, J., Matthes, H., and Seidl, M.: Discovery of the first Quaternary maar in the Bohemian Massif, Central Europe, based on combined geophysical and geological surveys, J. Volcanol. Geoth. Res., 182, 97–112, 2009. a
Muñoz, G., Weckmann, U., Pek, J., Kováčiková, S., and Klanica, R.: Regional two-dimensional magnetotelluric profile in West Bohemia/Vogtland reveals deep conductive channel into the earthquake swarm region, Tectonophysics, 727, 1–11, https://doi.org/10.1016/j.tecto.2018.01.012, 2018. a, b, c
Naess, O. E. and Bruland, L.: Stacking methods other than simple summation, in: Developments in Geophysical Exploration Methods, edited by: Fitch, A. A., Applied Science Publications, London, 6, 189–224, 1979. a
Nakatsuka, Y., Xue, Z., Garcia, H., and Matsuoka, T.: Experimental study on CO2 monitoring and quantification of stored CO2 in saline formations using resistivity measurements, Int. J. Greenh. Gas Con., 4, 209–216, https://doi.org/10.1016/j.ijggc.2010.01.001, 2010. a
Neunhöfer, H. and Hemmann, A.: Earthquake swarms in the Vogtland/Western Bohemian region: Spatial distribution and magnitude-frequency distribution as an indication of the genesis of swarms?, J. Geodyn., 39, 361–385, 2005. a
Nickschick, T., Kämpf, H., Flechsig, C., Mrlina, J., and Heinicke, J.: CO2 degassing in the Hartoušov mofette area, western Eger Rift, imaged by CO2 mapping and geoelectrical and gravity surveys, Int. J. Earth Sci., 104, 2107–2129, https://doi.org/10.1007/s00531-014-1140-4, 2015. a, b, c, d, e, f, g, h, i, j, k, l, m
Nickschick, T., Flechsig, C., Meinel, C., Mrlina, J., and Kämpf, H.: Architecture and temporal variations of a terrestric CO2 degassing site using electric resistivity and CO2 gas measurements, Int. J. Earth Sci., 106, 2915–2926, https://doi.org/10.1007/s00531-017-1470-0, 2017. a, b, c, d, e
Oppermann, F. and Günther, T.: A remote-control datalogger for large-scale resistivity surveys and robust processing of its signals using a software lock-in approach, Geosci. Instrum. Method. Data Syst., 7, 55–66, https://doi.org/10.5194/gi-7-55-2018, 2018. a, b, c
Pešek, J., Brož, B., Brzobohatý, R., Dašková, J., Doláková, N., Elznic, A., Fejfar, O., Franců, J., Hladilová, v., Holcová, K., Honěk, J., Hoňková, K., Kvaček, J., Kvaček, Z., Macůrek, V., Mikuláš, R., Opluštil, S., Rojík, P., Spudil, J., Svobodová, M., Sýkorová, I., Švábenická, L., Teodoridis, V., and Tomanová-Petrová, P.: Tertiary Basins and Lignite Deposits of the Czech Republic, Czech Geological Survey, Praha, 1 edn., 2014. a, b, c, d, e
Peterek, A., Reuther, C.-D., and Schunk, R.: Neotectonic evolution of the Cheb Basin (Northwestern Bohemia, Czech Republic) and its implications for the late Pliocene to Recent crustal deformation in the western part of the Eger Rift, Z. Geol. Wiss., 5/6, 335–365, 2011. a, b, c, d, e, f, g, h, i, j, k
Pettinelli, E., Beaubie, S. E., Zaja, A., Menghini, A., Praticelli, N., Mattei, E., Di Matteo, A., Ciotoli, G., and Lombardi, S.: Characterization of a CO2 gas vent using various geophysical and geochemical methods, Geophysics, 75, 137–146, 2010. a
Pícha, B. and Hudeková, E.: Geological model of Western Bohemia Related to the KTB Borehole in Germany., vol. 47, chap. Magnetotelluric sounding along the profile 9HR., pp. 149–162, Czech Geol. Survey, 1997. a
Pribnow, D. F. C., Schütze, C., Hurter, S. J., Flechsig, C., and Sass, J.: Fluid flow in the resurgent dome of Long Valley Caldera: Implications from thermal data and deep electrical sounding, J. Volcanol. Geoth. Res., 127, 329–245, 2003. a, b
Revil, A., Finizola, A., Piscitelli, S., Rizzo, E., Ricci, T., Crespy, A., Angeletti, B., Balasco, M., Barde Cabusson, S., Bennati, L., Bolève, A., Byrdina, S., Carzaniga, N., Di Gangi, F., Morin, J., Perrone, A., Rossi, M., Roulleau, E., and Suski, B.: Inner structure of La Fossa di Vulcano (Vulcano Island, southern Tyrrhenian Sea, Italy) revealed by high resolution electric resistivity tomography coupled with self-potential, temperature, and soil CO2 diffuse degassing measurements, J. Geophys. Res.-Space Phys., 113, B07207, https://doi.org/10.1029/2007JB005394, 2008. a
Revil, A., Finiziola, A., Ricci, T., Delcher, E., Peltier, A., Barde Cabusson, S., Avard, G., Bailly, T., Bennati, L., Byrdina, S., Cologne, J., Di Gangi, F., Douillet, G., Lupi, M., Letort, J., and Tsang Hin Sun, E.: Hydrogeology of Stromboli volcano, Aeolian Islands (Italy) from the interpretation of resistivity tomograms, self-potential, soil temperature and soil CO2 concentration measurements, Geophys. J. Int., 186, 88–98, 2011. a
Rohrmüller, J., Kämpf, H., Geiß, E., Großmann, J., Grun, I., Mingram, J., Mrlina, J., Plessen, B., Stebich, M., Veress, C., Wendt, A., and Nowaczyk, N.: Reconnaissance study of an inferred Quaternary maar structure in the western part of the Bohemian Massif near Neualbenreuth, NE-Bavaria (Germany), Int. J. Earth Sci., 107, 1381–1405, https://doi.org/10.1007/s00531-017-1543-0, 2018. a
Rojik, P., Fejfar, O., Dašková, J., Kvaček, Z., Pešek, J., Sýkorová, I., and Teodoridis, V.: Krušné hory Piedmont basins – Cheb Basin, in: Tertiary Basins and Lignite Deposits of the Czech Republic, edited by: Pešek, J., Tertiary Basins and Lignite Deposits of the Czech Republic, Prague, 2014. a, b, c, d
Ronczka, M., Rücker, C., and Günther, T.: Numerical study of long electrode electric resistivity tomography – Accuracy, sensitivity, and resolution., Geophysics, 80, E317–E328, 2015. a
Ronczka, M., Hellman, K., Günther, T., Wisén, R., and Dahlin, T.: Electric resistivity and seismic refraction tomography: a challenging joint underwater survey at Äspö Hard Rock Laboratory, Solid Earth, 8, 671–682, https://doi.org/10.5194/se-8-671-2017, 2017. a
Rücker, C., Günther, T., and Wagner, F.: pyGIMLi: An open-source library for modelling and inversion in geophysics, Comput. Geosci., 109, 106–123, 2017. a
Růžek, B. and Horálek, J.: Three-dimensional seismic velocity model of the West Bohemia/Vogtland seismoactive region, Geophys. J. Int., 195, 1251–1266, 2013. a
Sauer, U., Schütze, C., C., L., Schlömer, S., and Dietrich, P.: An Integrative Hierarchical Monitoring Approach for Detecting and Characterizing CO2 Releases, Energy Procedia, 37, 4257–4267, 2013. a
Schmidt-Hattenberger, C., Bergmann, P., Bösing, D., Labitzke, T., Möller, M., Schröder, S., Wagner, F., and Schütt, H.: Electrical Resistivity Tomography (ERT) for Monitoring of CO2 Migration – from Tool Development to Reservoir Surveillance at the Ketzin Pilot Site, Energy Procedia, 37, 4268–4275, https://doi.org/10.1016/j.egypro.2013.06.329, 2013. a, b, c
Schütze, C. and Flechsig, C.: Structural investigations of an active hydrothermal system beneath the Long Valley Caldera, California, using DC-Resistivity imaging methods, Z. Geol. Wiss., 30, 119–129, 2002. a, b
Schütze, C., Sauer, U., Beyer, K., Lamert, H., Bräuer, K., Strauch, G., Flechsig, C., Kämpf, H., and Dietrich, P.: Natural analogues: a potential approach for developing reliable monitoring methods to understand subsurface CO2 migration processes, Environ. Earth Sci., 67, 411–423, 2012. a, b
Špičak, A. and Hóralek, J.: Possible role of fluids in the process of earthquake swarm generation in the West Bohemia/Vogtland seismoactive region, Tectonophysics, 336, 151–161, 2001. a
Špičáková, A., Ulčny, D., and Kouldelková, G.: Tectonosedimentary evolution of the Cheb Basin (NW Bohemia, Czech Republic) between Oligocene and Pliocene: A preliminary note, Stud. Geophys. Geod., 44, 556–580, 2000. a, b, c, d, e, f
Storz, H., Storz, W., and Jacobs, F.: Electrical resistivity tomography to investigate geological structures of the earth’s upper crust, Geophy. Prosp., 48, 455–471, 2000. a, b
Švancara, J., Gnojek, I., Hubatka, F., and Dědáček, K.: Geophysical field pattern in the West Bohemian geodynamic active area, Stud. Geophys. Geod., 44, 307–326, 2000. a
Udphuay, S., Günther, T., Everett, M., Warden, R., and Briaud, J.-L.: Three-dimensional resistivity tomography in extreme coastal terrain amidst dense cultural signals: application to cliff stability assessment at the historic D-Day site, Geophys. J. Int., 185, 201–220, 2011. a, b
Weinlich, F. H., Tesař, J., Weise, S. M., Bräuer, K., and Kämpf, H.: Gas flux distribution in mineral springs and tectonic structure in north-west Bohemia, J. Czech. Geol. Soc., 43, 91–110, 1998. a, b, c, d, e
Weise, S. M., Bräuer, K., Kämpf, H., Strauch, G., and Koch, U.: Transport of mantle volatiles through the crust traced by seismically released fluids: A natural experiment in the earthquake swarm area Vogtland/NW Bohemia, Central Europe, Tectonophysics, 336, 137–150, 2001. a
Ziegler, P. and Dezes, P.: Cenozoic uplift of Variscan Massifs in the Alpine foreland: timing and controlling mechanisms, Global Planet. Change, 58, 237–269, 2007. a, b
Ziegler, P. A.: European Cenozoic Rift system, Tectonophysics, 208, 91–111, 1992. a, b, c