the Creative Commons Attribution 4.0 License.
the Creative Commons Attribution 4.0 License.
 | 22 Mar 2019
Linked thick- to thin-skinned inversion in the central Kirthar Fold Belt of Pakistan
Ralph Hinsch
Chloé Asmar
Muhammad Nasim
Muhammad Asif Abbas
Shaista Sultan
The Kirthar Fold Belt is part of the transpressive transfer zone in Pakistan linking the Makran accretionary wedge with the Himalaya orogeny. The region is deforming very obliquely, nearly parallel to the regional S–N plate motion vector, indicating strong strain partitioning. In the central Kirthar Fold Belt, folds trend roughly N–S and their structural control is poorly understood. In this study, we use newly acquired 2-D seismic data with pre-stack depth migration, published focal mechanisms, surface and subsurface geological data, and structural modelling with restoration and balancing to constrain the structural architecture and kinematics of the Kirthar Fold Belt.
The central Kirthar Fold Belt is controlled by Pliocene to recent linked thick-skinned to thin-skinned deformation. The thick-skinned faults are most likely partially inverting rift-related normal faults. Focal mechanisms indicate dip-slip faulting on roughly N–S-trending faults with some dip angles exceeding 40∘, which are considered too steep for newly initiated thrust faults. The hinterland of the study area is primarily dominated by strike-slip faulting. The inverting faults do not break straight through the thick sedimentary column of the post-rift and flexural foreland; rather, the inversion movements link with a series of detachment horizons in the sedimentary cover. Large-scale folding and layer-parallel shortening has been observed in the northern study area. In the southern study area progressive imbrication of the former footwall of the normal fault is inferred. Due to the presence of a thick incompetent upper unit (Eocene Ghazij shales) these imbricates develop as passive roof duplexes. In both sectors the youngest footwall shortcut links with a major detachment and the deformation propagates to the deformation front, forming a large fault-propagation fold. Shortening within the studied sections is calculated to be 18 %–20 %.
The central Kirthar Fold Belt is a genuine example of a hybrid thick- and thin-skinned system in which the paleogeography controls the deformation. The locations and sizes of the former rift faults control the location and orientation of the major folds. The complex tectonostratigraphy (rift, post-rift, flexural foreland) and strong E–W gradients define the mechanical stratigraphy, which in turn controls the complex thin-skinned deformation.
- Article
(18853 KB) - Full-text XML
-
Supplement
(4496 KB) - BibTeX
- EndNote


The external regions of fold–thrust belts are typically interpreted using templates from classical thin-skinned thrust-related deformation. However, more and more thrust belts are interpreted as showing a strong influence of linked basement-involved deformation (Lacombe and Bellahsen, 2016, and references therein). The inversion of inherited rift faults is one possibility of thick-skinned contribution in a thrust belt. Furthermore, the direct linkage of inverting basement faults to thin-skinned thrusts in the external parts of orogens (hybrid thick- and thin-skinned system) has received more attention recently (e.g. Giambiagi et al., 2008; Fuentes et al., 2016; Mahoney et al., 2017).
As an outcome of structural investigations for hydrocarbon exploration we are able to report a well-constrained example of linked thin-skinned to thick-skinned deformation at the deformation front of the central Kirthar Fold Belt in Pakistan. This example illustrates the kinematic linkage between inverting deep-reaching faults and the associated thin-skinned deformation; it also shows how this hybrid system is strongly controlled by its paleostructural (extension–rift) and paleogeographic (mechanical stratigraphy) inheritance.
The Kirthar Fold Belt belongs to the western fold belts in Pakistan, which is a zone of strike-slip faults and fold belts along the western lateral boundary of the Indian Plate linking the Himalaya orogen with the Makran accretionary wedge (Lawrence et al., 1981; Bannert et al., 1992, Fig. 1). The northern Kirthar Fold Belt, as well as the Sulaiman Mountains to the north of it, had been traditionally interpreted with classical fold–thrust belt geometries with an implied shortening magnitude of 30 %–40 % (Banks and Warburton, 1986; Humayon et al., 1991; Jadoon et al., 1992, 1993; Fig. 2a–c; see location examples in Fig. 1). In contrast, the southern Kirthar Fold Belt had been field investigated (Smewing et al., 2002a) and modelled (Fowler et al., 2004) with the conclusion that the deformation in the belt is dominated by inversion tectonics (Fig. 2e) with an estimated shortening of approximately 17 %.
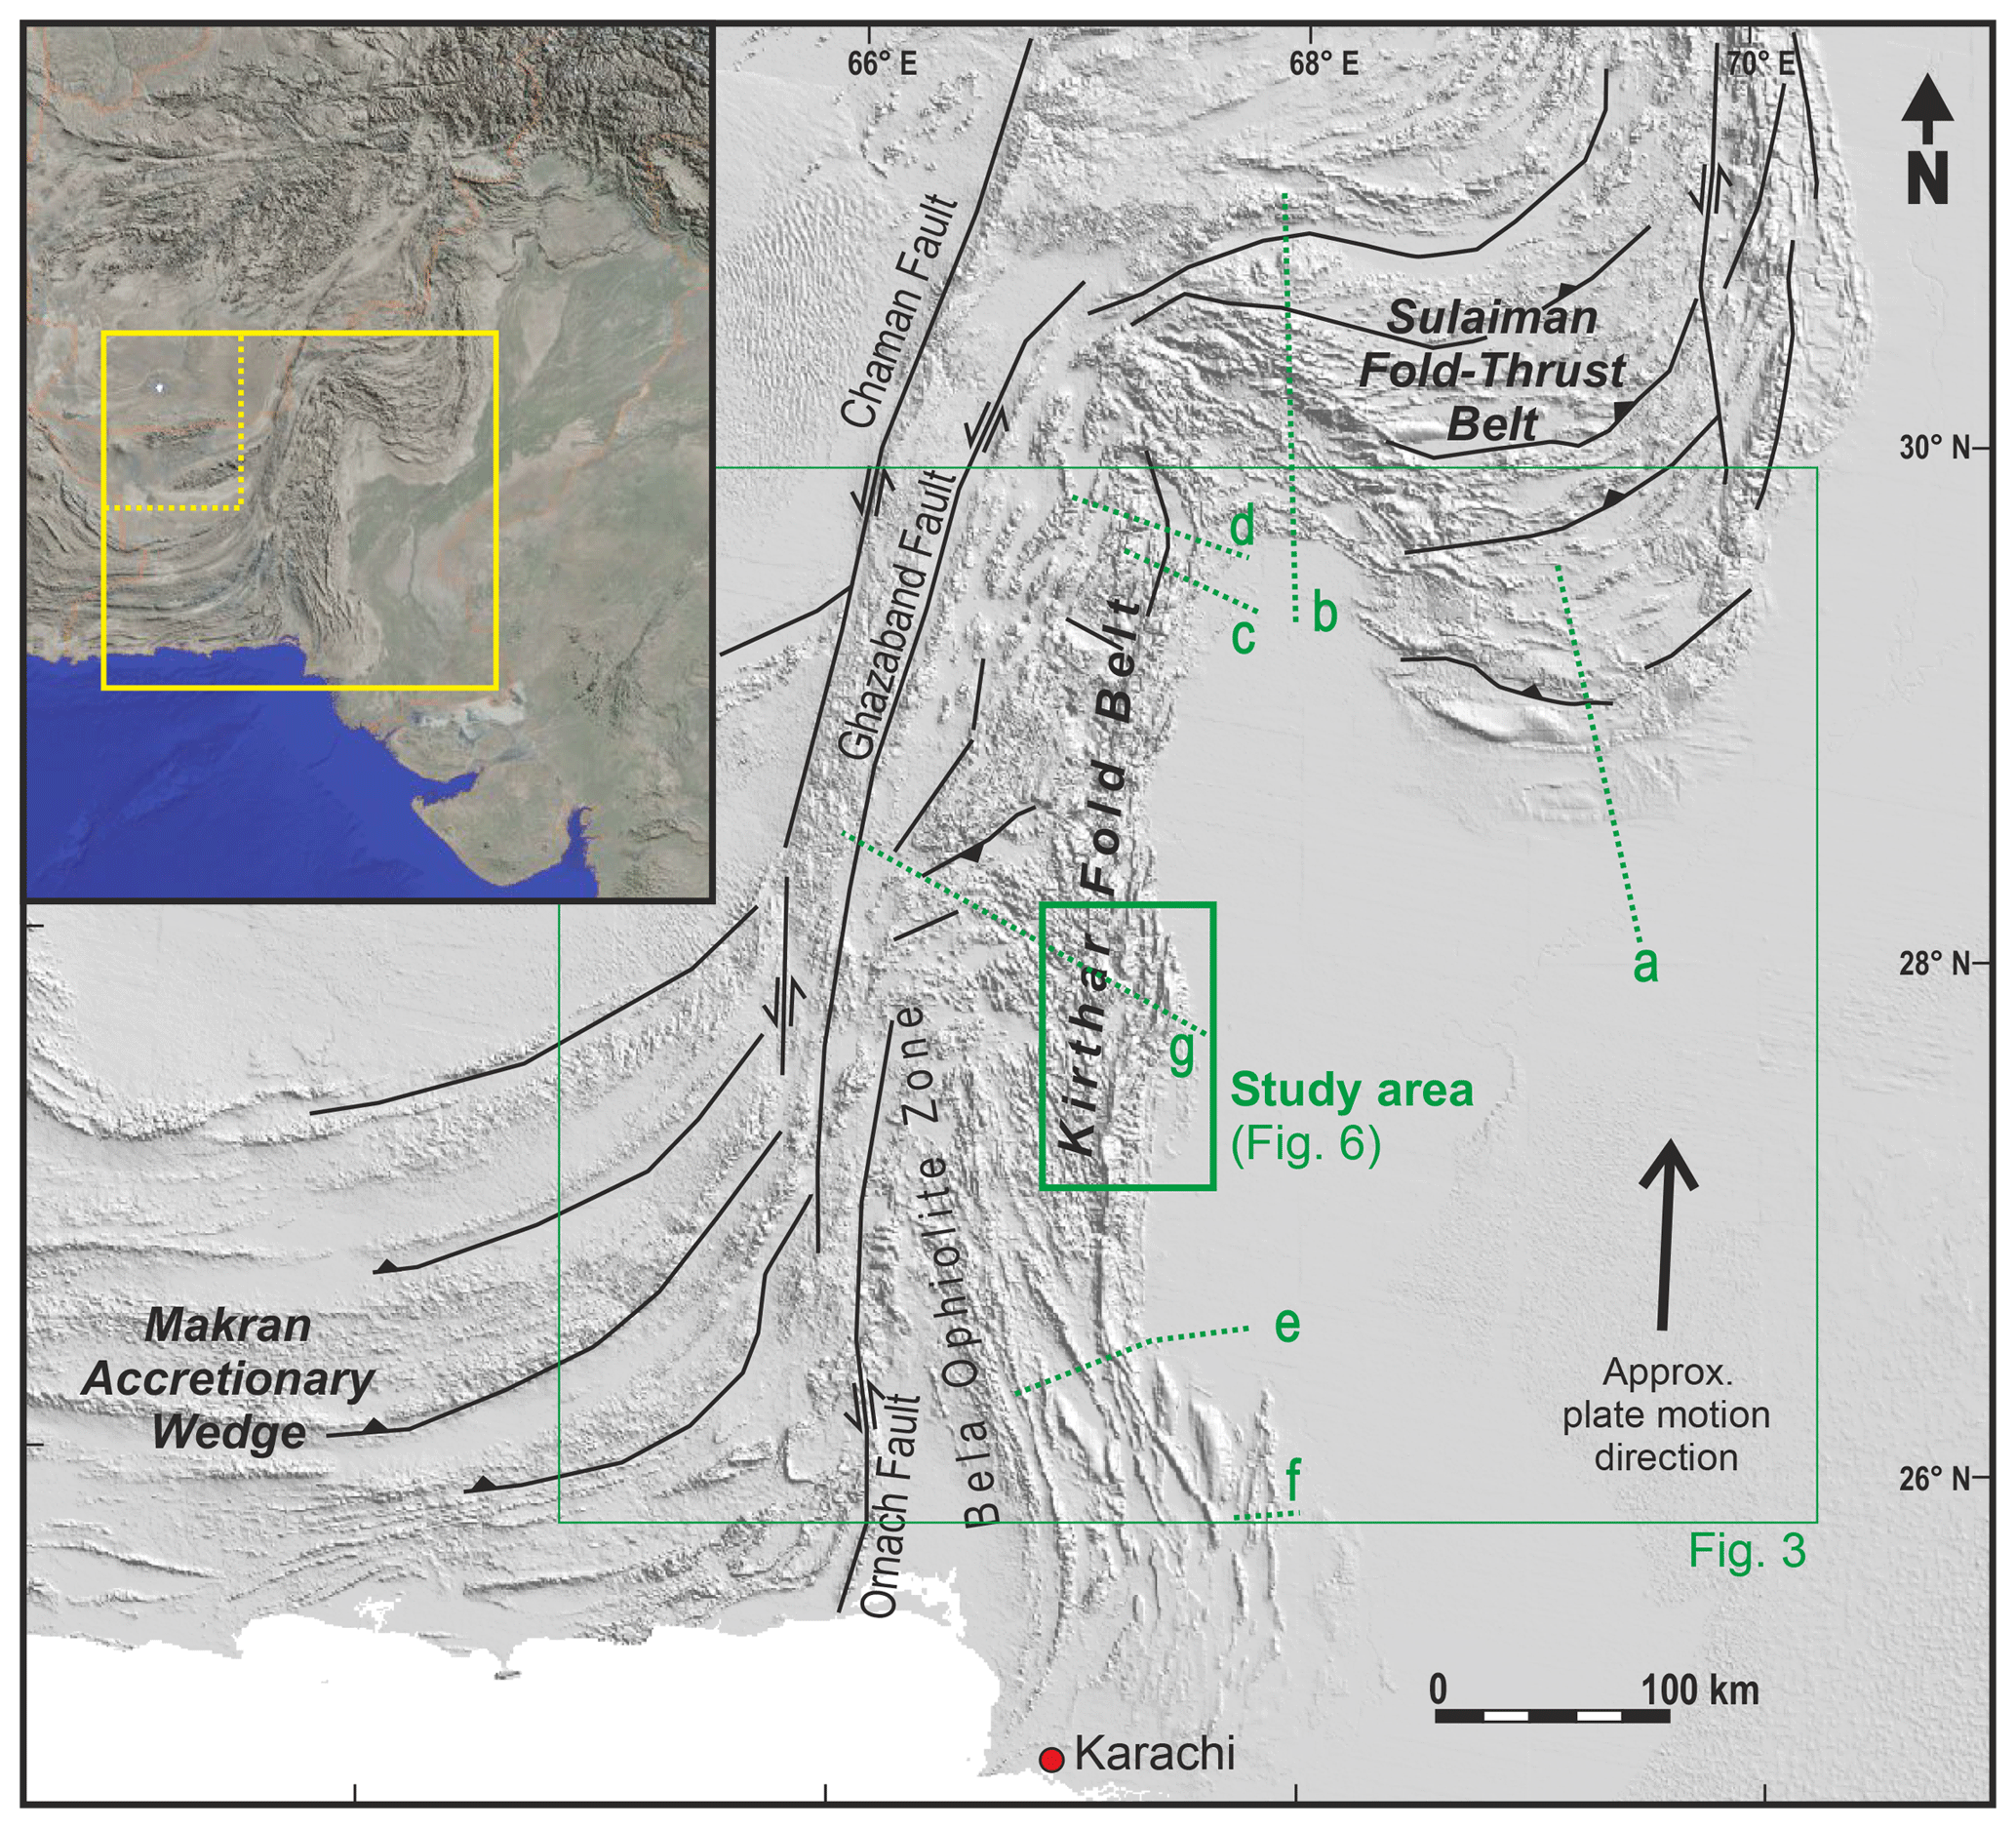
Figure 1Simplified structural sketch of the wider Kirthar Fold Belt area on a shaded relief map. Location is indicated in the inset map. The approximate plate motion is from Mohadjer et al. (2010). Locations of sections in Fig. 2 are indicated: a: Jadoon et al. (1992), b + c: Banks and Warburton (1986), d: Szeliga et al. (2009), e: Fowler et al. (2004), f: Schelling (1999), g: this study.
The reported contrasting styles of deformation in the Kirthar Fold Belt would imply significant and potentially implausible along-strike variation in the shortening magnitudes. In order to understand how deformation is accommodated along this lateral plate boundary, adequate estimations on shortening are essential. Furthermore, constraining the deformation style is fundamentally important for the exploration of resources, as seismic interpreters usually use template structural models to interpret in areas of poor seismic image resolution.
In this study we use observations from surface geology (fieldwork, Google Earth) and subsurface data (recent 2-D seismic surveys and well data) to constrain the structural style and kinematics of the central Kirthar Fold Belt.
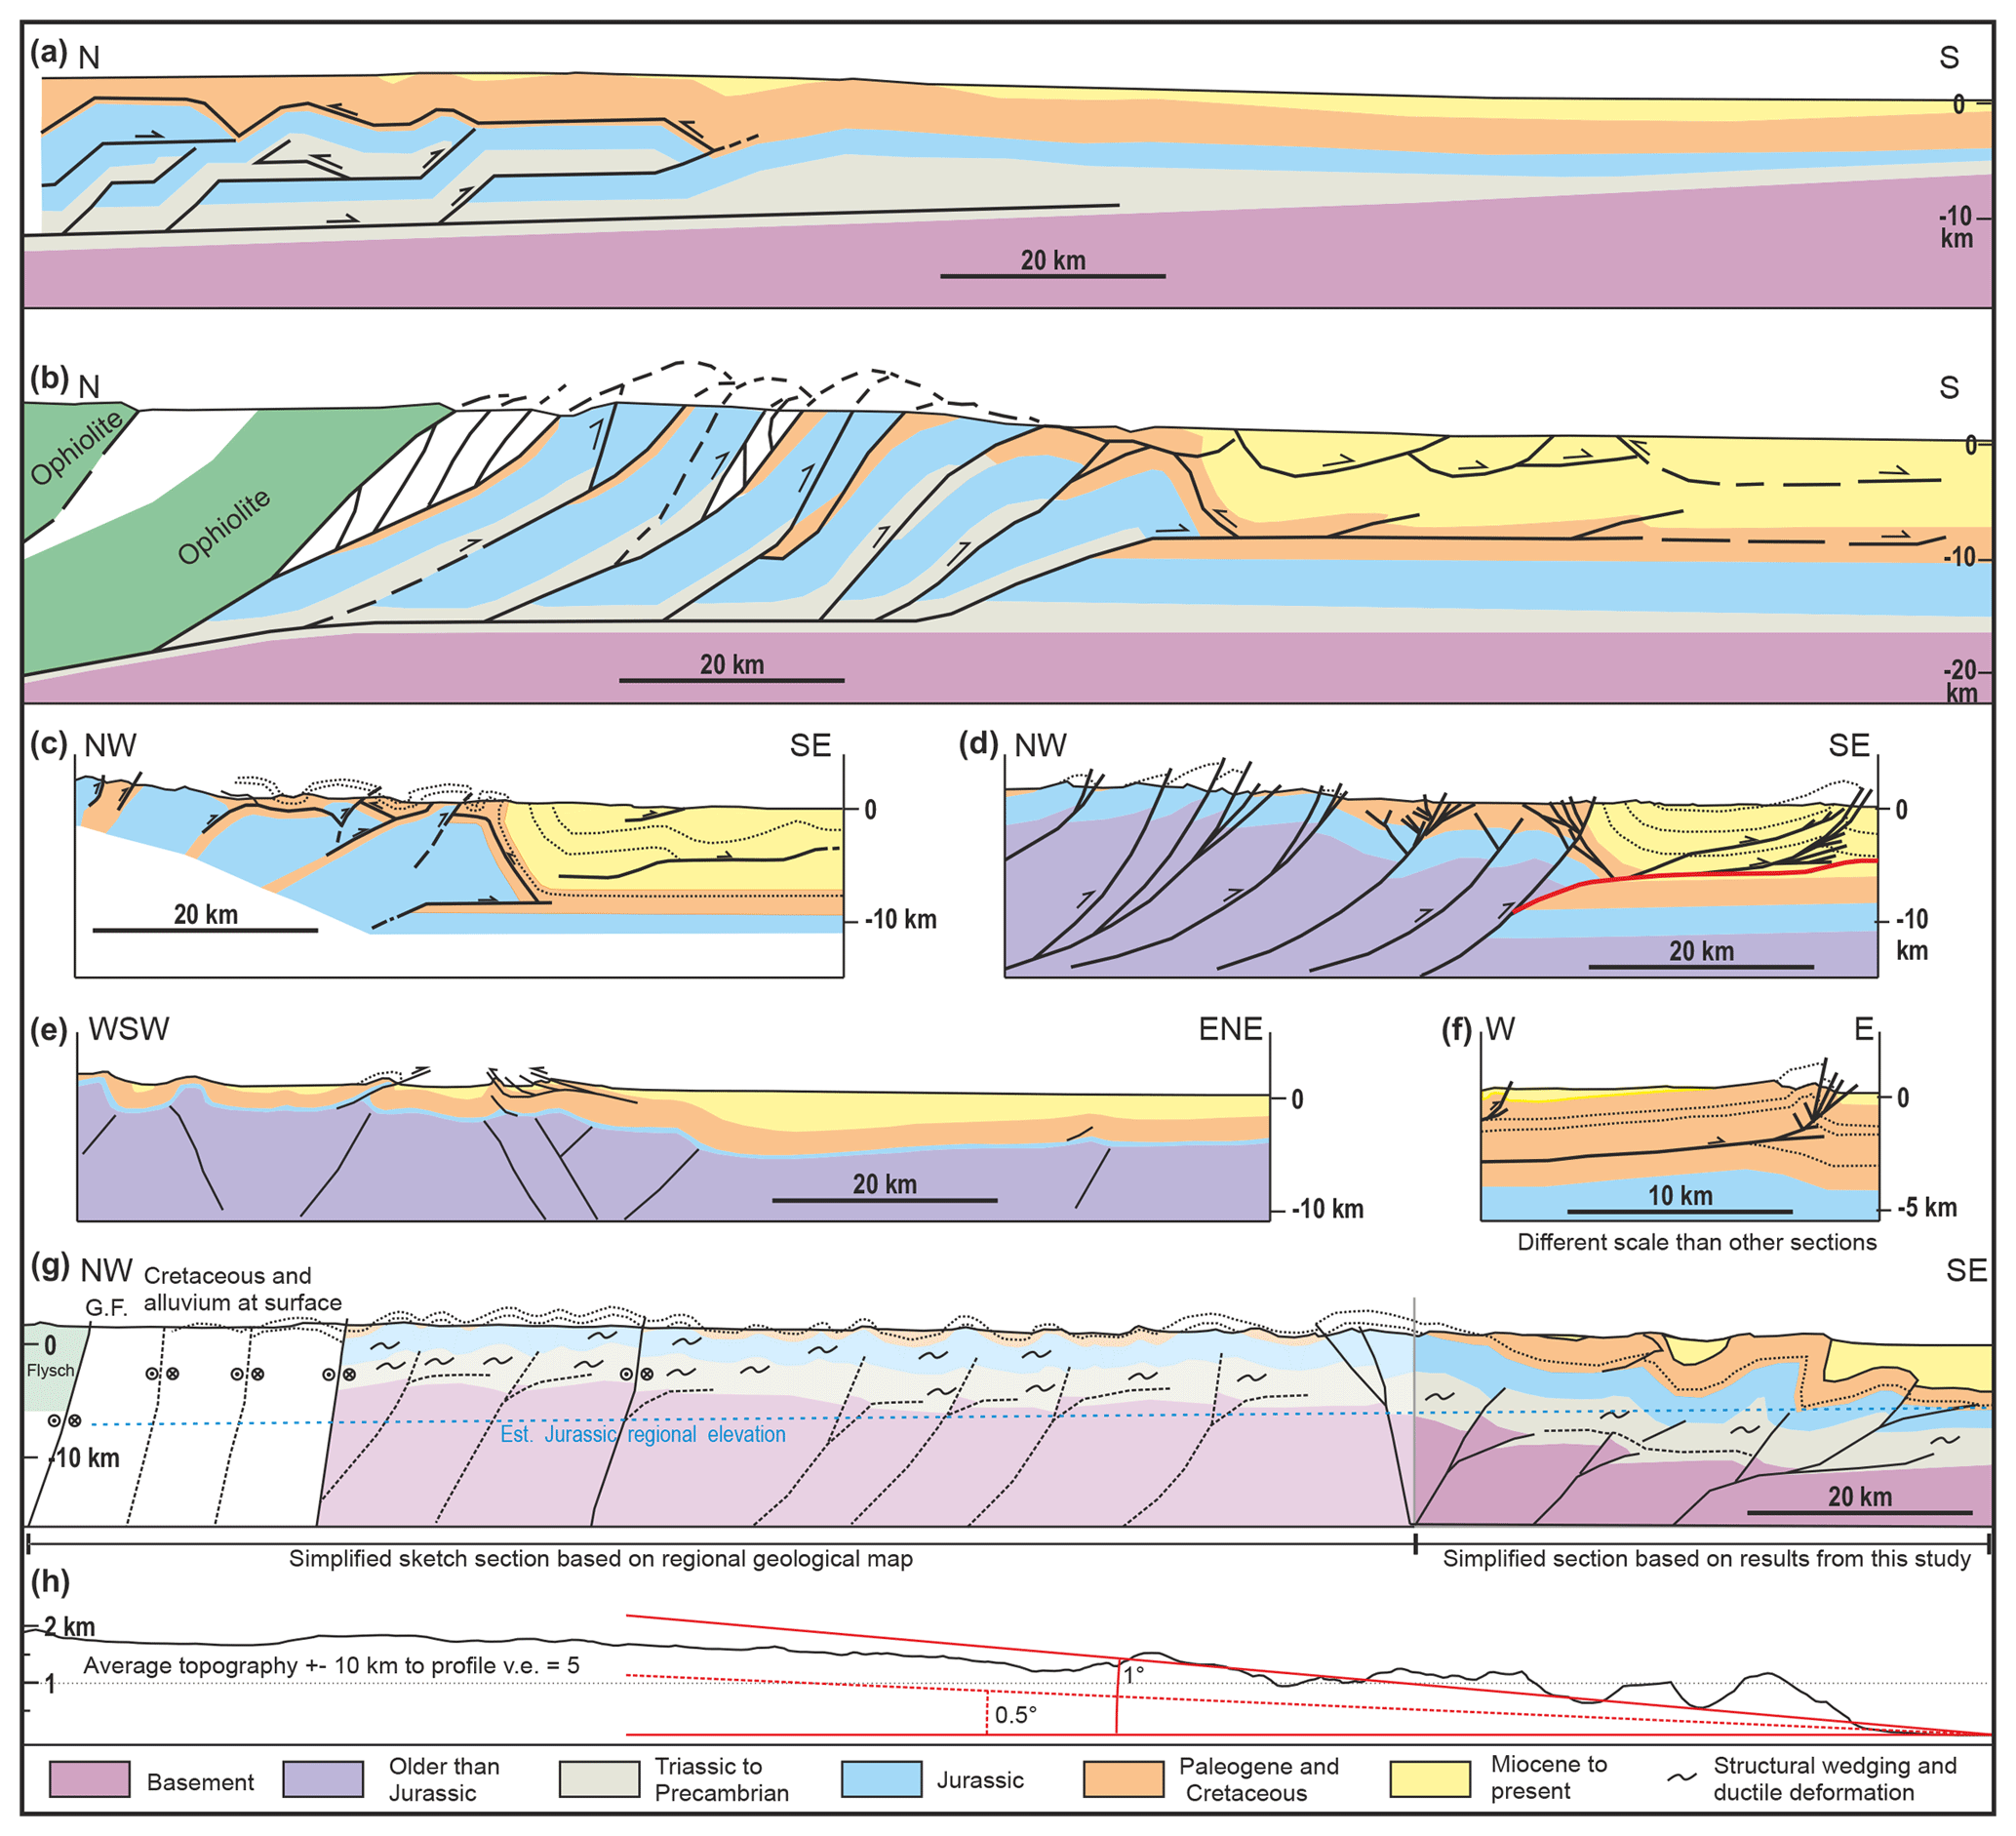
Figure 2Selected sections in the southern western fold belt of Pakistan (for section locations see Figs. 1, 3). (a) After Jadoon et al. (1992), (b, c) after Banks and Warburton (1986), (d) after Szeliga et al. (2009); red line indicates the approximate shape of the fault considered responsible for the 1931 Mach event. (e) After Fowler et al. (2004), (f) after Schelling (1999), (g) this study; the frontal part (strong colours) is a slightly projected section elaborated for the northern sector of this study area. The western part is a tentative regional sketch section based on the geological map of Bannert et al. (1992), as shown in Fig. 3. G.F.: Ghazeraband fault. (h) Average topography of a 20 km wide section centred on the trace of (g) with 5 times vertical exaggeration.
We use seismic interpretation, section analysis techniques, kinematic forward modelling and regional constraints to narrow structural solutions and develop a most likely structural model. Based on the resulting balanced cross sections through the area, we conclude that the central Kirthar Fold Belt is driven by thick-skinned inversion linked with thin-skinned deformation further toward the foreland. The thin-skinned deformation pattern is dominated by folding with no major thrusts cutting through these structures. The key controlling parameters for the deformation in this area are the pre-existing structures and the mechanical stratigraphy, which is itself a result of the paleo-evolution.
2.1 Structural setting
The wider Kirthar Range area is situated on the lateral plate boundary of India. The India–Pakistan plate is moving in a northward direction relative to Eurasia (Mohadjer et al., 2010, Fig. 1), placing the margin in an overall setting of left-lateral transpression. The Chaman Fault, a large-scale strike-slip fault, is considered to represent the lithospheric plate boundary (transform fault) in this lateral collision zone (Lawrence et al., 1981; Bannert et al., 1992). East of the plate boundary, a 150–200 km wide deformation zone is present (Bannert et al., 1992; Szeliga et al., 2009; Figs. 1, 2). Strain partitioning is active (see Szeliga et al., 2009, and references therein), documented by the presence of strike-slip faults as well as folds and thrusts (Fig. 1). This deformation is also reflected in the distribution of seismically active faults, which show strike-slip deformation mainly towards the hinterland and dip-slip reverse faults close to the deformation front (Fig. 3; see also Reynolds et al., 2015).
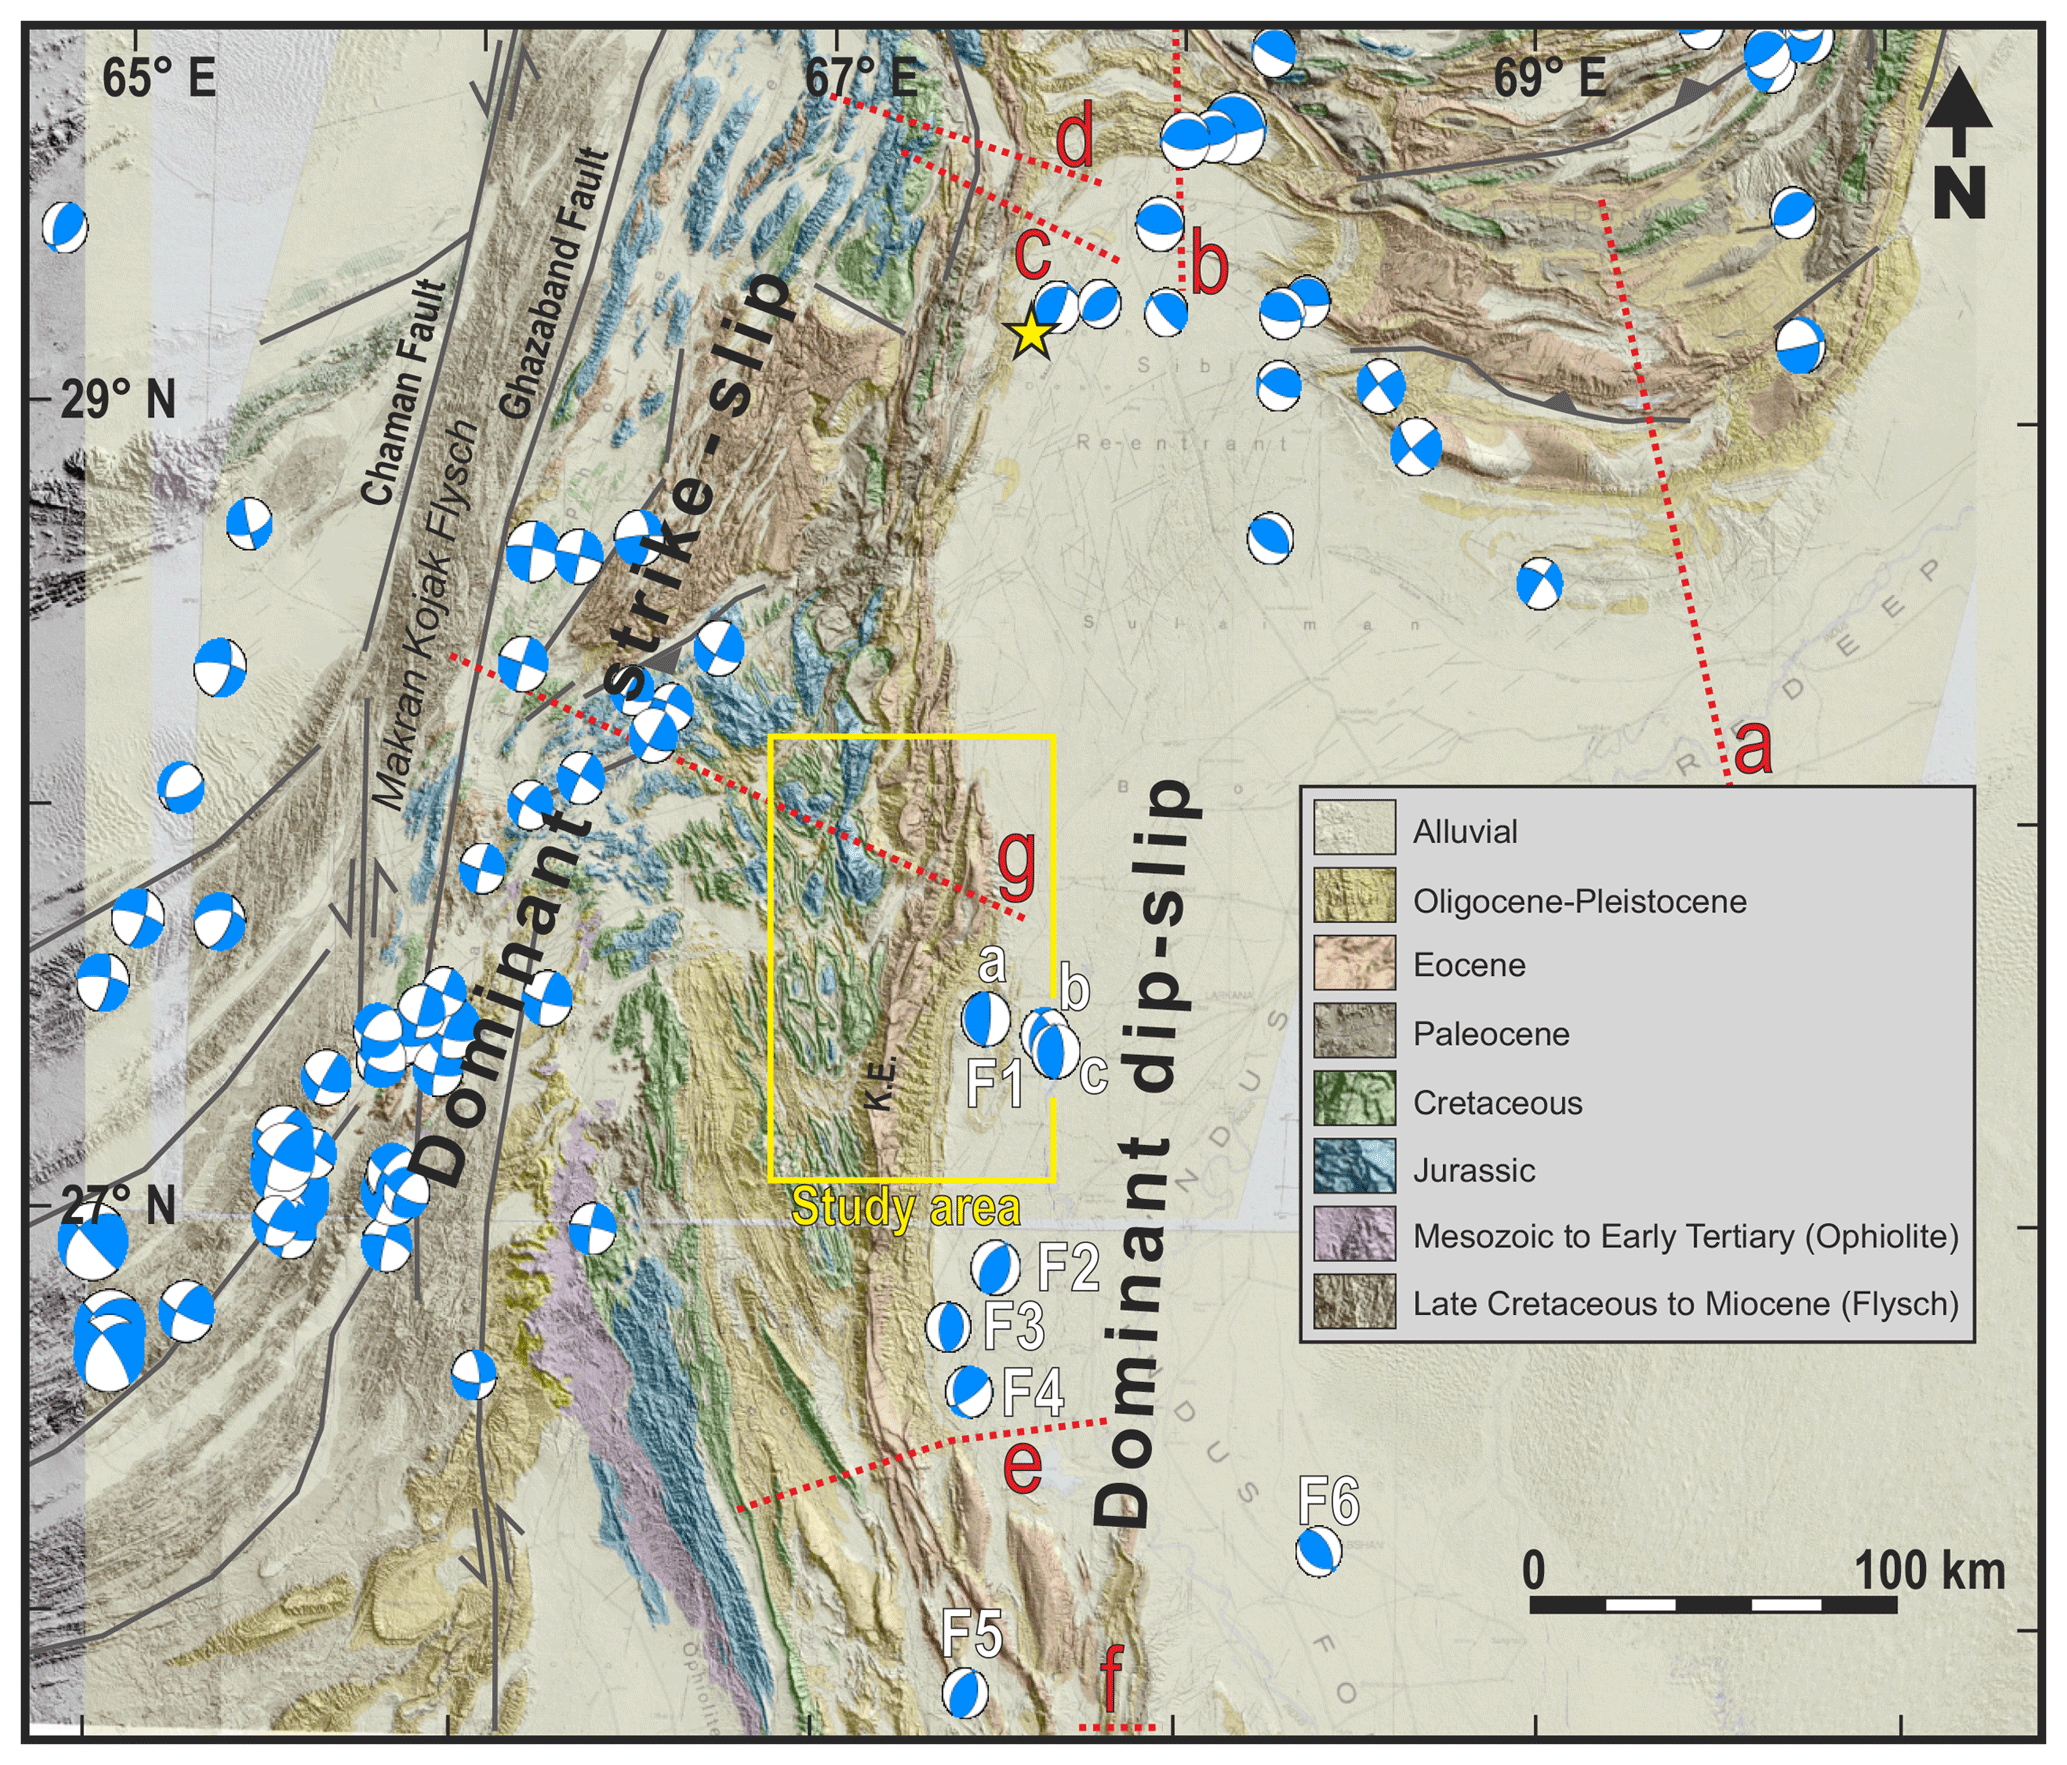
Figure 3Nodal planes from the International Seismological Centre (2015) database, DEM with draped geological map after Bannert et al. (1992) and selected structural elements. Location of the figure is indicated in Fig. 1. Dotted red lines are locations of sections in Fig. 2. Labelled events are listed in Table 1. Yellow star marks the 1931 Mach event after Szeliga et al. (2009). K.E.: Kirthar Escarpment.
Most publications on the structural style of the Sulaiman and Kirthar ranges describe these to be thin-skinned fold–thrust belts. Initially, a passive roof duplex style of deformation was attributed to these fold belts (Banks and Warburton, 1986; Jadoon et al., 1992; Fig. 2a–c). The associated percentage of shortening accommodated by such a thrust- and duplex-dominated deformation was valued to be of the order of 37 %, estimated for a section through the Sulaiman Lobe (Jadoon et al., 1992). Jadoon et al. (1992) propose the same structural style for the northern Kirthar Belt. For the frontal part of the southern Kirthar Fold Belt, thin-skinned fold–thrust styles have been constructed based on fieldwork (Schelling, 1999; Fig. 2f; see approximate location in Fig. 1). In contrast, Smewing et al. (2002a) infer, based on fieldwork, that the southern Kirthar Fold Belt is dominated by the inversion of Jurassic normal faults. Also based on fieldwork and seismic interpretations, Fowler et al. (2004)model the southern Kirthar Fold Belt as inversion deformation. Their sections show shortening on detachment horizons in the sedimentary cover, but the kinematic link between the shortening in the basement and in the cover remains conceptual and partly unclear (Fig. 2e).
2.2 Tectonostratigraphic evolution
The known stratigraphic section in the study area spans from the Triassic to recent times (from outcrop and wells; Fig. 4); however, older sediments are known along the western margin of the Indian Plate. During the late Precambrian and early Paleozoic, the Indo-Pakistan plate was part of Gondwana, a situation that persisted until the onset of Triassic to Jurassic rifting (Smith, 2012; Scotese, 2016; see the Jurassic time step in Fig. 5a). Northern Pakistan was positioned at the northern margin of Gondwana facing the Paleo-Tethyan Ocean. Salt deposits formed along the Gondwana margin in sub-basins, which are present and observable in the Zagros Hormuz Salt and the Salt Range Formation of northern Pakistan (Kadri, 1995; Smith, 2012). It remains unknown whether deposits (with or without salt) from this period are present in the subsurface of the study area. Further north in Pakistan, Cambrian sediments are overlain unconformably by Permian strata, and it is not certain whether or not the intervening systems were deposited and later eroded (Kadri, 1995). During the late Permian, the Paleo-Tethys was at its widest, indicating ongoing drifting in the ocean. The passive margin of northern Pakistan was tectonically quiescent with shallow marine to paralic conditions prevailing up to the Late Triassic (Kadri, 1995). The break-up of Gondwana, which formed the Indian and the Afghanistan–Arabia–Africa plates, developed in Triassic and Jurassic times (see Jurassic time step, Fig. 5a); however, the exact timing for rifting in the vicinity of the study area seems uncertain.

Figure 4Lithostratigraphic overview with mechanical stratigraphic interpretations (after Kadri, 1995; Tectostrat, unpublished, 2001; Smewing et al., 2002b; and author observations). S.H.: seismic horizons used in this study.
Kadri (1995) reports that from the Middle Triassic onwards the sedimentation on both sides of the Paleo-Tethys suture is different. In general the Triassic mixed successions of shallow marine clastics and carbonates are grouped in the Alozai Group or Wulgai Formation (Kadri, 1995). Continued rifting is interpreted for the Lower Jurassic deepwater Shirinab Formation (which can be separated into three members: Springwar, Loralai and Anjira; see Fig. 4). Smewing et al. (2002a) find evidence for Early Jurassic normal faulting due to syn-kinematic debris flows and slumping in the Lower Jurassic Shirinab Formation. Smewing et al. (2002b) placed the rift in the Kirthar area in the Early to Late Jurassic time (Fig. 5a), mainly marked by the successive drowning of the Springwar sandstones and mudstone cycles followed by the pelagic Loralai and Anjira members, as well as the limestones of the Chiltan Formation. The pelagic Anjira limestones are replaced eastward with the thickly bedded limestones of the Chiltan Formation. East of the Kirthar Escarpment, the pelagic Anjira limestones are not known from wells in the study area. We interpret the deep water–shallow water relationship of the Anjira–Chiltan limestones as an expression of a hinge zone related to differential post-rift subsidence. The unconformity on top of the Chiltan limestones is interpreted as break-up unconformity (Smewing et al., 2002b). Wandrey et al. (2004) consider Jurassic or earlier extensional tectonics and failed rifting along the Indus River to contribute to buried horst-and-graben structures and the division of the greater Indus Basin into three sub-basins. The top of the Jurassic strata is marked by a basin wide unconformity (Wandrey et al., 2004; Smewing et al., 2002b). The slightly contradicting reported times for Triassic–Jurassic rifting could either be the result of several pulses of rifting related to the break-up of Gondwana or an interpretational uncertainty.
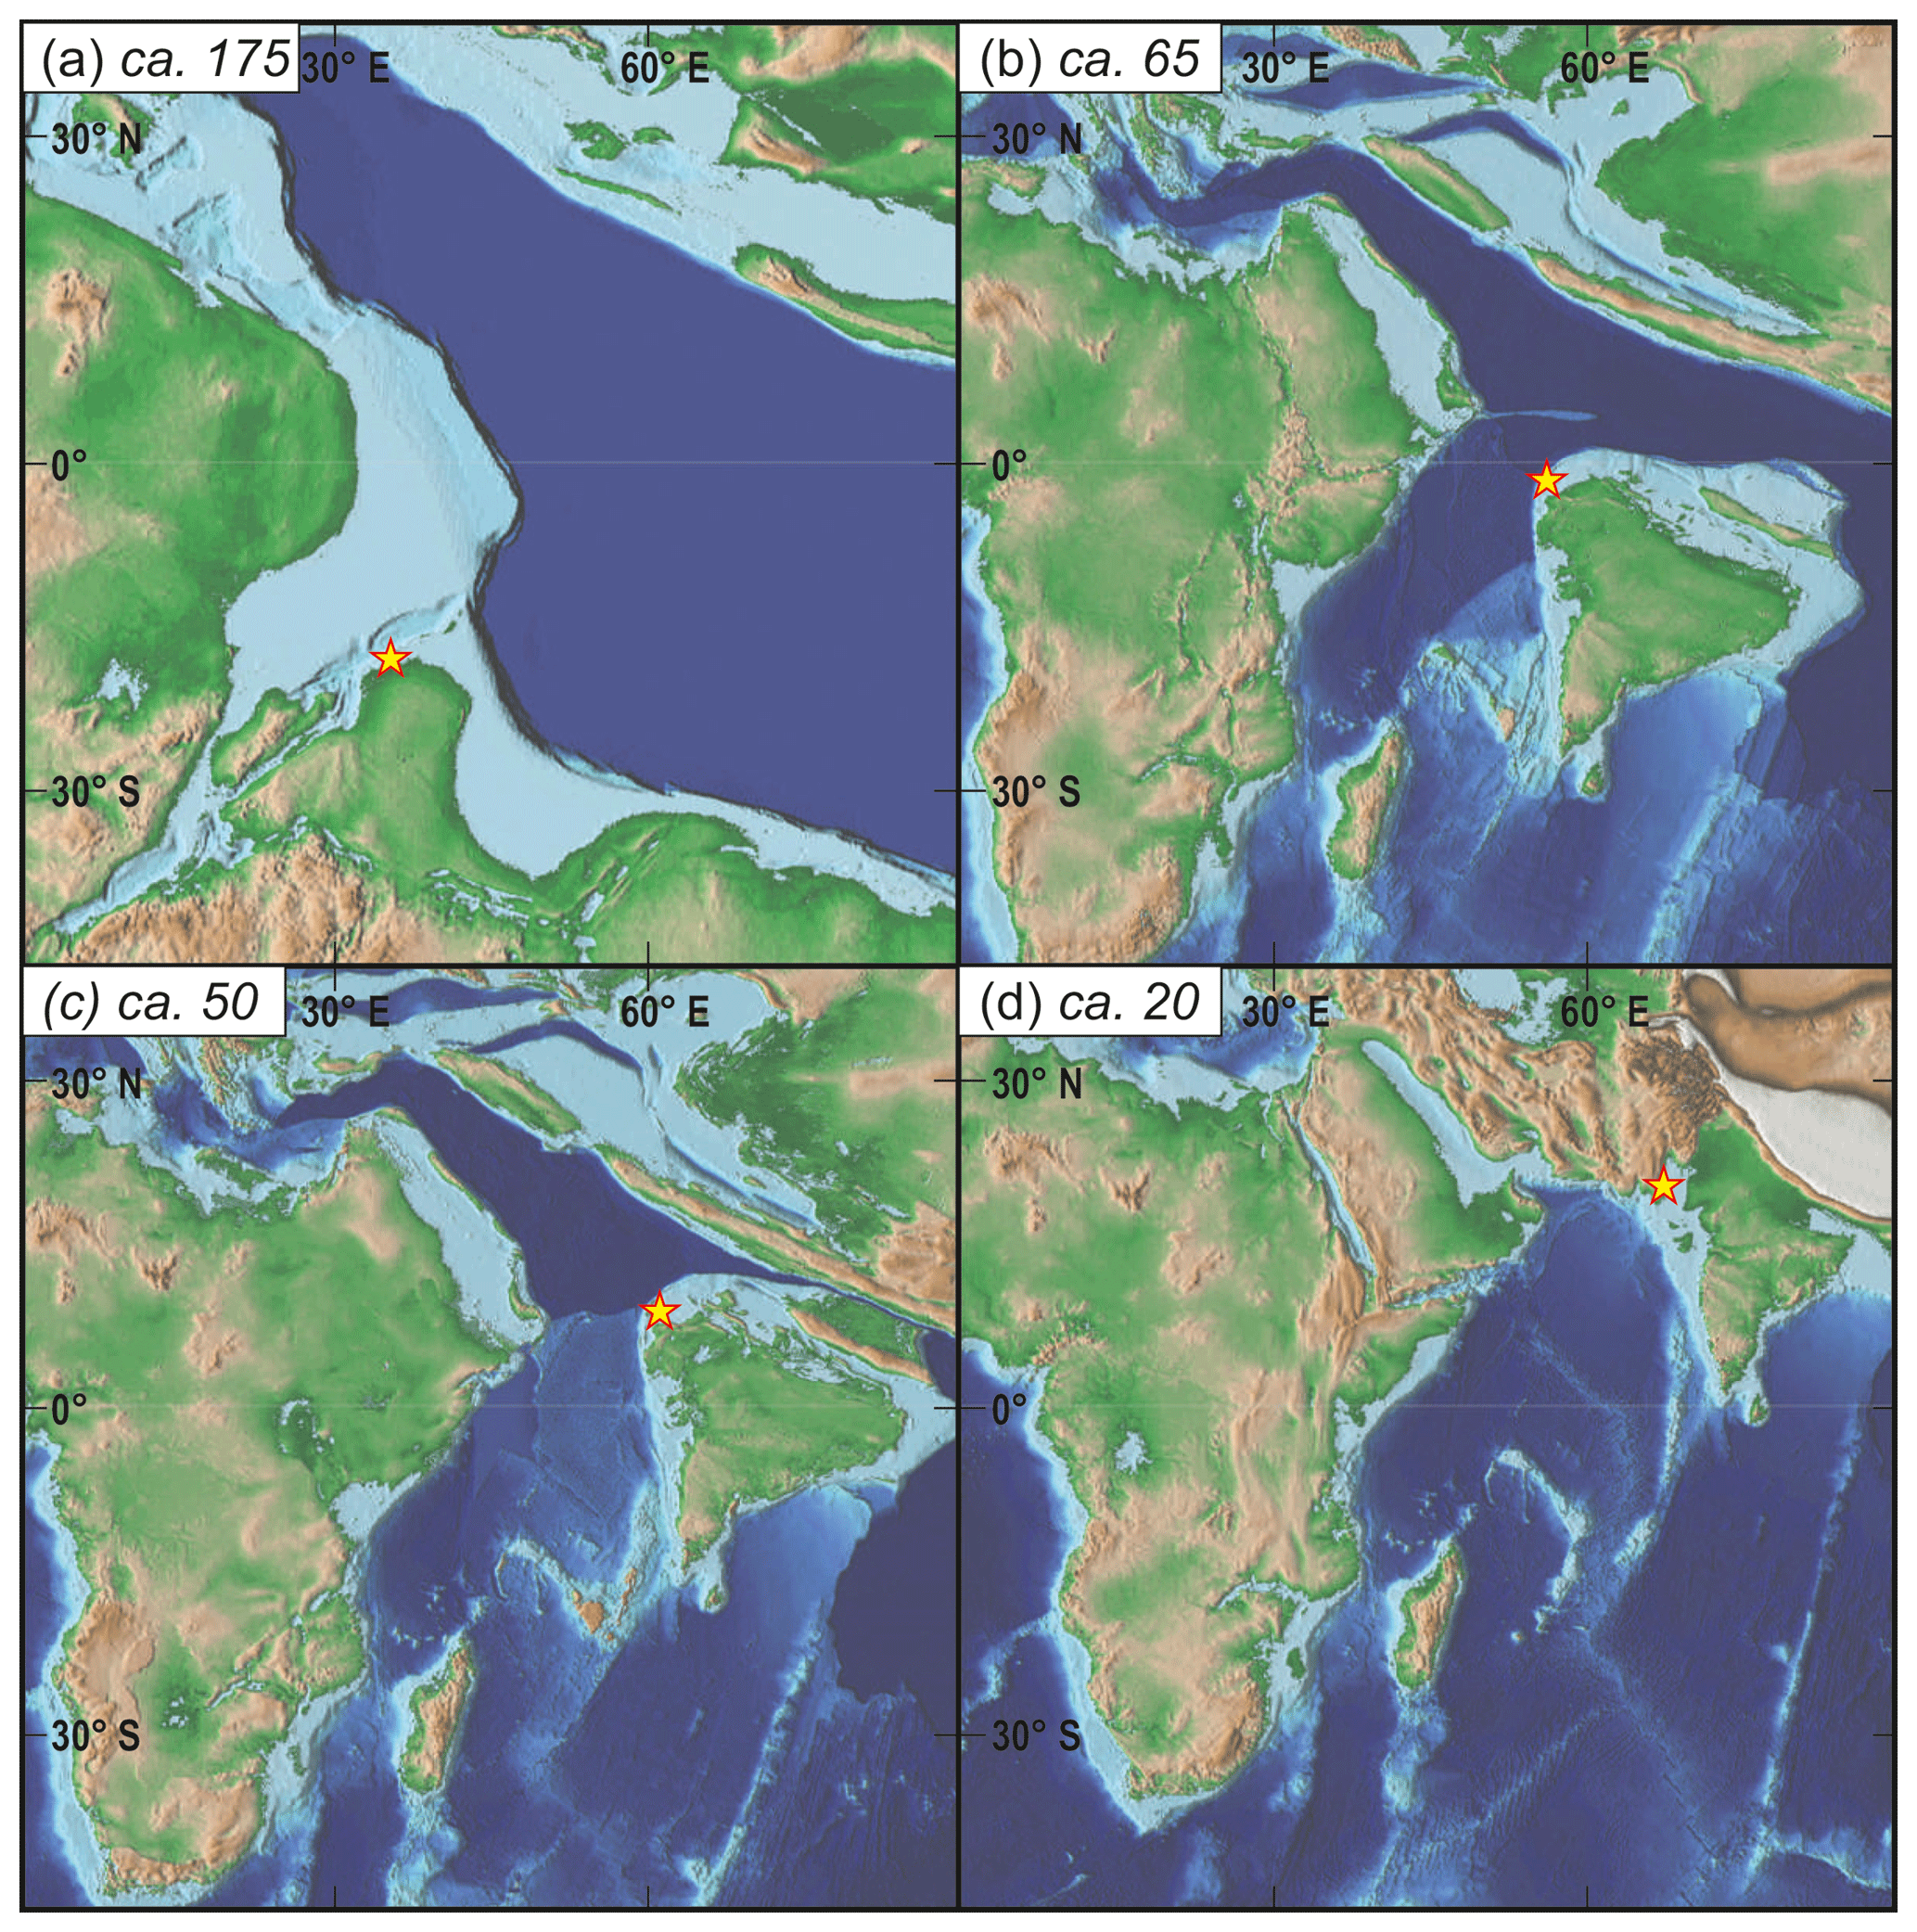
Figure 5Paleogeographic evolution of the study area as part of the Indian Plate since the Jurassic. (a) Jurassic, ca. 175 million years; a rift evolves northwest of the approximate study area location (star; map from Scotese, 2014a). (b) At ca. 65 million years, Cretaceous–Paleocene, drifting northward. A strip of emergent land (likely an intra-oceanic arc) is visible north of the approximate study area location (map from Scotese, 2014b). (c) At ca. 50 million years, Eocene, post-ophiolite obduction, but pre-collision with Eurasia (map from Scotese, 2014c). (d) At ca. 20 million years, Miocene, early collision stage with flexural foreland stage (map from Scotese, 2014c).All background images (a)–(d) copyright by the PALEOMAP Project/Christoopher R. Scotese.
The Cretaceous sediments are interpreted to have been deposited on a westward-sloping Indian shield (Kadri, 1995) in the drift phase (see Fig. 5b). Large deltas prograded from the emergent Indian continent, depositing the shaly to sandy Sembar and Goru formations in the middle Indus Basin (MIB) and shedding turbidites into the Kirthar Fold Belt area (Fowler et al., 2004). Portions of the Indian shield were uplifted during the Cretaceous, which is partly related to the plate passing over an active mantle hotspot (Eschard et al., 2004); this generated unconformities towards the interior of the continent. The Cretaceous strata thin strongly towards the Jakobad High, which is an intra-basinal high in the Indus Basin (Kadri, 1995) northeast of our study area. The internal structuration of the Indus Basin is interpreted as relicts of a failed rift (Zaigham and Mallick, 2000; Wandrey et al., 2004). Mixed clastic and carbonate deposits represent the Upper Cretaceous succession, consisting of the Parh, Mughal Kot and Pab Formation (Fig. 4). Island arc collision and ophiolite obduction occurred on the northwestern margin of the Indian Plate during the Paleocene (Khan et al., 2009). The Muslim Bagh and Bela ophiolites were obducted onto the Indian margin (an island arc is anticipated northwest of the drifting Indian Plate in Fig. 5b). Obduction of these ophiolites onto the Indian continental margin in western Pakistan is stratigraphically constrained between the late Maastrichtian and early Eocene (between ca. 67 and ca. 50 Ma; Khan et al., 2009, and references herein). Likely as a result of this obduction, the shelf basin deepened and received more clastic influx. Local inversion movements are considered to be responsible for the presence of erosional unconformities. Subsequent quiescent phases are represented by widespread carbonate depositions (e.g. Dungan Formation; Fig. 4). The northwest corner of the Indian Plate started to collide with Eurasia during the Eocene (Fig. 5c). The remaining segment of the Tethys Ocean narrowed further and eventually completely closed. In the study area this phase is represented by, on one side, carbonate deposits on the shelf edge (Laki Formation, Sui Main limestone; Fig. 4) and, on the other, a westward rapidly deepening basin filled partly with shales and siliciclastic deposits shed from the N-NW (Ghazij Formation; Wandrey et al., 2004; Ahmad et al., 2012). For the study area Ahmad et al. (2012) observe a dramatic east-to-west thickness increase in the Ghazij Formation from thin layers of shale (in a well on the frontal anticline) to about 1000 m thickness (outcrop section) in the area west of the Kirthar Escarpment within less than 40 km of distance. A final and short switch back to slightly more quiet conditions is indicated by the deposition of the Kirthar Formation (limestones with intercalated shales). During the Oligocene and lower to middle Miocene, the Indian Ocean coastline gradually migrated southward in the foreland basin and marine conditions were progressively replaced by continental conditions (Fig. 5d). Marine conditions prevailed in the study area until early–middle Miocene times and are represented by shallow marine carbonates, clastics and shales of the Oligocene Nari Formation and the mid-Miocene Gaj Formation (Fig. 4). In the late Miocene to Pliocene the collision between India and Eurasia resulted in the uplift of the main Himalaya and enormous quantities of clastic material reached the lower Indus Basin (i.e. Siwaliks Group; Fig. 4). During this time, transpressive deformation along the western plate margin propagates onto the lower Indus Basin. Recent ongoing deformation in the study area and regional uplift lead to erosion rather than deposition. Sediments along the Indus are bypassing the foreland into the Indian Ocean.
2.3 Mechanical stratigraphy
The behaviour of the sedimentary column when deformed is defined by its mechanical stratigraphy, which itself is the result of the tectonostratigraphic evolution. The formations deposited on the shelf margin during the drift phase are located in our study area. The presence of a long-lived hinge zone in the study area results in an E–W proximal–distal sedimentological relationship of having successively more incompetent layers present towards the west. Several detachment horizons can be interpreted in the stratigraphic succession (Fig. 4, right column). A colour code indicates if a certain level is interpreted as detachment based on field or seismic observations and/or modelling.
The core study area covers the area east of the Kirthar Escarpment (a morphological cliff at the western limit of exposed Kirthar limestones; Fig. 6), where seismic data are available. There, only Cenozoic rocks are outcropping and were partly investigated by fieldwork. The area west of the Kirthar Escarpment, where older rocks crop out, was not accessible due to security reasons. Therefore, the western area was investigated by remote methods: observations in Google Earth and remote assessment of bedding attitude data.
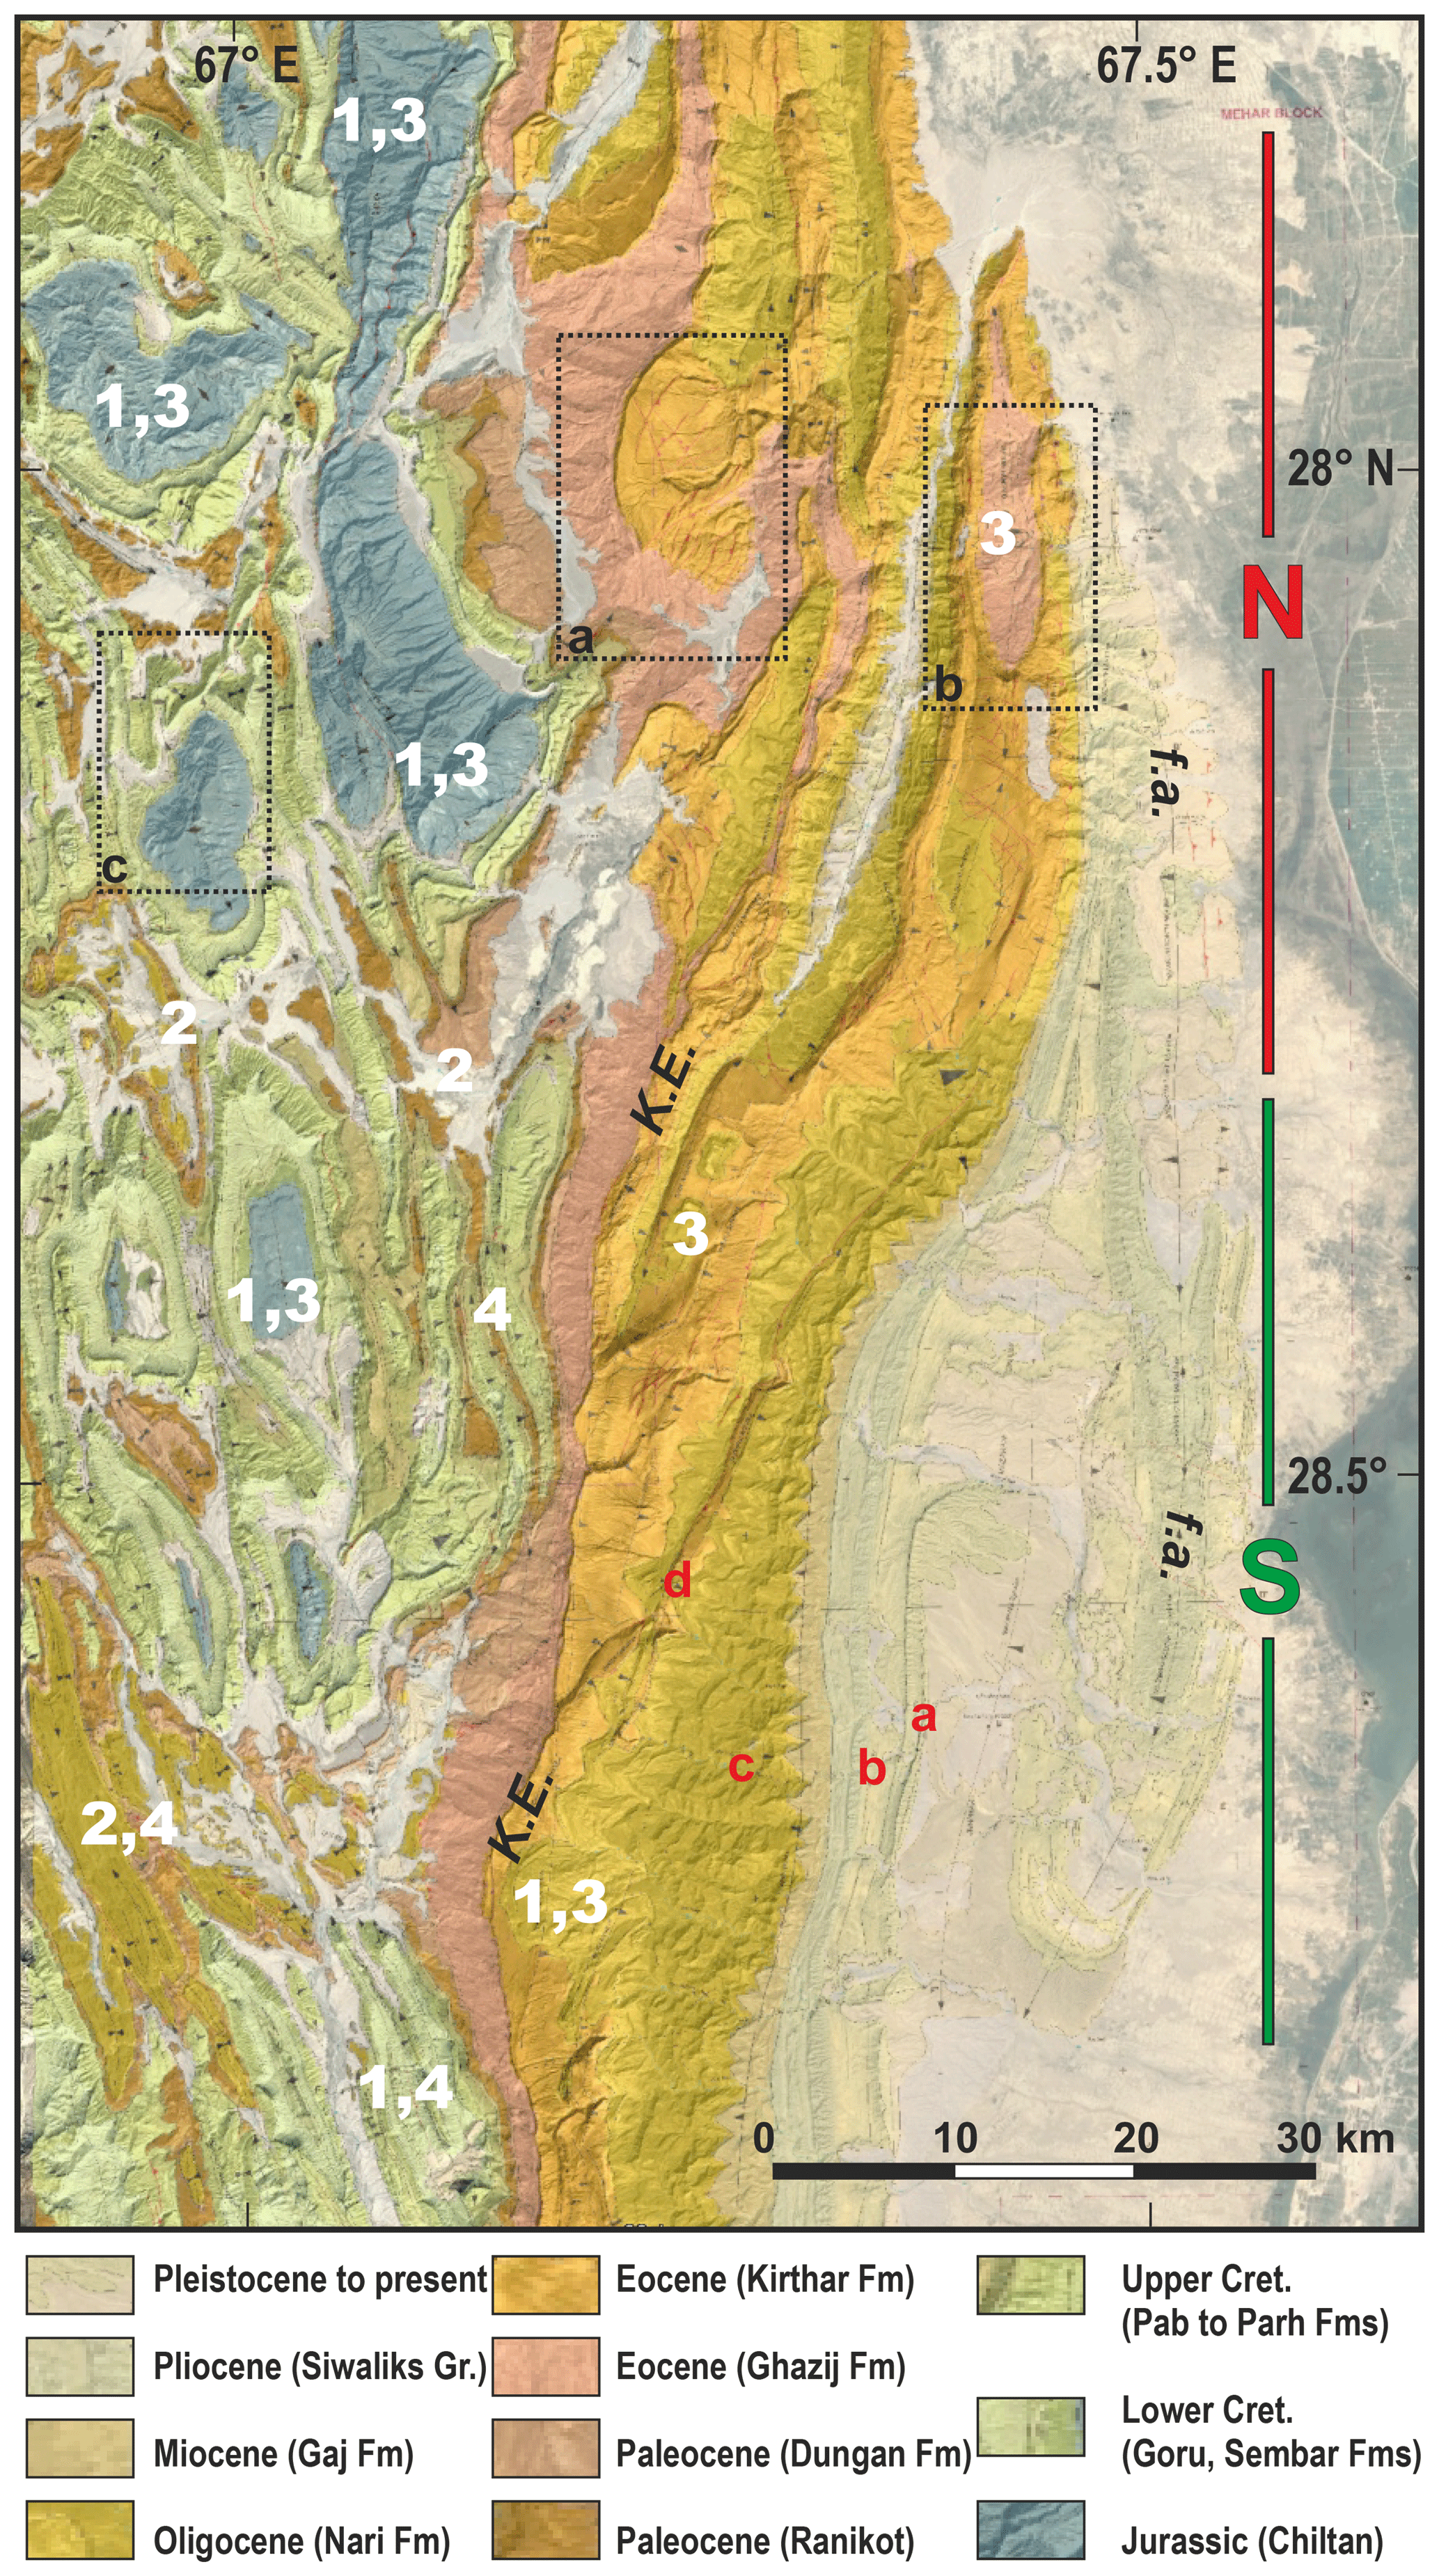
Figure 6Semi-transparent lithostratigraphic map (modified after Tectostrat, unpublished, 2001) of the study area draped in Google Earth. Dotted rectangles with labels a, b, c indicate approximate areas seen in slanted view in Fig. 7a–c. Red labels in (a–d) indicate locations of field photographs in Fig. 8. Northern and southern sectors of the fold belt are indicated by bold red and green lines, respectively. Bold white numbers indicate examples for 1: structural highs, 2: structural lows, 3: long-wavelength anticline, and 4: short-wavelength folding. K.E: Kirthar Escarpment, f.a.: frontal anticline.
3.1 Remote fieldwork using Google Earth
Google Earth was utilized to investigate structures in the study area on a broad and detailed scale. A quality check of the data from Google Earth revealed that images from 2010–2014 fit best to the digital elevation model (DEM) (fewer draping effects and least offset from the DEM).
Figure 7 shows several examples from the virtual fieldwork with a few important observations on the deformation and mechanical stratigraphy for the study area. The strong mechanical contrast between the Eocene Kirthar limestones and the Eocene Ghazij shales is demonstrated by young gravity bookshelf faulting along an escarpment (Fig. 7a). This young, ongoing deformation is a gravitationally triggered mass movement that is a result of the competency contrast and rapid erosion of the soft shales. These shales reach several hundred metres of thickness east of the Kirthar Escarpment. Similarly, but a bit more challenging to observe, is the gravity sliding on the large anticline in the northern part of the study area (Fig. 7b). There, slabs of Kirthar limestones (forming part of the roof of the anticline) have collapsed across the partly eroded forelimb. As a consequence, sub-horizontal Kirthar limestone beds are superposed over the steep to partly overturned younger beds of the forelimb. Similar features have been observed in numerous examples in the Zagros in Iran (Harrison and Falcon 1934, 1936). A potential sequence of the landslide evolution after the mechanism suggested by Harrison and Falcon (1934, 1936) is shown in Supplement Fig. S1 along with an alternative solution. One of the main requirements for the landslide solution is the presence of a thick weak layer underneath the Kirthar limestone that can act as a décollement. Further to the south (towards the background in Fig. 7b) the Kirthar beds represent the hinge zone of the anticline. There, extensional faults are visible, including relay ramps and other associated features which also demonstrate the young gliding motion of the limestones on top of the soft Ghazij shales towards the east onto the eroded forelimb.
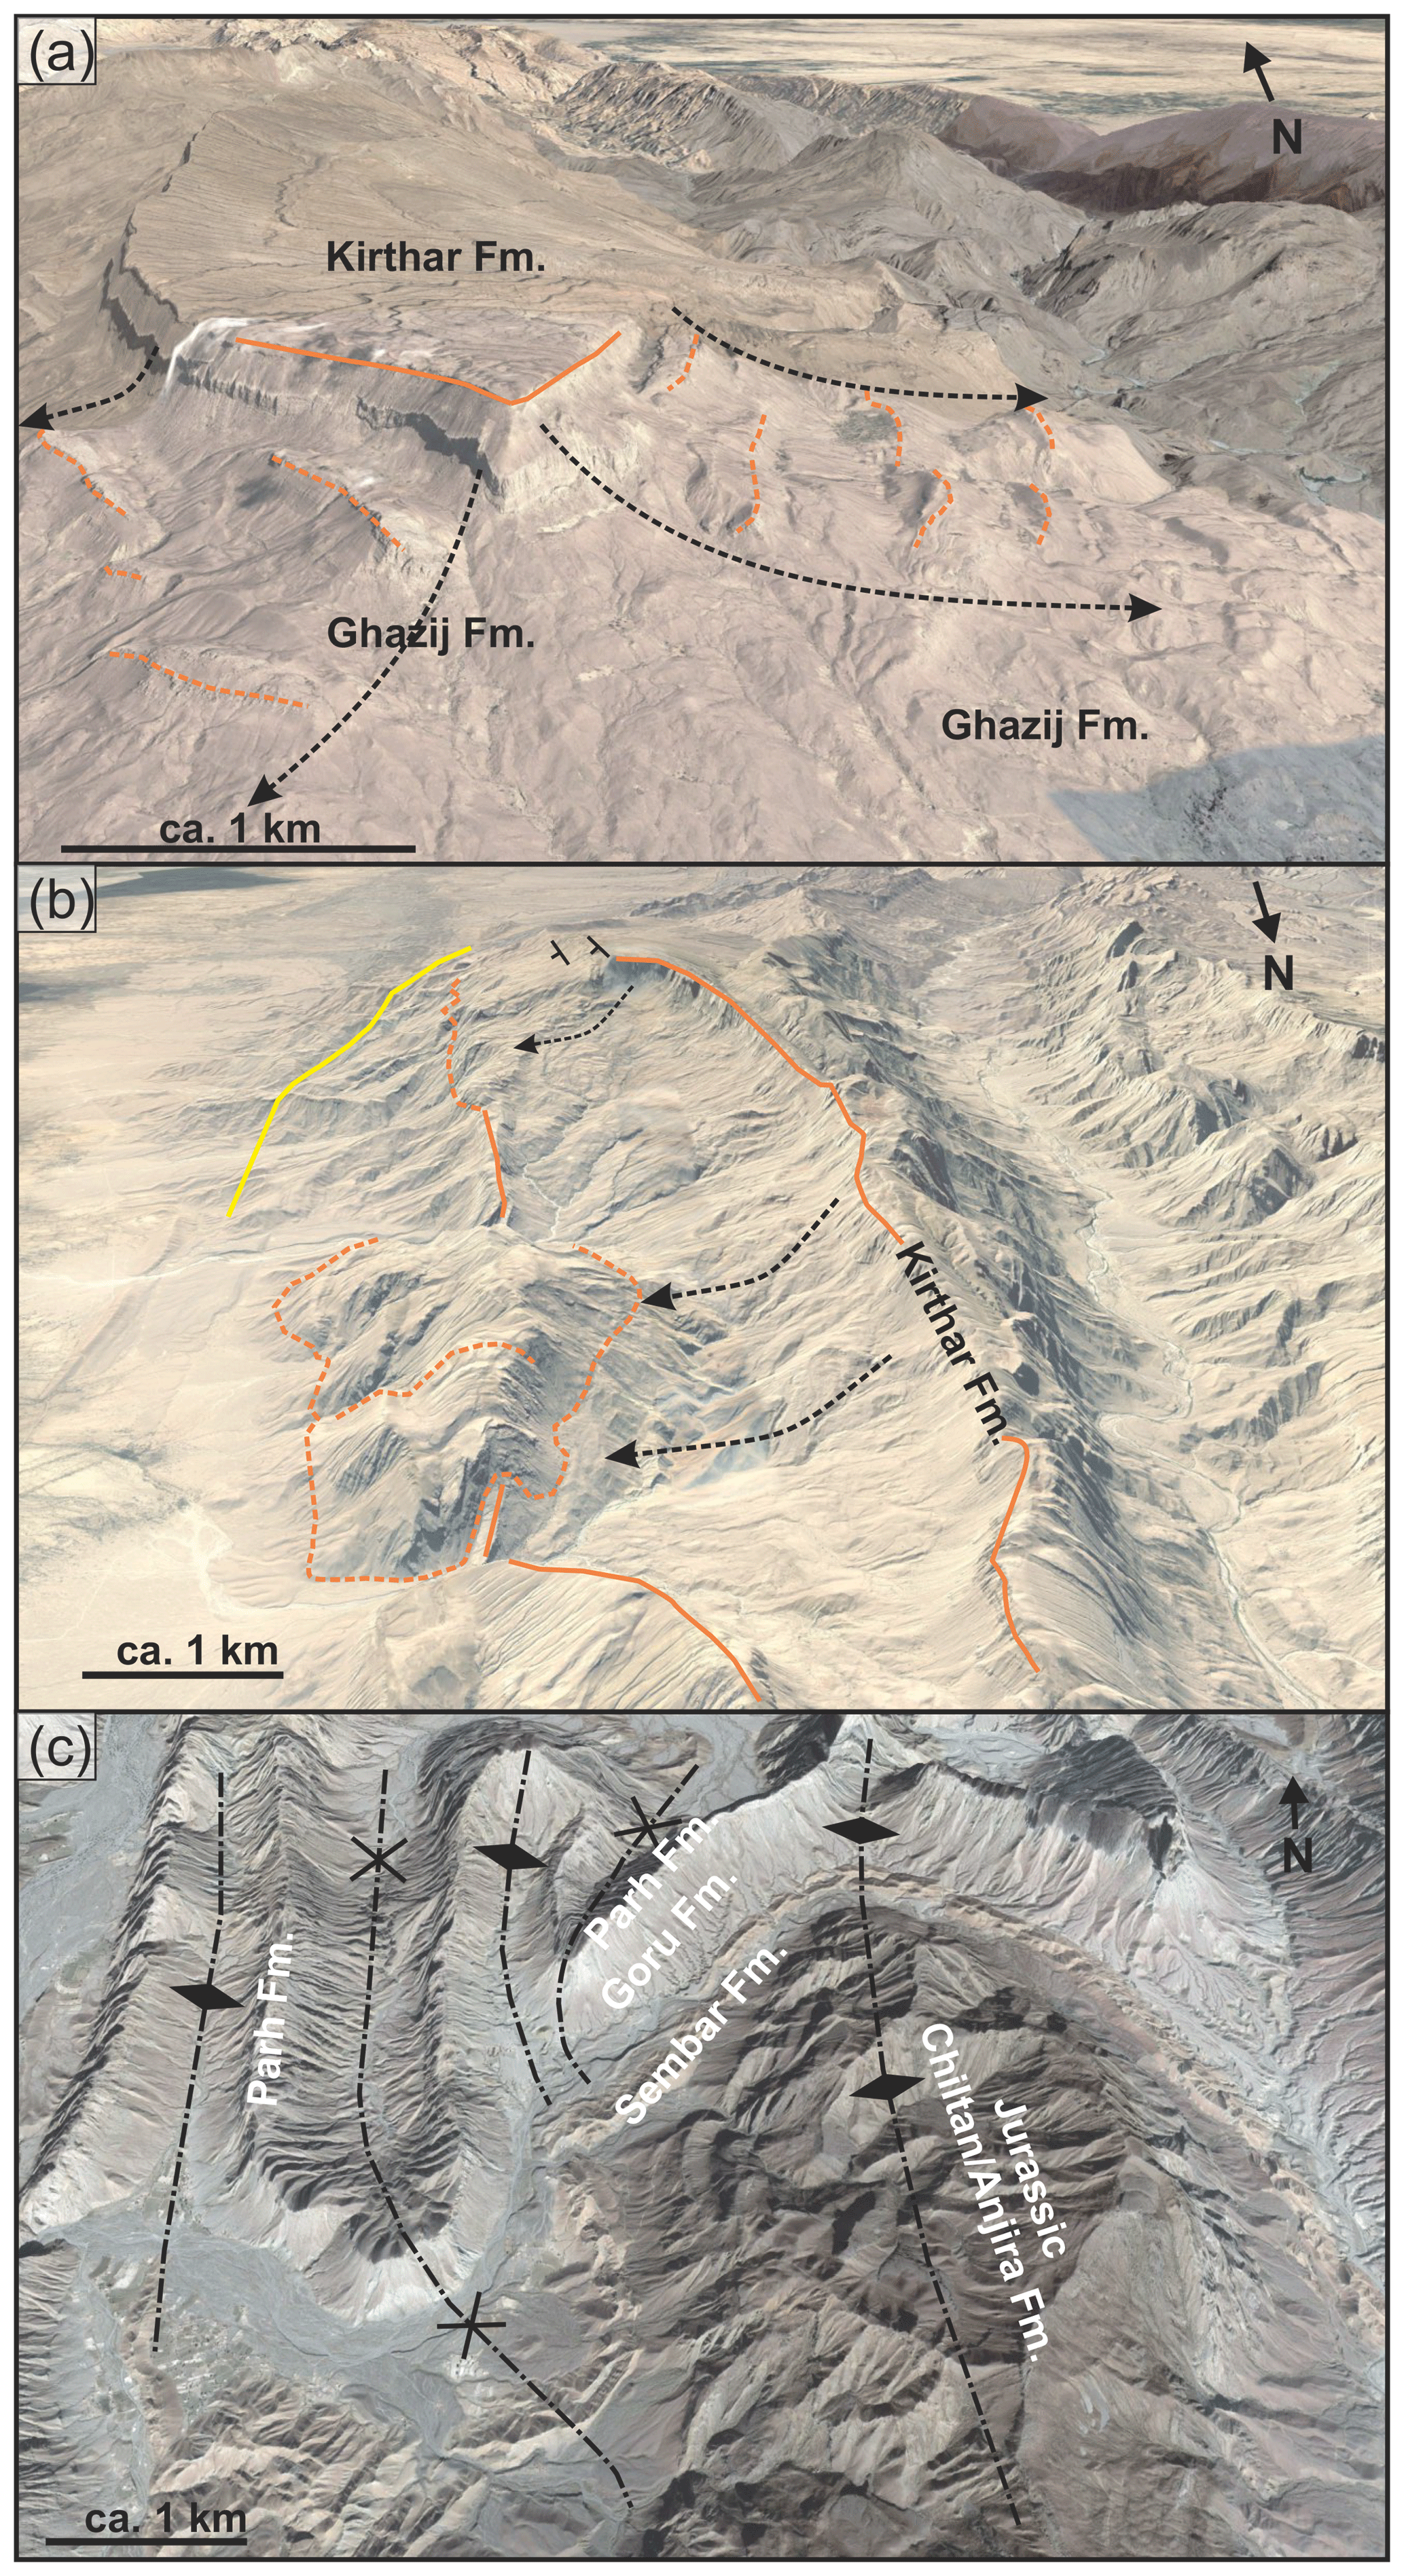
Figure 7Example for remote fieldwork with Google Earth. Locations of the views are indicated in Fig. 6. (a) Recent mass wasting: blocks of Kirthar limestones glide down the eroded flanks of soft Ghazij Formation; (b) sub-recent to recent mass wasting: a large slab of Kirthar limestones from the anticline roof is slumped over the forelimb of the anticline (see Fig. S1). In the background extensional faults are visible in the Kirthar limestones representing the roof of the anticline. The limestones partly glide over the vertical beds of the forelimb. (c) Disharmonic folding: Jurassic rocks show large-wavelength folding, while the hard limestones of the Cretaceous Parh Formation are folded in smaller wavelength and higher frequency. A weak décollement zone is located in the Goru shales.
One example of the deformation style west of the Kirthar Escarpment is shown in Fig. 7c. Jurassic limestones and younger strata are partly folded on different wavelengths (disharmonic folding). The large, dark, gentle anticline consists of Jurassic basinal limestones. Bright limestones on the ridges of the higher-frequency folds are from the Cretaceous Parh Formation. The required decoupling and ductile deformation between those layers is located in the Goru Formation, known to consist of soft shales.
Consequently, the observations indicate potential décollement horizons in the Ghazij and Goru Formation, as indicated in Fig. 4.
3.2 Remote fieldwork to assess bedding attitude data
In addition to the observations done in Google Earth, we used the “three-point method” to obtain additional measurements of bedding dip and strike. We used a high-resolution DEM and draped satellite images to calculate bedding dip and dip direction data from three digitized points that are located on a considered geological plane. The quality and level of detail that can be achieved is highly dependent on the quality and resolution of the input data and the outcrop conditions. We used a 30 m horizontal resolution SRTM DEM (Jarvis et al., 2008) and Landsat 7 images (Landsat 7 image courtesy of the U.S. Geological Survey). Measurements were only created in areas with univocal identification of large-scale bedding planes. A quality check of the generated data and comparison to locally existing field measurements show that bedding strike is generally very reliable, whereas the bedding dip results may partly be underestimated.
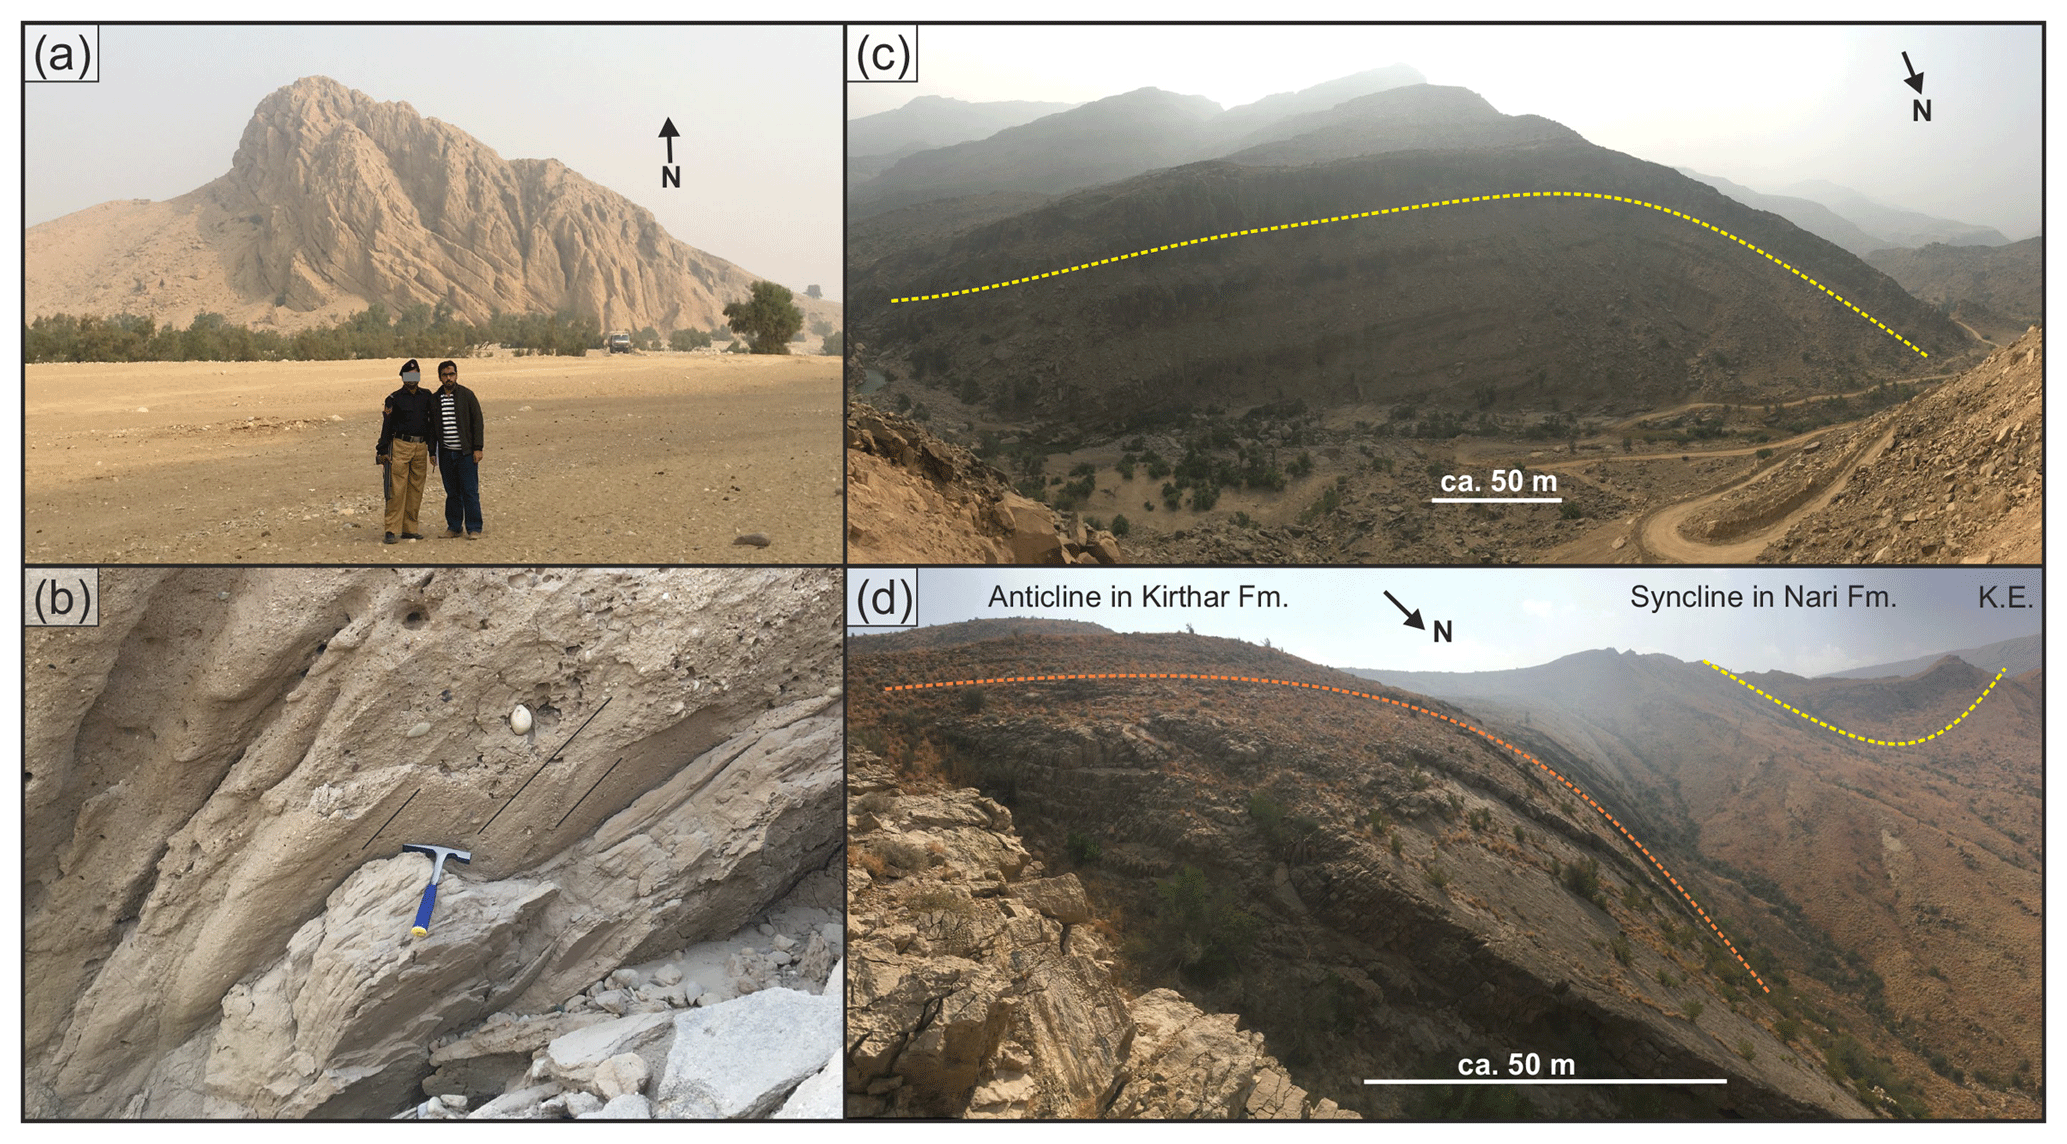
Figure 8Examples for observations from fieldwork. (a) Sub-recent conglomeratic sediments are folded and eroded. (b) Striations on a bedding plane in (Pleistocene?) conglomerates indicating flexural slip folding. (c) Small-scale anticline in Nari Formation rocks. The amplitude and wavelength of the fold suggest that the lower detachment horizon is likely in the lower Nari Formation. (d) Small- to medium-scale folding in the Kirthar and Nari Formation. The fold is a mappable feature (see Fig. 6) and indicates a detachment horizon below the Kirthar limestones.
3.3 Fieldwork
The fieldwork focused on collecting bedding dip data to supplement existing data and to partly quality-check the remotely assessed data. Furthermore, the style of deformation as observable at the field scale was investigated. Sub-recent sediments (Pleistocene to present) are tilted (Fig. 8a), being part of the large-scale fold–flexure in the southern sector (Fig. 6, point a). Changes in dip are primarily apparent due to the outcrop conditions under which recent outcrop degeneration was present, but small alterations of the dominant dip of the limbs of the large-scale structure have been observed, possibly a result of internal thickening within the formation caused by space problems in the inner part of the folds. The necessary flexural slip has been documented even in the very young, likely Pleistocene sediments. Figure 8b shows striations on bedding planes in sandy beds of a tilted sandstone–conglomerate succession (location Fig. 6, point b). In rare cases small-scale (e.g. Fig. 8c) and medium-scale (e.g. Fig. 8d) folds were observed (locations in Fig. 6, point c and d, respectively). These folds are interpreted to reflect higher-order folds caused by local accommodation of space problems in relation to the large-scale folding.
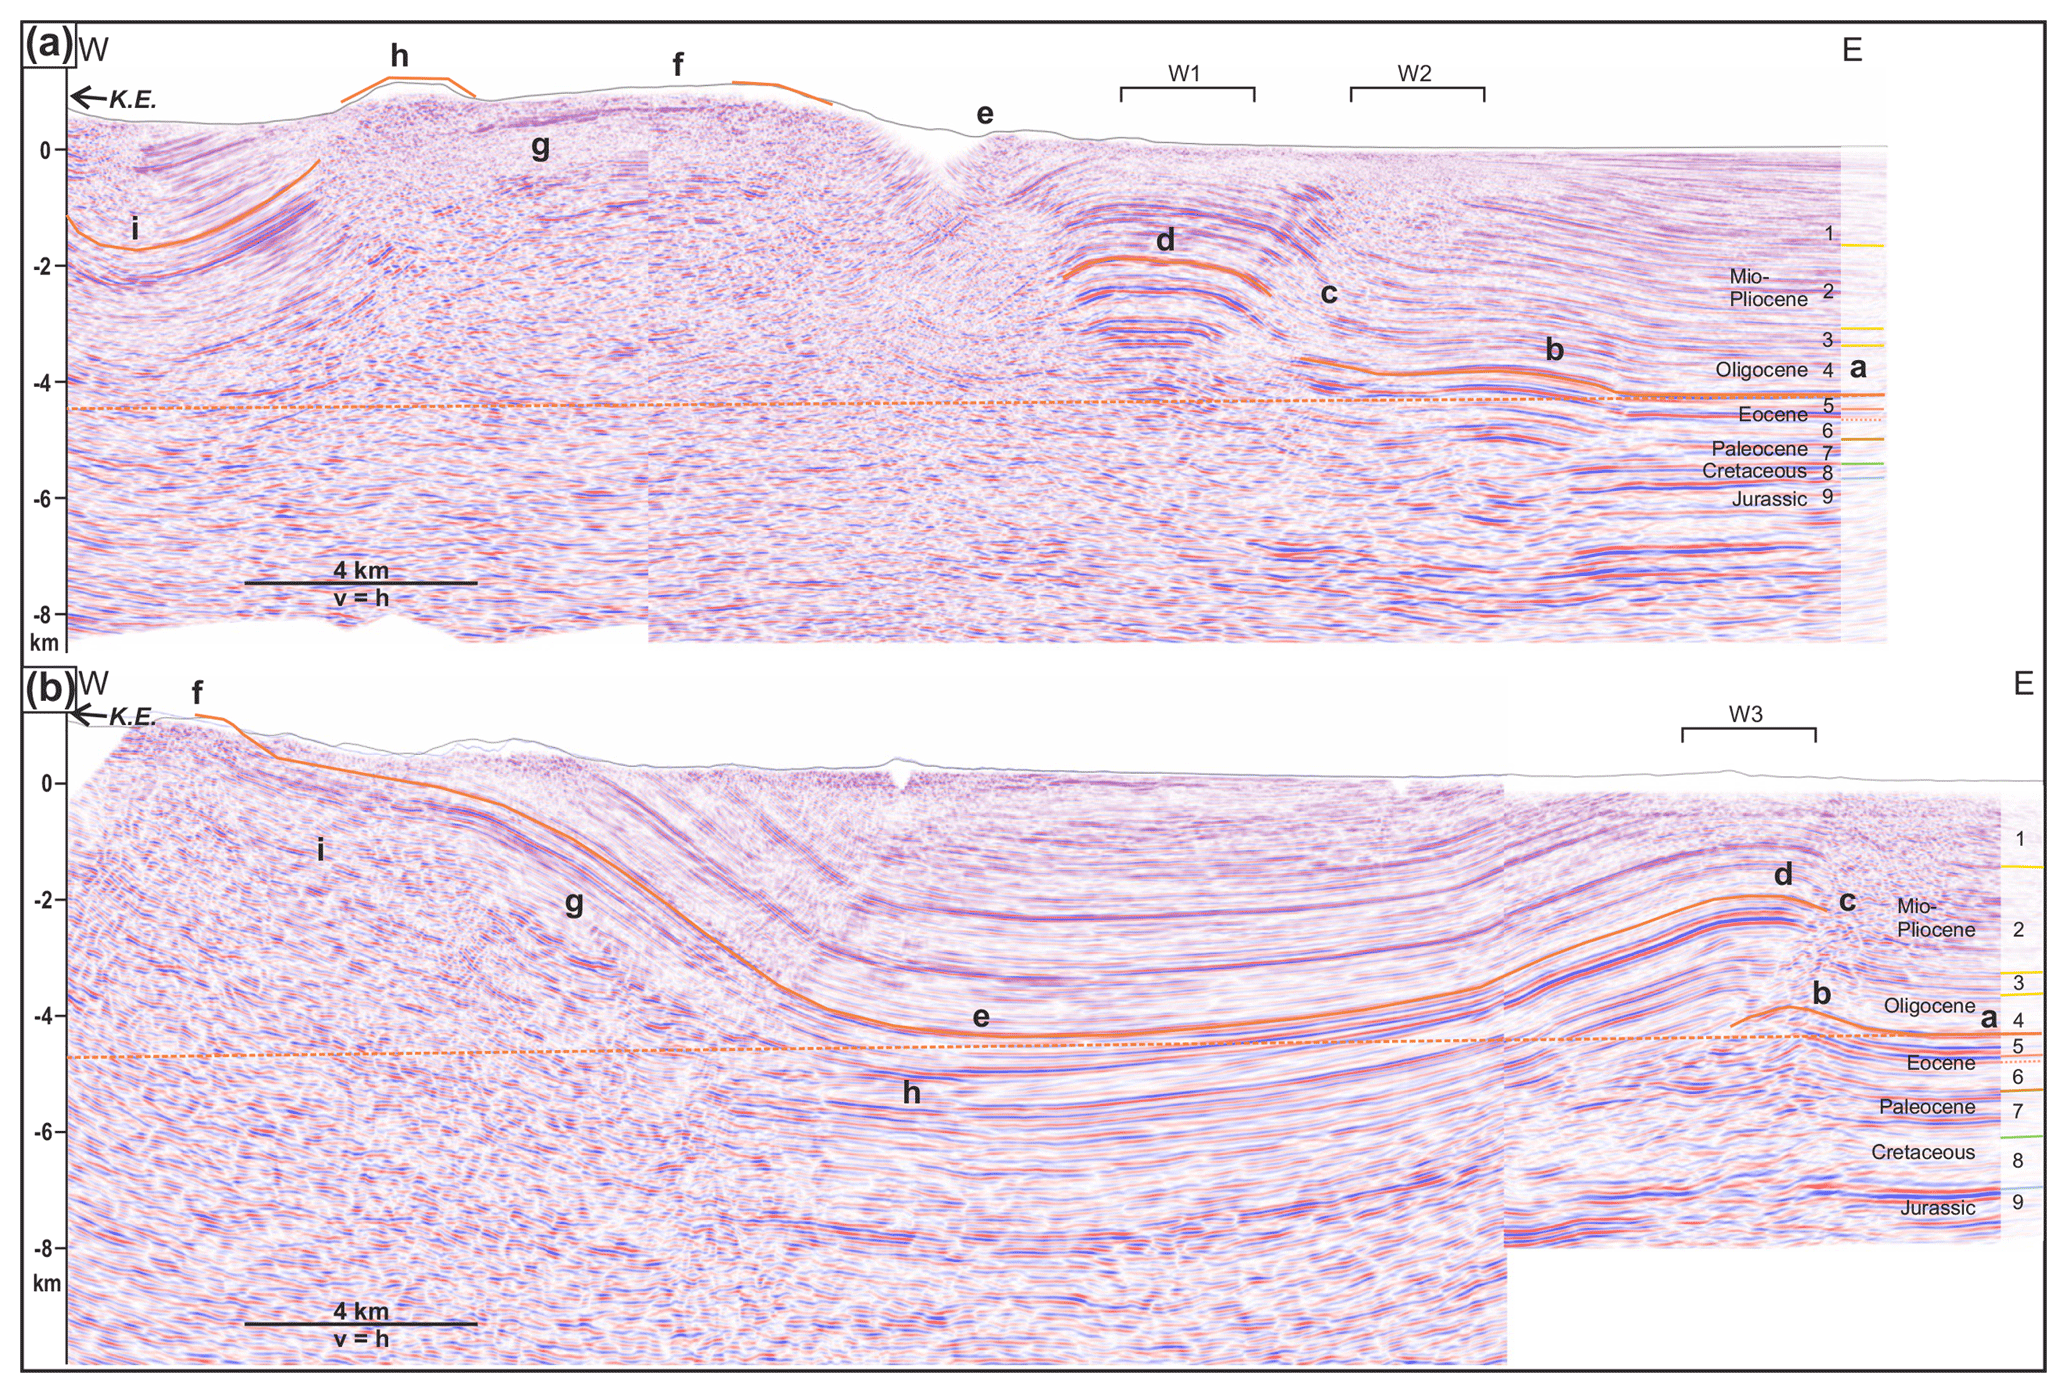
Figure 9Two W–E-oriented pre-stack depth-migrated seismic sections. Orange interpretations indicate the clearly constrained top of the Kirthar Formation from seismic, well and outcrop data. The stippled orange line is the anticipated pre-contractional regional elevation of the Kirthar Formation. K.E.: Kirthar Escarpment. A high-resolution image without interpretation is available as a Supplement figure. The final interpreted seismic lines are part of Figs. 12a and 13a; (a) seismic section composed from two overlapping 2-D seismic lines in the northern sector (exact position not shown for confidentiality reasons). W1: well control within 4 km (to Jurassic level). W2: well control within 5 km (to Paleogene level). Labels a–i are used to indicated features discussed in the text. Numbered horizons in the east refer to horizons as in Fig. 4; (b) section composed from 2-D and 3-D seismic data. W3: well control within 1 km (to Upper Cretaceous level). Labels a–i are used to indicated features discussed in the text. Numbered horizons in the east refer to horizons as in Fig. 4.
The frontal-most anticline (Fig. 6) hosts several gas condensate fields and is partly covered by 2-D seismic and at least one 3-D seismic cube. From 2014–2017 two new 2-D seismic surveys were acquired west of this frontal anticline. For confidentiality reasons we are unable to show the exact locations of the seismic lines and the well data. However, we subdivided the area into a northern and a southern sector (Fig. 6) and use two representative W–E-oriented composite seismic sections to discuss the structural differences of these sectors (Fig. 9). The seismic surveys have up to 6 km horizontal of spread for up to 240 folds and utilized dynamite as the source. Processing of the lines in Fig. 9 is to pre-stack depth migration (PSDM). These seismic lines have been tied to the existing seismic data and wells for stratigraphic control. Stratigraphic control on the lines is given by wells on the frontal anticline or in the foreland via a grid of existing 2-D lines or the 3-D seismic cube. Based on these data robust grids of Oligocene to Cretaceous (Jurassic partly) horizons exist along the frontal anticline and the undeformed foreland. Horizons are indicated in the undeformed foreland in Fig. 9 and in the stratigraphic column (Fig. 4).
The seismic quality tends to degrade towards the west and also with depth. Consequently, the structural architecture in those parts is less constrained. On both sections, the top of the Eocene Kirthar limestones (see Fig. 4) is indicated on locations where well or seismic data unambiguously allow for that interpretation or where it is constrained by surface geology (Fig. 9, orange interpretation). The top of the Kirthar limestones is one of the most characteristic features in the seismic data. It is represented by a strong, continuous reflector on top of a package of weaker reflectors with good continuity. In the following section, a brief description of the main structures at the level of the Kirthar limestones is given and structures in areas of good seismic image quality are analysed.
4.1 Northern sector
In the northern sector, the undeformed foreland is marked by approximately horizontal reflectors (Fig. 9a, point a). Sub-horizontal seismic reflectors indicate the presence of sedimentary rocks to at least 8 km of depth. A minor anticlinal feature (Fig. 9a, point b) and a more pronounced anticline (Fig. 9a, point d) are separated by a zone of discontinuous reflectors (Fig. 9a, point c) that is interpreted as a fault offsetting the Kirthar limestone. More details on these frontal structures are depicted in the growth strata imaged on a time-domain seismic section nearby (Fig. 10).
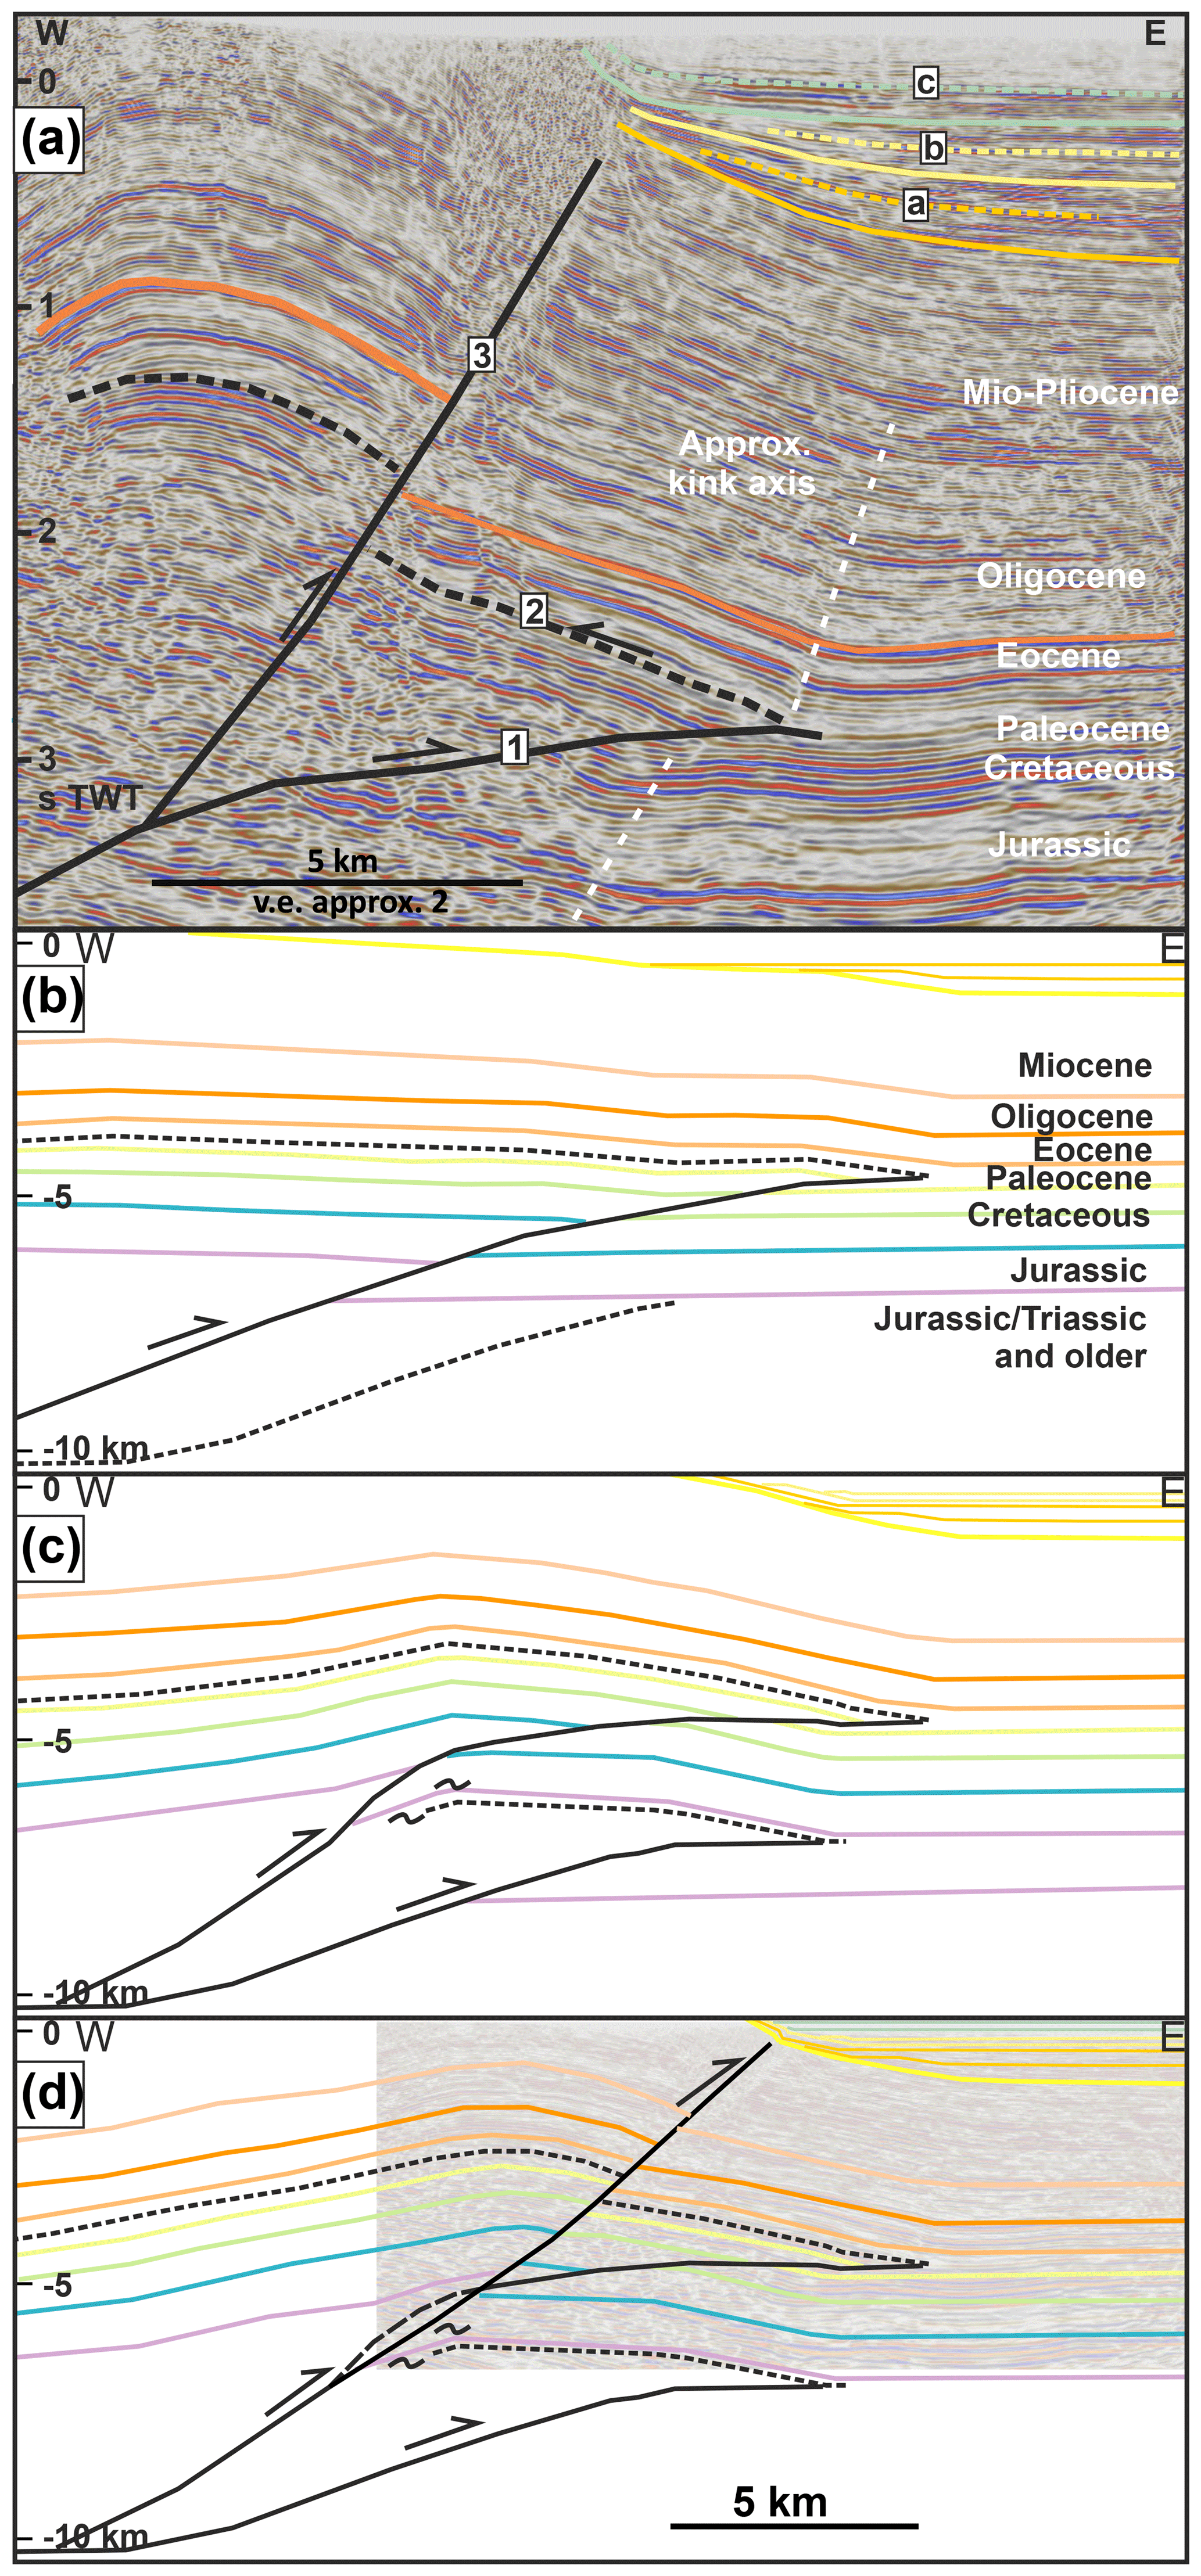
Figure 10(a) 2-D seismic section in time domain in the northern sector (exact position not shown for confidentiality reasons) with fault and growth strata interpretation. (b)–(d) A possible solution for the growth strata pattern as discussed in the text. The seismic image in the background of panel (d) is a roughly depth-converted version of panel (a).
The interpreted growth strata packages a and b show westward thinning and onlap and thus a pattern of apparent progressive limb rotation. The seismic interpretation at depth indicates a thrust fault (thrust 1 in Fig. 10a). There is no additional thin-skinned deformation east of the tip of the wedge documented in confidential seismic data east of the section or on the surface. Therefore, this thrust is interpreted as part of a structural wedge roofed by a bedding-parallel thrust (thrust 2 in Fig. 10a). Tilted strata below thrust 1 with a slightly westward-offset kink axis (white stippled line in Fig. 10a) indicate a potential deeper wedge. Figure 10b–d show a possible sequence of deformation events that honours the growth strata pattern and structures identified in the seismic image. By stacking two wedges the deformation front can stay relatively stationary and develop a growth strata package similar to the imaged one. Migrating kink bands are likely not resolved due to low sedimentation rates and potential intervals of erosion. Unlike what is shown, the wedges might also be partially active at the same time, complexly accommodating large-scale layer-parallel shortening. The youngest thrust shortcuts the wedges (Fig. 10d, fault 3 in Fig. 10a) and deforms the youngest growth strata package (c in Fig. 10a). The relatively good seismic image and nearby well control allow for the definition of the stratigraphic level of the roof thrust (fault 2 in Fig. 10). The thrust has a trend that is parallel to the bedding in the Paleocene shales (upper Ranikot shales; see Fig. 4) just below the thick and competent limestones (Sui Main limestones; see Fig. 4), characterized by a low-reflectivity seismic character. The deeper segments of thrusts 1 and 3 are relatively uncertain based on the seismic profiles. However, the Jurassic Chiltan Formation has been drilled in the hanging wall of thrust 3, indicating that the thrust cuts below the Jurassic.
A syncline is located west of these frontal structures, though it is not imaged on the seismic data due to steeply dipping to overturned beds (Fig. 9a, point e). A large-scale anticline with Kirthar limestones on the surface level is indicated at point f (Fig. 9a; see also Fig. 6). The low-reflectivity seismic facies below the Kirthar limestones represent the Eocene Ghazij (shales) Formation (Fig. 9a, point g). These shales thicken dramatically from the wells on the frontal anticline in the east (several tens of metres) towards the west (several hundred metres, constrained by seismic velocities and outcrop information just west of the Kirthar Escarpment; see Fig. 6 and Ahmad et al., 2012). A small-scale anticline of higher order exposes Kirthar limestones on the surface (Fig. 9a, point h). A syncline marks the western end of the seismic line (Fig. 9a point i). The Kirthar Formation also crops out at the Kirthar Escarpment west of the section (Fig. 6; northern sector, at approximately 1150 m above sea level, a.s.l.). It is notable that the structural elevation of the Kirthar limestone increases from east to west (approximately 2.5 km in the western syncline; Fig. 9a point i). At the highest outcropping point of Kirthar limestones the difference to the estimated regional level is 5500–6000 m with an uncertainty related to the interpreted slope of the regional elevation. A rough depth-to-detachment analysis conducted with the excess area approach (Epard and Groshong, 1993) on the large-scale anticline suggests an upper detachment depth of 8–10 km. The spread in the predicted detachment is due to high uncertainty in the deeper stratigraphic picks on the seismic section and the fact that the Kirthar Formation is not returning to regional elevation in the syncline to the west.
4.2 Southern sector
In the southern section, the undeformed foreland (Fig. 9b, point a) shows sub-horizontal reflectivity to at least 8 km of depth. To the west a minor flexure (Fig. 9b, point b) is situated underneath a seismic noise zone hiding a thrust fault (Fig. 9b, point c). The anticline above the thrust (Fig. 9b, point d) is the southern along-strike continuation of the anticline on the northern section (Fig. 9a, point d, frontal anticline in Fig. 6). The syncline towards the west (Fig. 9b, point e) is much broader than its northern equivalent. Sub-horizontal reflectors indicate the presence of sedimentary rocks to at least a depth of 10 km. The frontal structures have been analysed and interpreted. Finally, the concluded model is illustrated and tested by running a kinematic forward model (Fig. 11). The interpreted fault geometries as well as a stratigraphic template elaborated from wells and outcrop sections are used for the starting configuration of the model (Fig. 11a). Step 1 follows the sequence elaborated in the northern sector (i.e. wedging before fault-propagation folding; see Fig. 10), which shows a small fault-bend fold that forms a small triangular structure at the deformation front (Fig. 11b). This triangular structure is cut by a subsequent thrust, forming a fault-propagation fold (Fig. 11c). This step is modelled using the tri-shear implementation in Move software (Midland Valley, 2016; Fig. 11c). There are several parameters that control the shape of the anticline. In detail, more than one solution (combination of parameters) can generate an approximate fit to the given constraints (seismic data, well data (not shown) and surface dips), but differences are not significant. The reasonable fit shown in Fig. 11c supports the fault interpretation and the amount of shortening applied to these frontal structures (about 5000 m of horizontal shortening). To the west of the red stippled line in Fig. 11c, the model does not exactly match the seismic image; the interpreted Kirthar Formation is constantly rising until the limestones crop out in a small-scale fold (Fig. 9b, point f). West of point f the Kirthar Formation is continuously exposed to the Kirthar Escarpment (just west of the end of the seismic line) at an elevation of around 1850 m a.s.l.
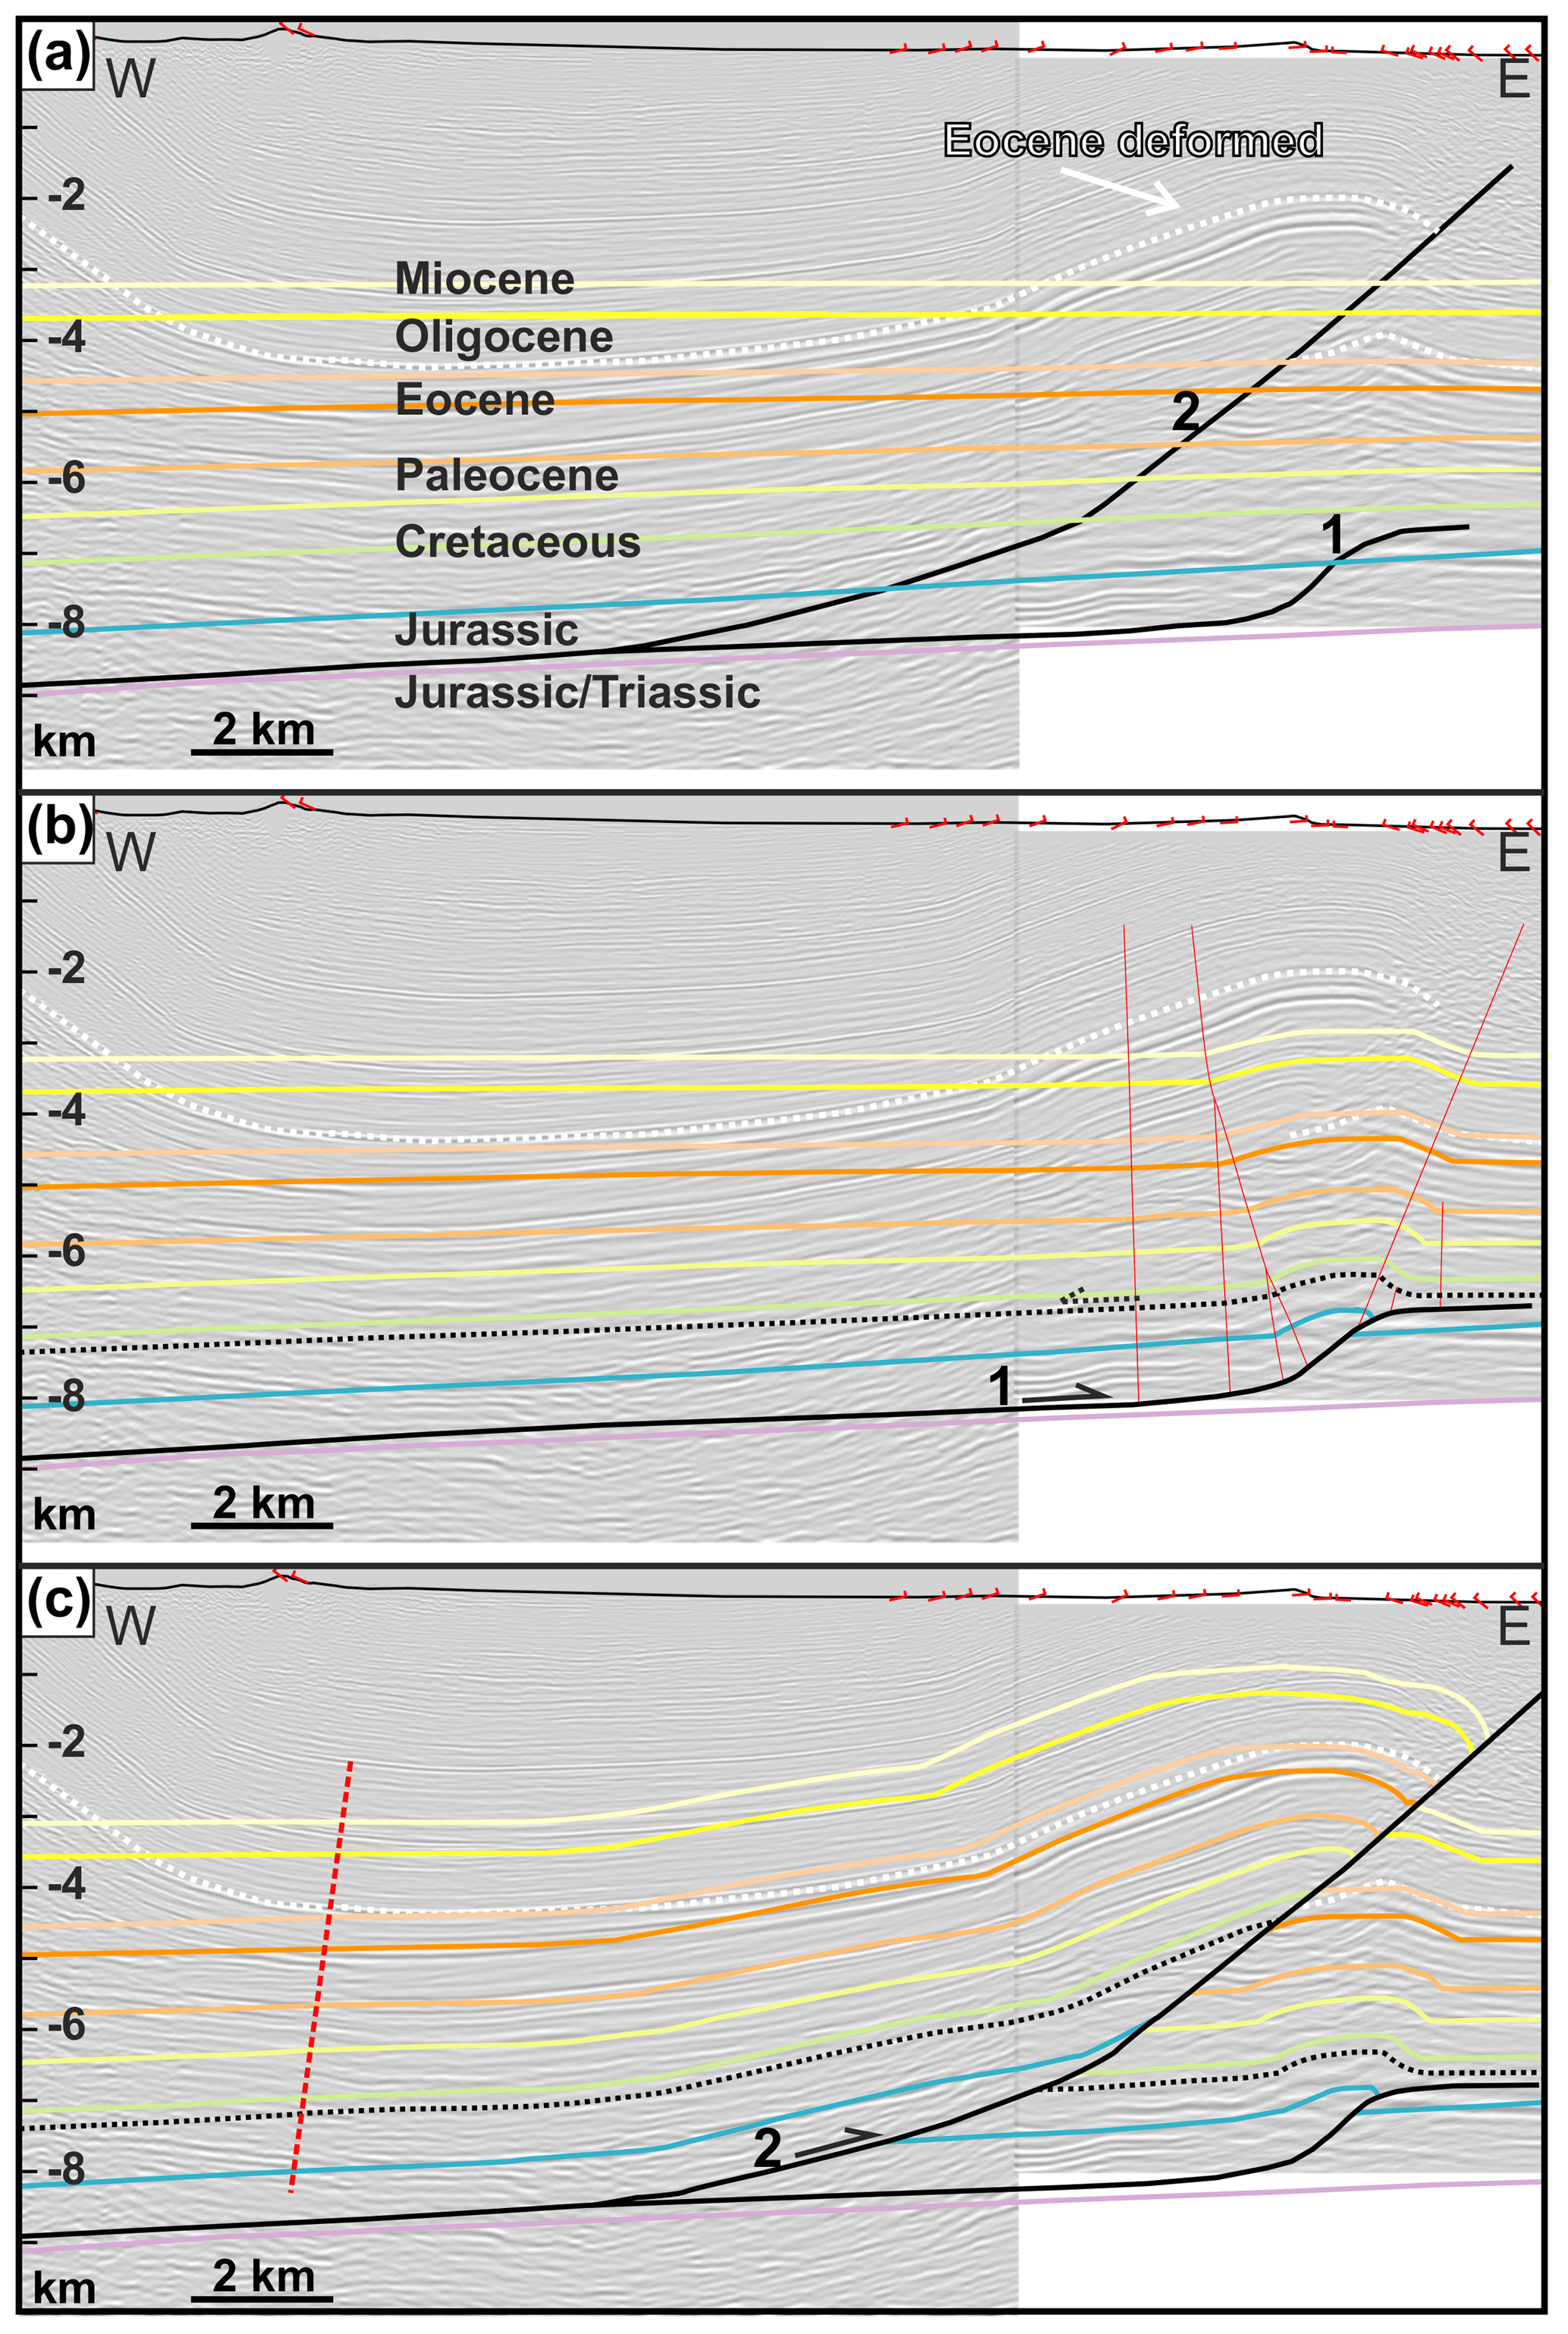
Figure 11Forward modelling of the frontal structures in the southern sector. (a) The seismic image, surface geometry including dips, the present-day deformed state of the top Eocene limestones (constrained by nearby well control), and the interpreted and constructed faults are given as a reference frame for the forward model. The model uses a stratigraphic wedge with thicknesses which are constrained by well and outcrop observations. (b) A small triangular structure at the deformation front is modelled with fault-bend folding. The lower detachment (1) is in Lower Jurassic or Triassic succession, and the upper one is interpreted in the soft Cretaceous Goru shales (dotted line). (c) A fault-propagation fold forms hinterland-ward of the triangular structure by a thrust ramp (2) modelling done with tri-shear. The model mimics the structure imaged in the seismic section approximately from the deformation front (east) to the red stippled line.
Similar to the northern section, the Eocene Ghazij shales thicken westward. The shales are thin (several tens of metres) in the frontal anticline (Fig. 9b, below point d) and thicken towards the west (Fig. 9b, point g). This thickening is especially pronounced west of the clinoforms (Fig. 9b, point h), which are interpreted as the carbonate margin of the Laki (Sui Main) limestones.
On the southern section the structural elevation of the Kirthar limestones rises constantly from the syncline axis (Fig. 9b, point e) towards the Kirthar Escarpment in the west. The structural elevation gain above regional at the Kirthar Escarpment is more than 6500 m (with uncertainty related to the interpreted regional level; Fig. 9b, stippled orange line).

Figure 12(a) Constructed W–E section in the southern sector of the study area with a PSDM seismic section in the background (see Fig. 9b). The section is balanced between the red loose line and the eastern end of the section (fixed line). KE: Kirthar Escarpment; (b) restored section (50 % scale of a). Calculated shortening is approximately 10 km or 20 %.
Despite some structural differences between the northern and southern sectors, the common observation is an overall increase in the elevation of the Kirthar and other formations above the regional from the east to the west. Such an increase in elevation can be explained by several mechanisms: (a) a strong wedge shape of the pre-deformational strata below the Kirthar, (b) a thrust–fault to a deeper structural level, and (c) internal structural thickening of formations below the Kirthar Formation or any combination thereof as these proposed mechanisms are not mutually exclusive.
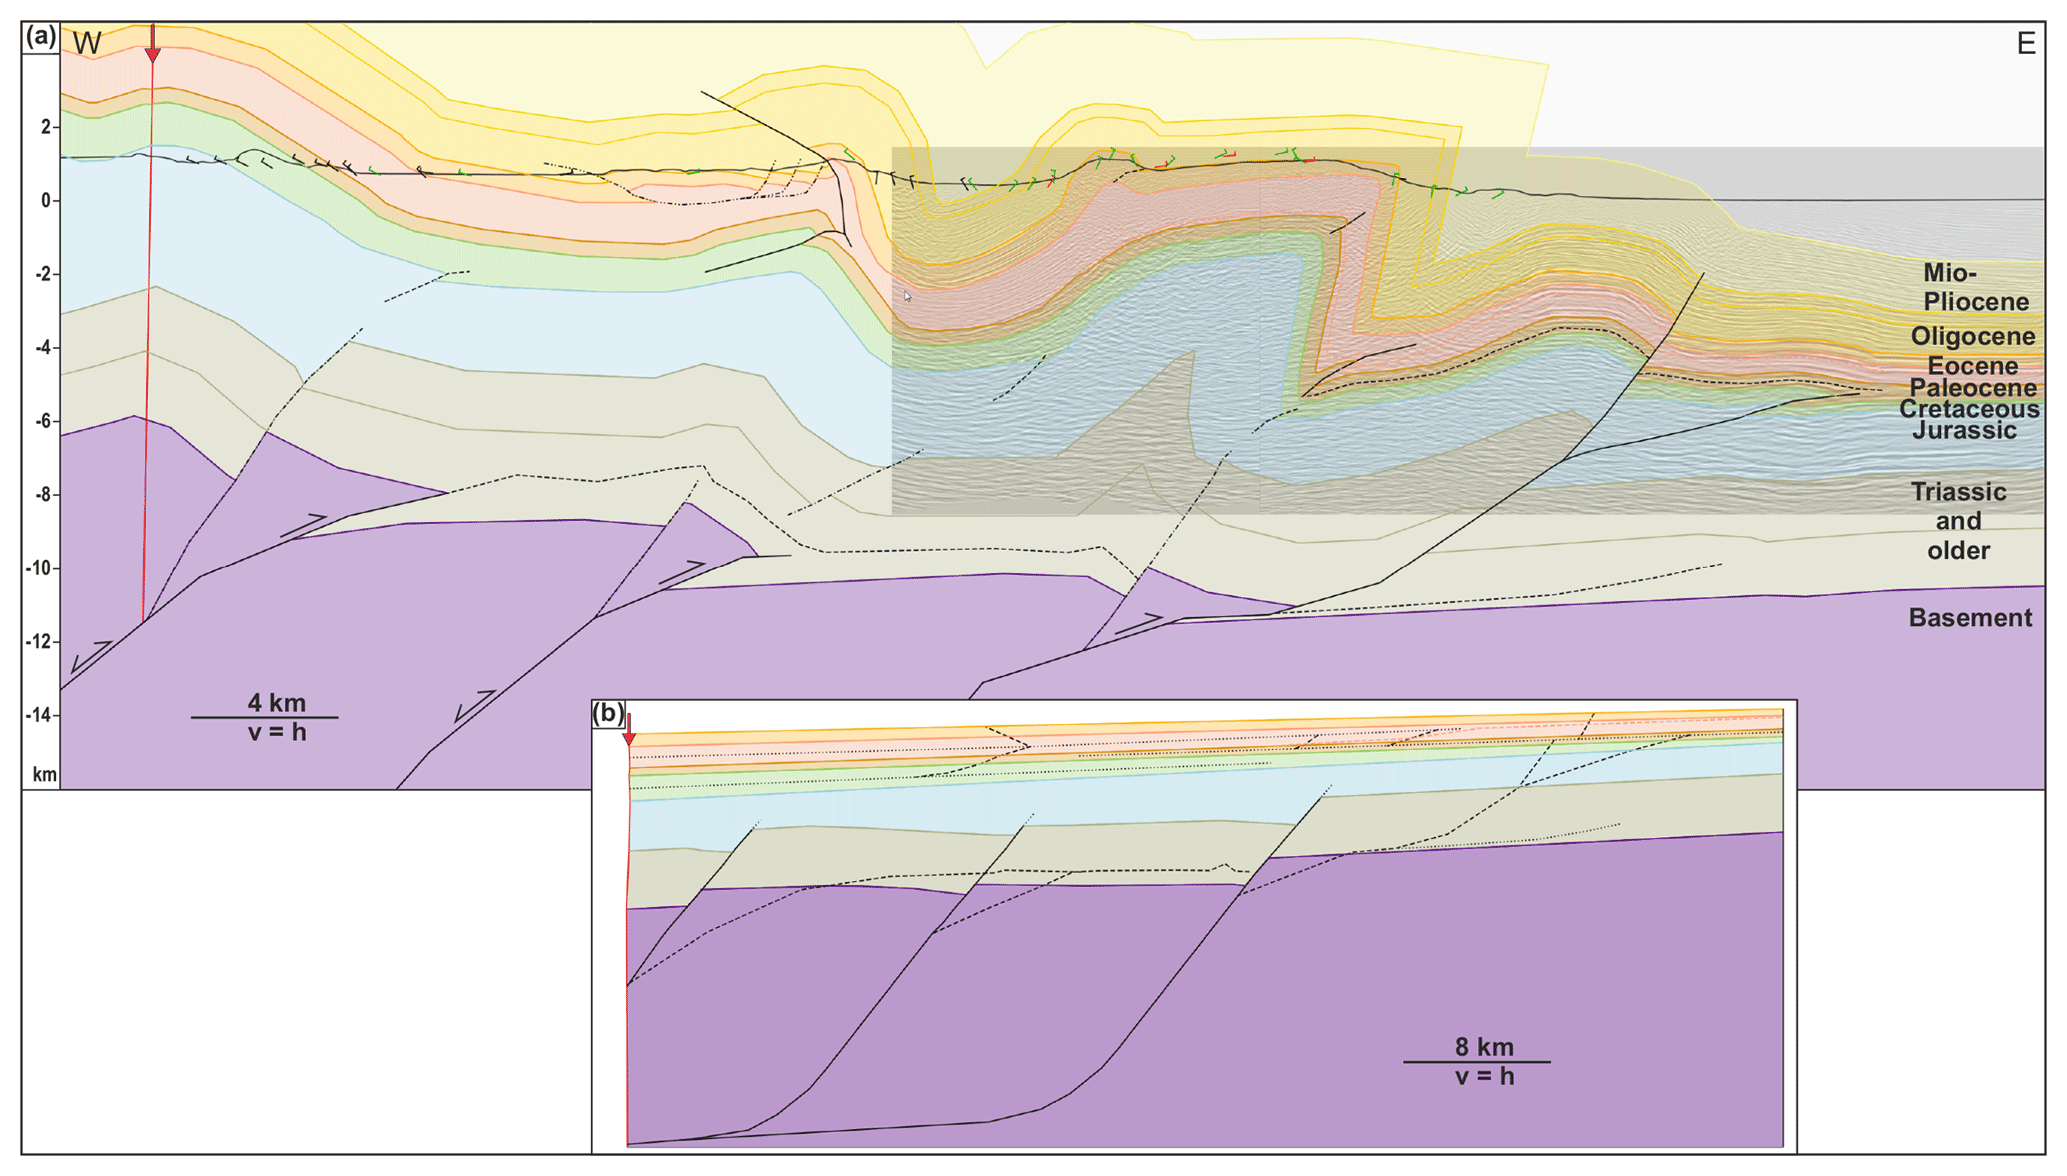
Figure 13(a) Constructed W–E section in the northern sector of the study area with a PSDM seismic section in the background (see Fig. 9a). Dip measurements projected between 2.5 and 4 km. The section is balanced between the red loose line and the eastern end of the section (fixed line). (b) Restored section (at 50 % scale of a) by using line length and area balancing methods. Calculated shortening is approximately 11.2 km or 18 %.
For several reasons discussed throughout this chapter, we propose that the most likely scenario for driving the structural uplift is a thick-skinned contribution that is probably caused by the partial inversion of existing structures linking upwards with suitable detachments in the sedimentary column. The balanced sections of the southern and the northern zone are displayed in Figs. 12 and 13, respectively. The sections honour the seismic interpretation and constraints from the structural modelling and fit the regional context and constraints. Before discussing the sections individually in detail we need to elaborate these constraints and arguments. This includes addressing the following main questions: (a) could a pure thin-skinned (duplex) solution explain the same (regional) pattern? (b) What are the indications for inversion in contrast to a (non-inversion) basement-involved model?
5.1 Constraints from regional structures
West of the area covered in Fig. 6 the topographic (see Fig. 2h) and structural elevation remains high (more than 6000 m), as indicated by the outcropping of the Jurassic in various folds (Figs. 3, 6). A conceptual regional cross section based mainly on a low-resolution geological map (scale; Bannert et al., 1992) is displayed in Fig. 2g. The section tentatively shows some relatively steep thick-skinned faults and gently folded strata above. Due to the limited data and the problems of cross-sectional orientation and non-plane strain conditions, balancing this regional section is problematic. However, the folds shown in the section accommodate approximately 10 % of line length shortening. Based on the balancing results from our own sections where higher-resolution data are present, we argue that the actual shortening can be somewhat higher (of the order of 15 %–20 %) and that the difference is due to scale problems as well as unresolved shortening in wedges and other distributed shortening. A conceptual section compares a thick-skinned to a thin-skinned solution (Fig. 14). In both cases the deformation is pinned at the deformation front. The thick-skinned model envisages the total amount of shortening as accommodated in the contractional structures above the approximately equally shortened basement (Fig. 14a). The thin-skinned model assumes that the basement remains undeformed beneath the duplex structures (Fig. 14b) and has to be shortened towards the hinterland. The thin-skinned duplex solution shown (assuming reasonable stratigraphic thicknesses) does not reach the structural uplift observed (more than 6000 m) and has serious balancing problems. Increasing the magnitude of shortening would allow the solution to attain higher structural elevation(s), but increases the balancing issue at the same time. The shortening of the strata above the duplexes would likely require a set of back-thrusts as the plane of the roof thrust is severely folded and thus not likely a viable slip plane. No such back-thrusts or other structures that would accommodate the excess shortening are observable on the geological maps. Furthermore, the basement is required to shorten somewhere as well with the same magnitude. Usually this shortening would happen towards the hinterland (by a staircase thrust system). As a consequence, deeper stratigraphic rocks or basement would be uplifted towards the hinterland (tentatively shown in Fig. 14b). However, towards the hinterland no such root zone is present in the Kirthar Fold Belt (see Figs. 2g, 3). Furthermore, the fold belt as such does not show a prominent surface slope from hinterland to foreland (only 0.5∘–1∘, Fig. 2h). This could indicate that the transpressive fold belt likely does not represent a critical tapered accretionary wedge (see Dahlen et al., 1984; Suppe, 2007), although we do not have good control on the basal angle of a potential wedge. A governing wedge shape is probably necessary to allow for the sustained basal accretion of duplexes. Steeper faults, also affecting the basement, do require much less shortening to uplift overlying strata to a high structural elevation (Fig. 14a) and are consistent with the missing root zone towards the plate boundary (Figs. 2g, 3).
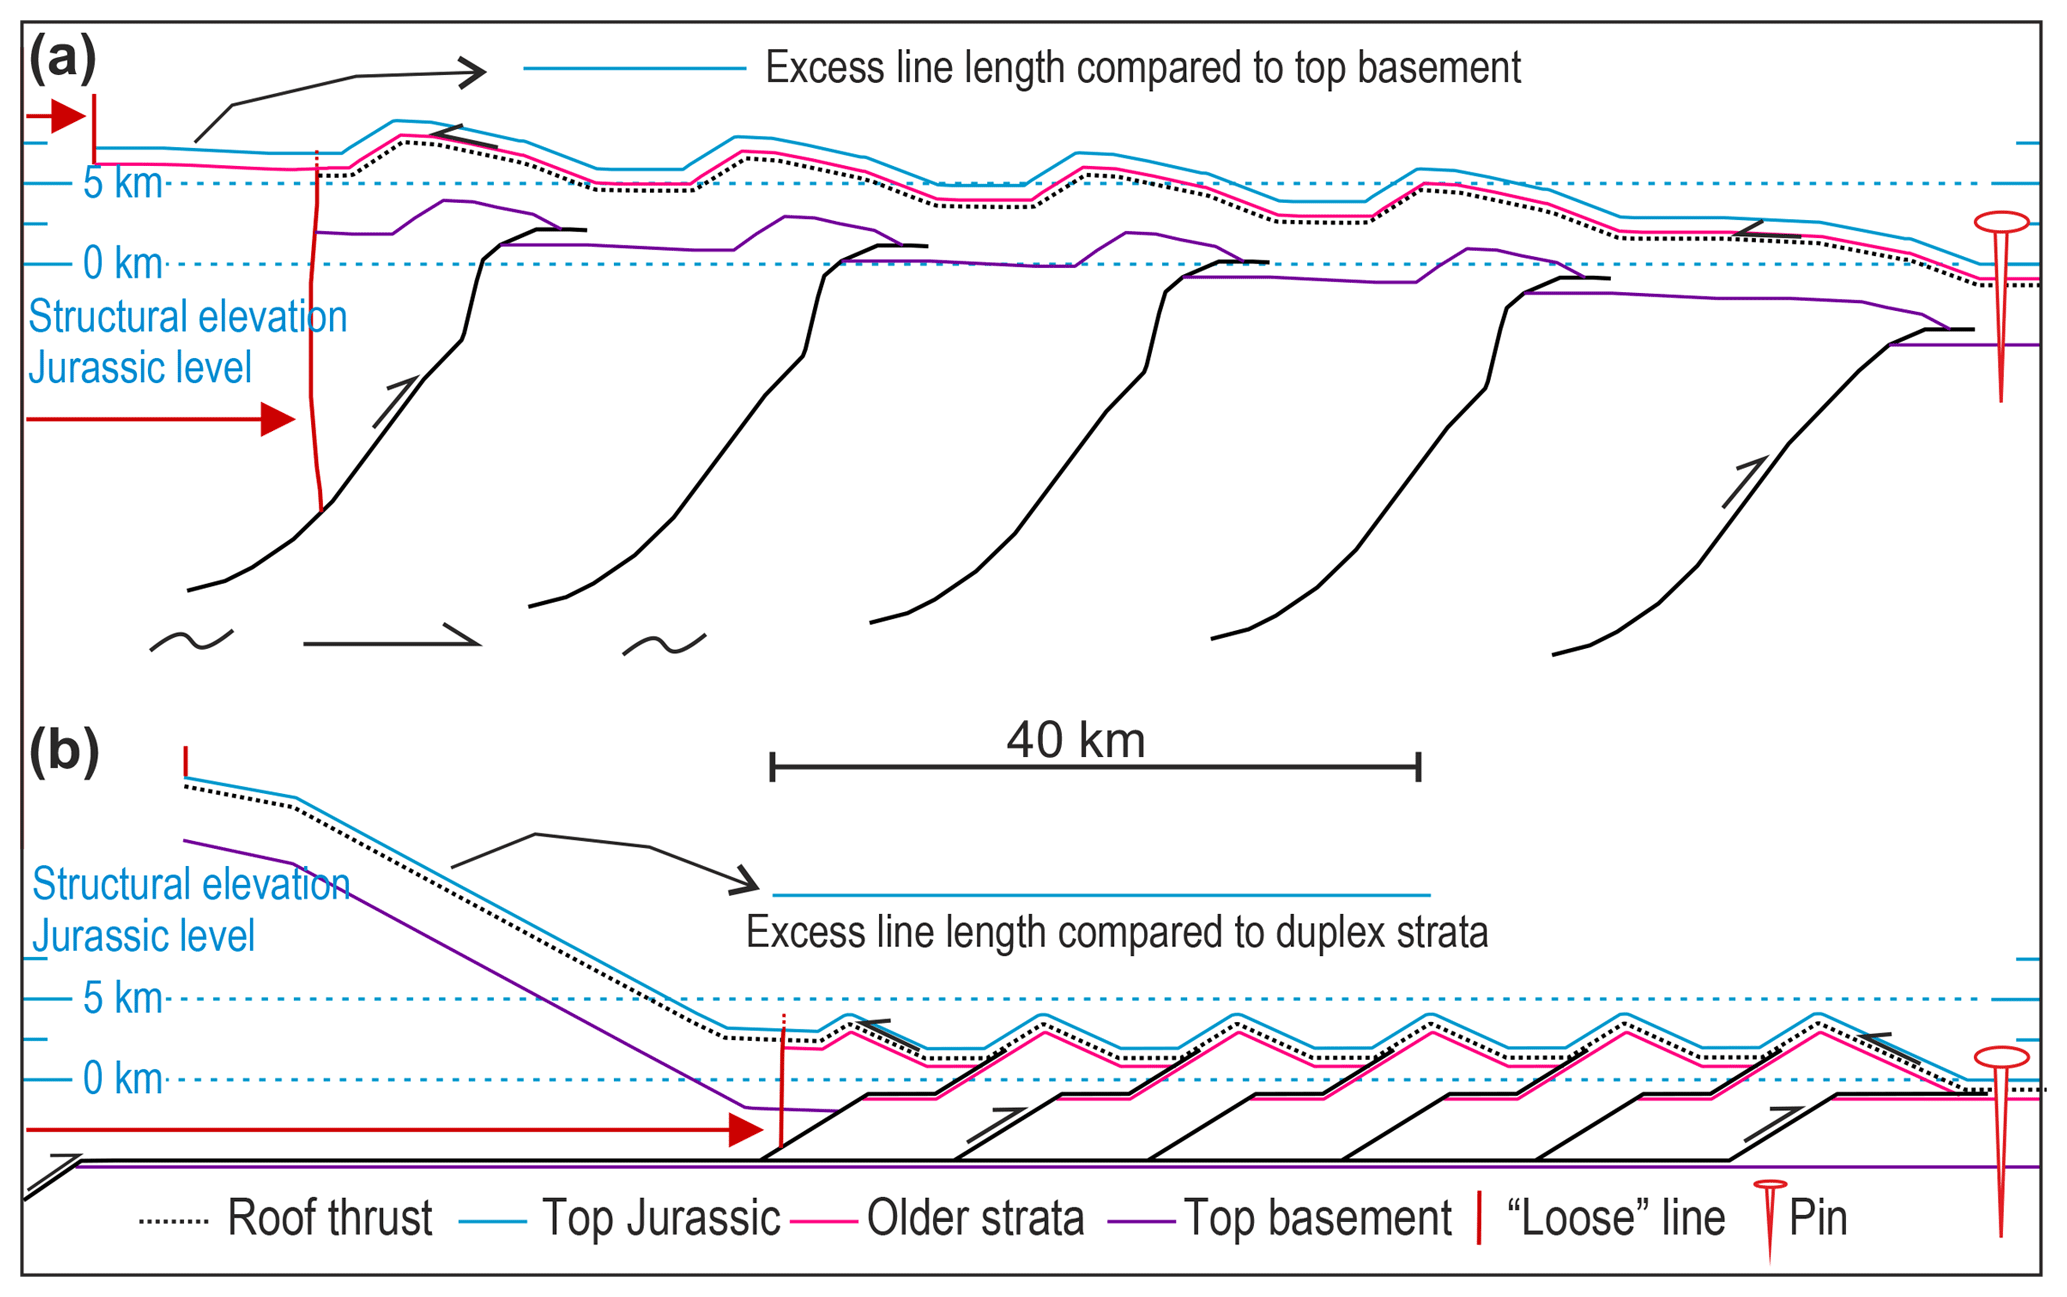
Figure 14Simplified sketch comparing thick- vs. thin-skinned solutions for the structural elevation uplift of the Jurassic level. Elevations are with respect to the regional elevation of the Jurassic (0 km); (a) a series of thick-skinned faults with a total of 20 km of shortening (16 %). Due to the pinning at the deformation front, a roof thrust under the horizons needs to be present. The excess line length of the sediments above the roof thrust (about 13.5 km) needs to be accommodated in the section as well, which could happen in internal shortening and amplification of the folds. The solution explains a structural uplift towards the hinterland of 5–7 km. (b) One example of a duplex solution with total 48 km of shortening (38 %). The example solution stays below 5 km of structural uplift. In order to increase the uplift, more shortening in the duplexes would be required, which would increase the balancing issues. A tentative thrust cutting into the basement behind the duplexes would uplift basement rocks towards the hinterland.
In our study area, the outcropping structures west of the seismic coverage and west of the Kirthar Escarpment yield some indications about the structural architecture below the Kirthar and Ghazij Formation (Fig. 6). The area west of the Kirthar Escarpment has a high mean elevation (more than 1000 m a.s.l.; see Fig. 2h). The anticlines with Jurassic outcrops represent the structures with the highest elevations in the area (labelled with bold number 1 in Fig. 6). In between are areas where Paleocene (and sparsely also Eocene) rocks are preserved, which represent relative structural lows (labelled with bold number 2 in Fig. 6). A further characteristic is the presence of long-wavelength folds with several kilometres of wavelength (labelled with bold number 3 in Fig. 6) and folds with much smaller wavelengths and higher frequencies (labelled with bold number 4 in Fig. 6), indicating a much shallower detachment horizon. The large-scale anticlines are usually double plunging and have roughly NNW–SSE- to N–S-trending axes, but a variety of subordinate directions are present as well. A plausible deformation model should be able to explain this complex pattern.
As lined out above, a thick-skinned contribution to the structural elevation is necessary. In a transpressional system we would expect a zone of shortening in which the shortening features are striking 45∘ to parallel to the dominant strike-slip features (Sanderson and Marchini, 1984; Fossen et al., 1994; Schreurs and Colleta, 1998). The Chaman and Ghazeraband faults are in an N–S to NNE to SSW orientation (Fig. 1), and thus shortening structures should have a strike orientation of NE–SW to NNE–SSW. The NNW–SSE- to N–S-trending axes west of the Kirthar Escarpment in the central Kirthar Fold Belt (Fig. 6) seem rather unusual with respect to the orientation of the transpressive margin. Thus, it seems reasonable to assume that the NNW–SSE to N–S orientation is not linked to newly initiated faults at depth but is associated with localized deformation controlled by inherited zones of weakness.
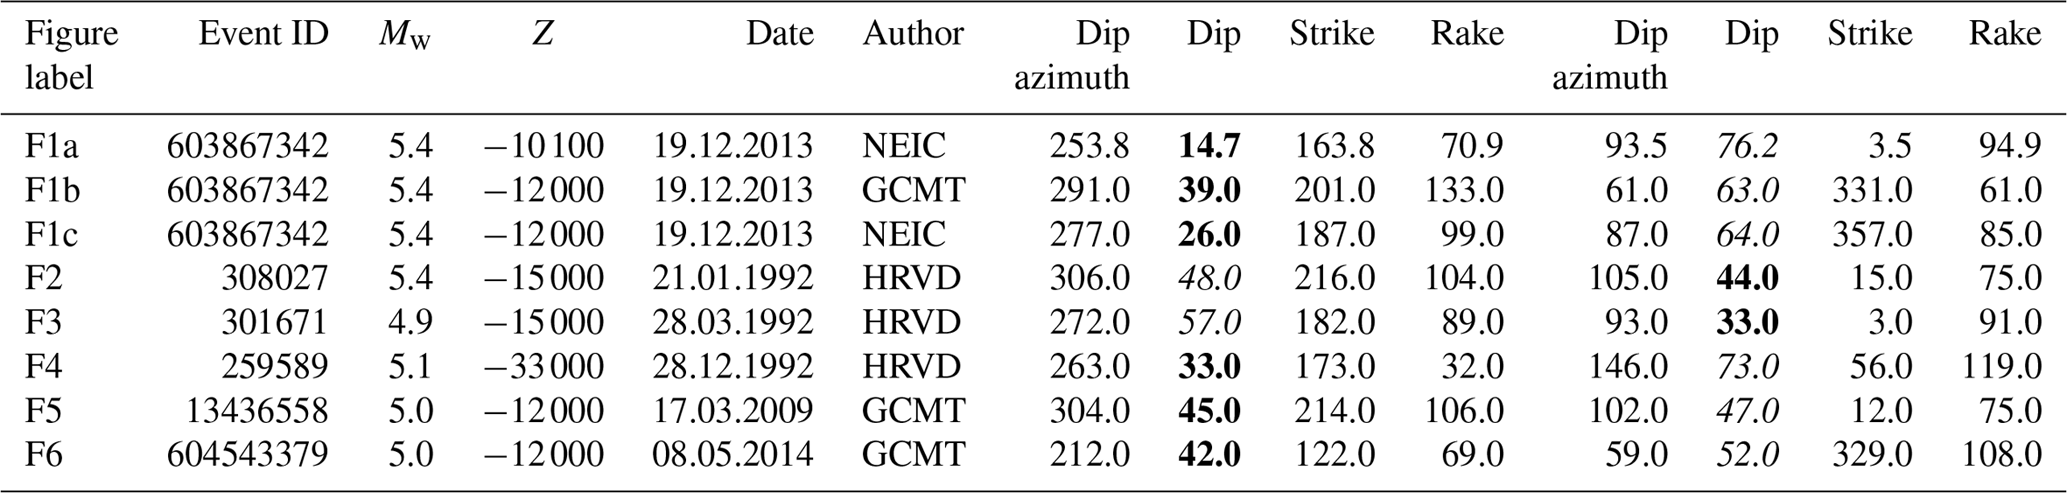
Table 1Nodal planes from the International Seismological Centre (2015) database for reviewed events only. In addition to the dip, the dip azimuth of the planes is calculated. The strike and rake values from the database are given for completeness and assessment of obliquity. Event F1 has three different solutions in the database. The differences are a rough indication of the uncertainty in the data. Bold and italic dip values indicate the lower and higher dip surfaces of the pair. The author column refers to the original provider in the database (see Lentas et al., 2018, and references therein).
5.2 Constraints from seismicity
We use nodal planes derived from the International Seismological Centre (ISC) bulletin database to constrain potential fault geometries in the subsurface in the wider study area (Fig. 3). Given the tectonic setting of a lateral collision zone, it is not surprising that earthquakes towards the current plate boundary at the Chaman Fault document dominantly strike-slip faulting. Some focal mechanisms of earthquakes close to the deformation front show dominant dip-slip shortening (Fig. 3 and Table 1). All these events are in depth ranges of 10–15 km, with the exception of F4 (Fig. 3 and Table 1), which is at greater depth (33 km). Interestingly, this event is the only one with a slightly oblique character. Given the potential error ranges on the depth of the events the shallow events could be located in the crystalline basement or in the lower part of the sedimentary column.
For the events listed in Table 1 is not clear which of the two nodal planes was the moving plane. We could either assume it is the one with the lowest dip or it is westward dipping, corresponding to southeast- or eastward-directed shortening. For the first assumption fault dips are between 15 and 45∘ and for eastward-dipping faults between 15 and 57∘. In both cases, the steeper faults are considered to be too steep to represent newly initiated thrust faults. We therefore interpret these steep faults as parts of pre-existing faults that are in a suitable angle for reactivation. The shallower dipping events could represent newly initiated faults, of which those at depths above 12 km could be located in the sedimentary column.
Based on levelling data, surface deformation associated with the 1931 Mach earthquake in front of the northern Kirthar ranges has been investigated by Ambraseys and Bilham (2003) and by Szeliga et al. (2009). The authors model different fault slip solutions to match the seismic and post-seismic elevation gain at the deformation front. In a geological section Szeliga et al. (2009) consider listric thrust faults with angles exceeding 45∘, linking shortening on a deep flat décollement (likely in the basement) to higher levels in the sediments (Fig. 2d). In order to match the surface deformation after the 1931 Mach earthquake with elastic models, a fault geometry comprising deep detachment, a ramp section (part of a steep listric fault) and a branching gently dipping thrust towards the deformation front are needed. The fault shape considered responsible for the event by Szeliga et al. (2009) is tentatively shown in Fig. 2d as a red line. Such a geometry supports our proposed model close to the deformation front, where basement faults link with shallower detachments and thrusts in the sediments.

Figure 15(a, b) Model of extension with subsequent inversion on curved linked faults (modified after Yamada and McClay, 2004). (c) Adding leading thin-skinned deformation and shortcut fault to the sketch of inverted curved linked fault system. (d) Sketch of half-graben systems with overlapping faults for anticipation of more complex subsurface geometries before inversion.
5.3 A simplified thick-skinned – thin-skinned inversion model
We propose that an inversion model is the best solution to explain all the different observations and constraints. Yamada and McClay (2004) demonstrated that the shape of the normal fault and associated (half-) graben with its syn-kinematic fill (Fig. 15a) defines the shape of the inversion anticline (Fig. 15b). It is interesting to note the presence of double plunging anticlines and the possibility of local lows between the anticlines and towards the hinterland (Fig. 15b), which resembles the structural pattern west of the Kirthar Escarpment in map view. The analogue experiments are limited by the rigid boundary conditions (non-deformable footwall, constant length of the hanging-wall fault), whereas in nature, this is likely not the case. Inversion likely affects only those parts of the faults that are suitable for frictional reactivation. In listric fault systems these would be dominantly the deeper segments located in the ridged basement (depending on the post-rift strain history). Other inversion-related deformations, like hanging-wall shortcut faults, reverse faults and buttressing effects (see Cooper et al., 1989; Hayward and Graham, 1989), are likely to be present as well and can be considered indirect inversion. In the study area the shortening of the inverting normal fault is considered to be transferred to a detachment in the sediments (Fig. 15c), explaining the presence of short-wavelength folds adjacent to large-wavelength folds (see Fig. 6). The linking from the deeper inverting fault to the detachment in the sediments might be associated with the above-mentioned complex deformation, e.g. a footwall shortcut fault (Fig. 15c).
We further suggest that the complex map pattern is likely the result of a much more complex inverted fault pattern as observed in natural rifts. An en-echelon pattern and overlaps of faults with intact and broken relay ramps and horses, for example (Fig. 15d), could contribute to a more complex deformation pattern if directly or indirectly inverted. Additionally, several stacked detachment horizons allow for the accommodation of shortening by linking stacked wedges and distributed ductile strain. As a consequence, the amount of shortening introduced by basement faults is partly disseminated and thrusts, if they reach the surface, have relatively small displacements (relative to the amount introduced by the basement faults). We consider the inverting faults to be inherited from the original rift phase on the lateral boundary when the Indian Plate rifted from northern Gondwana (Fig. 5a). The direction of the rift faults would thus also define the N–S direction of the anticlines, which is strongly oblique to the plate kinematic vector.
5.4 Southern section kinematic model and balanced section
The kinematic model of the frontal deformation structures in the southern section (Fig. 11) accommodates approximately 5000 m of shortening. However, this amount of shortening is not enough to explain the 6500 m of regional uplift towards the hinterland at the Kirthar Escarpment when taking into consideration reasonable fault dips. A fault with a 45∘ angle and a displacement of 5000 m would generate a structural uplift of 5000 m from a simple geometric perspective. Either a steeper fault is necessary (i.e. > 52∘) or some additional shortening associated with the inverting fault is required to explain the 6500 m of regional uplift. From careful seismic interpretation and dip analysis we have interpreted the presence of small passive roof duplexes underneath the soft Eocene Ghazij shales. Below point g (Fig. 9b) some strong but laterally discontinuous reflector packages are present (between points h and i). The reflectors are interpreted to represent the Paleocene limestones. The discontinuous pattern is interpreted to be caused by poor imaging and by structural imbrication. East of point i (Fig. 9b), a small back-thrust is interpreted. The structural solution is presented in the balanced section (Fig. 12a). By adding the shortening of these small passive roof duplexes to the total displacement on the basement fault, the required regional uplift at the Kirthar Escarpment can be achieved, as is demonstrated in Fig. 16.
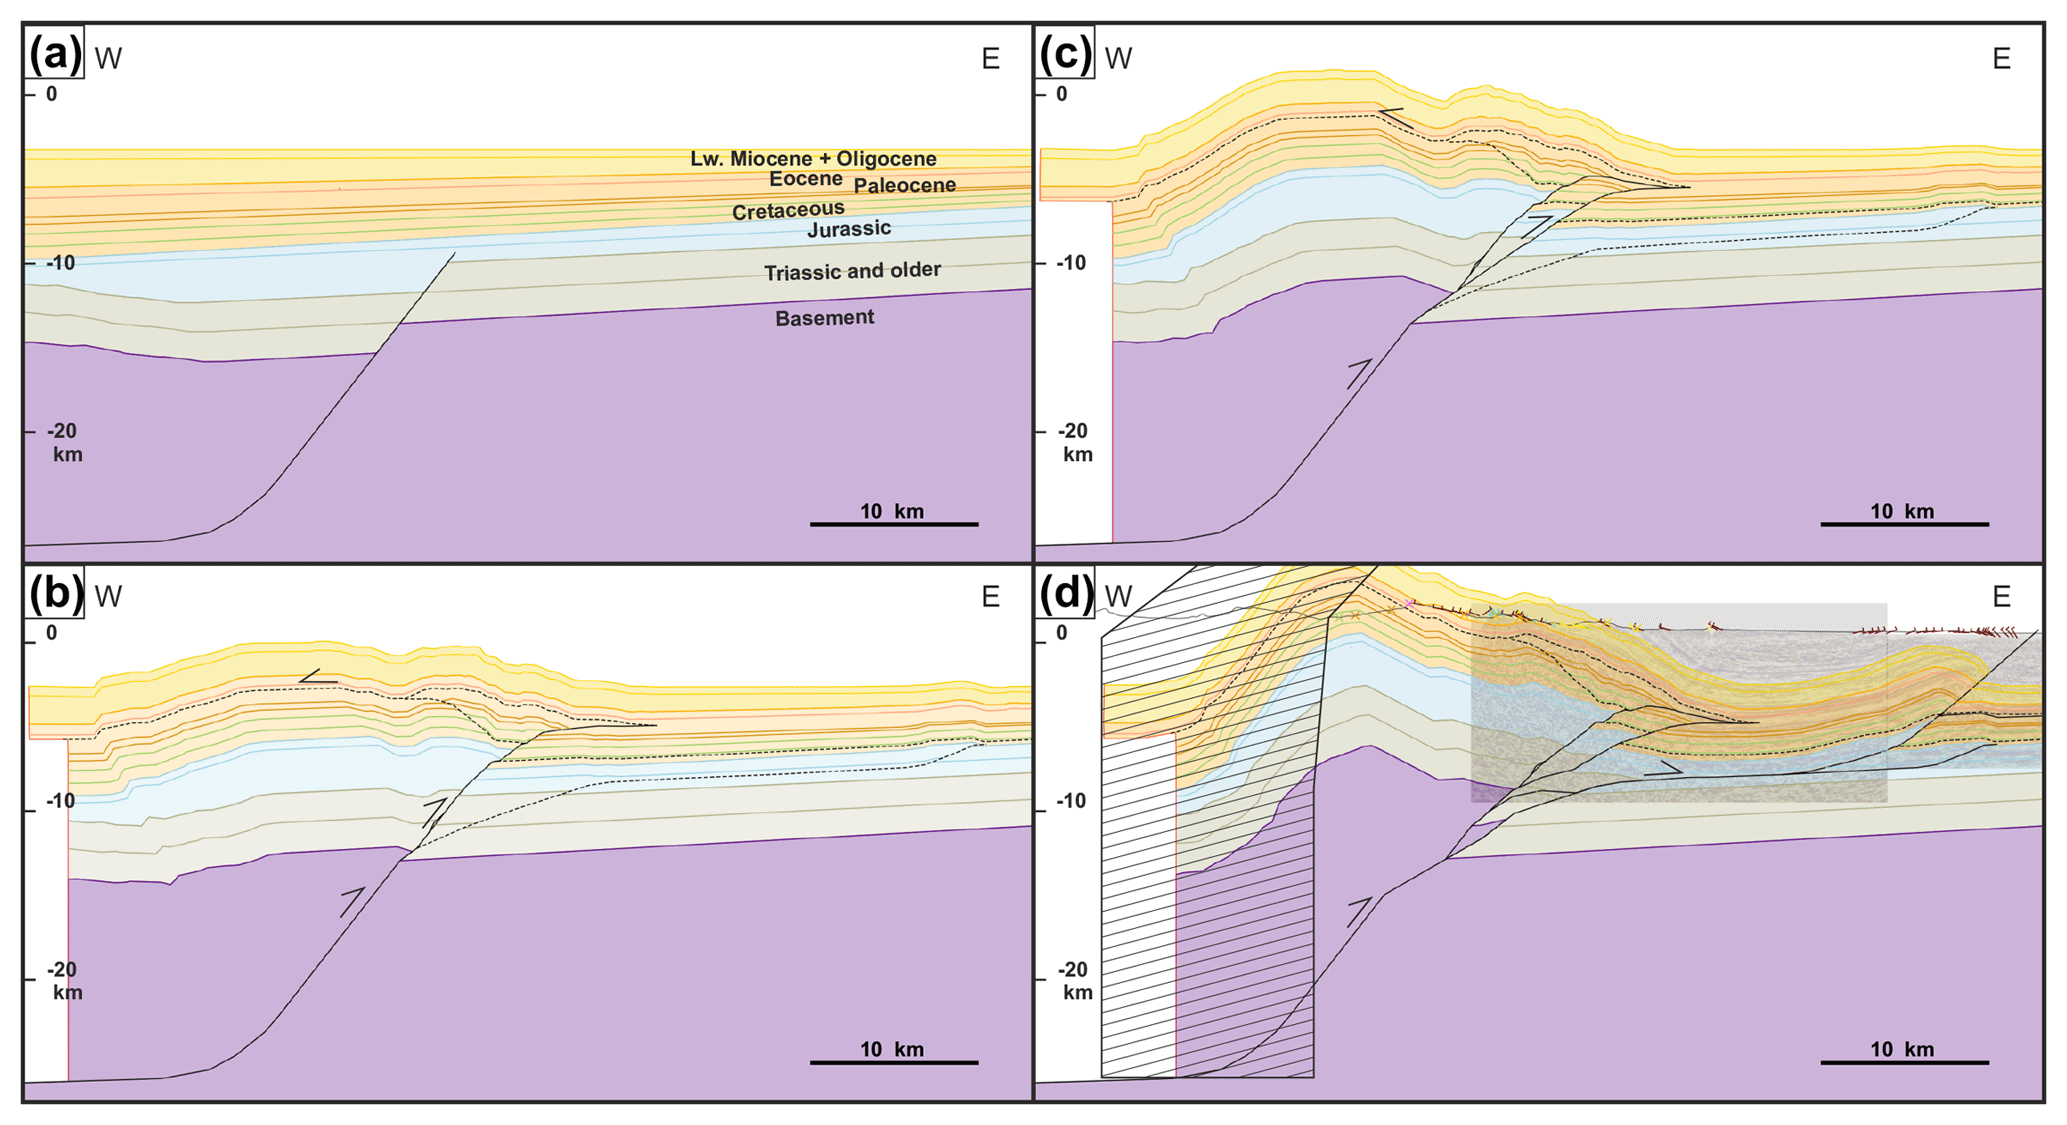
Figure 16Simplified kinematic evolution of the southern sector. (a) Pre-contractional situation with Jurassic normal fault. Thin stippled lines indicate faults of dominant layer-parallel shortening. (c, b) Incremental deformation of imbrication and passive roof thrusting above the inverting normal fault. (d) Final geometry of the kinematic forward model compared to seismic and surface geology. The geometry in the hatched area in the western part of the section does not fit the surface geology and would require additional deformation by inverting faults and cover sediments not regarded in this model.
We use a kinematic forward model (Fig. 16) to test and illustrate how the undeformed (restored) section (Fig. 12b) can develop in a plausible manner into the deformed section (Fig. 12a). The initial configuration of the model has one major normal fault (Fig. 16a) as in the restoration. For simplicity we will assume syn-kinematic growth in the Lower Jurassic formations, although the fault might have been active as a normal fault earlier and later as well (see Sect. 2.2 on tectonostratigraphic evolution). The frontal triangle and the small interpreted back-thrust (corresponding to the wedge modelled in Fig. 11 and the back-thrust east of point i; Fig. 9b) are suggested to have formed in an early deformation phase of dominant wedging and layer-parallel shortening in the section. In the model, this deformation is linked to a slight inversion of the displayed normal fault (Fig. 16b); however, the deformation could also be linked to shortening further in the west, which is transferred via thin-skinned detachments. The generation of the interpreted small passive roof thrusts is considered to be the result of the main inversion of the normal fault generating shortcut faults with a slightly smaller dip angle in the sediments of the footwall. The presence of several weak stratigraphic units allows for some wedging as well as the passive roof back-thrust in the Ghazij shales (Fig. 16b and c). This stage reflects large-scale layer-parallel shortening of the stratigraphy above and/or in front of the inverting normal fault. The youngest deformation is occurring on the thrust in the frontal anticline. In order to explain this we suppose that with increasing inversion above the null point, the stress on the basement in the footwall likely increases and it finally yields. A basement shortcut develops and links with a suitable detachment, generating the frontal anticline (Fig. 16d). With such a kinematic model all the features and constraints visible in the seismic data and at the surface, especially the structural elevation uplift at the Kirthar Escarpment, can all be explained with one major fault inversion (Fig. 16d). West of the Kirthar Escarpment the structural elevation remains relatively high and is not dropping as in the simplified model (Fig. 16d, hatched area). For that area, additional shortening is required to maintain the high structural elevation, which could be related to additional (partly) inverting normal faults, similar to the sketch section in Fig. 2g.
The balanced section in Fig. 12a shows the final interpretation for the seismic line displayed in Fig. 9b, with further details than shown in the kinematic section (Fig. 16). This section is restored to the pre-contractional situation as shown in Fig. 12b. The balanced section has been constructed by line length restoration onto a carefully constructed stratigraphic template that takes well data and regional thickness trends into account. An overall areal balance has been considered. The amount of shortening is about 10 km, corresponding to 20 % between the fixed pin and the loose line. The Eocene and Oligocene strata have shorter line lengths than the older strata due to roof back-thrusting on the Eocene Ghazij shales and subsequent erosion. The loose line in Fig. 12b is not absolutely straight for Paleocene and older horizons, documenting a small remaining error of the order of 1 %, which is within accuracy and meaningful with respect to all uncertainties.
The upper part of the section can be considered well constrained (seismic image, surface geology and well control). The deeper part of the section is constrained by kinematic and balancing considerations (interpretation and kinematic modelling go hand in hand in an iterative process). In detail, there could be other solutions fulfilling the constraints (e.g. a more complex pattern of imbrications and duplexes and other structures accommodating layer-parallel shortening). In that sense, the presented section is a most likely scenario honouring as many constraints as possible and remaining as simple as possible.

Figure 17Simplified kinematic evolution of the northern sector, shown for Eocene to basement rocks. (a) Pre-contractional situation with Jurassic normal faults. Stippled line indicates future shortcut fault. Panels (b) and (c) show increments of inversion with shortcut faulting and detachment folding related to buttressing. (d) Final geometry of the kinematic forward model.
5.5 Northern section kinematic model and balanced section
As demonstrated above, the northern sector is dominated by folding and shows a more gradual rise of the structural elevation towards the west. We interpret the shape of the large anticline in Fig. 9a as a partly uplifted detachment fold (Fig. 13) with plastic deformation in the fold core. In detail, the deformation in the fold core can be accommodated by small-scale thrusts (e.g. fishtail wedges, etc.). The relatively gentler uplift of structural elevation towards the west indicates the presence of several small inverting faults in the basement in comparison to the southern section, as shown in the balanced section (Fig. 13a).
We propose a kinematic evolution that takes a simplified version of the restored section as a starting configuration (Fig. 17). Several half-graben normal faults with thickening strata toward the fault (again in Jurassic for simplicity reasons) are interpreted to be present below some post-rift strata (Fig. 17a). The thick-skinned movement is linked with a thin-skinned décollement close to the base of the sedimentary column (Fig. 17b), a requirement for restoration and balancing (Fig. 13). For simplicity, this step is modelled with one footwall shortcut on the westernmost fault. The large-scale anticline in the northern sector likely starts to grow in this increment. Figure 17b anticipates a buttressing effect of the easternmost fault causing the folding. Alternatively, early inversion movement on this easternmost fault could generate a perturbation in the sedimentary sequence, which is subsequently amplified by shortening that is transferred along the basal décollement. The inversion is modelled with a foreland propagation sequence, although more complex kinematics cannot be ruled out. The second (middle) fault is also modelled with a small footwall shortcut (Fig. 17c). The associated shortening is amplifying the large-scale fold. Some shortening of this increment might cause the observed deformation of stacked wedges (Fig. 10). Finally, the easternmost fault is inverting, including a footwall shortcut that links to the observed frontal structures (Fig. 17d).
In comparison to Fig. 17d the balanced section (Fig. 13a) honours some more details as constrained by the seismic data (Fig. 13a). The section is restored to the pre-contraction geometry shown in Fig. 13b. The method of restoration is the same as for the southern sector. The weak formations have been additionally areally balanced. The amount of shortening is approximately 11.2 km, corresponding to 18 % between the fixed and the loose line. The loose line in Fig. 13b is not absolutely straight, documenting a small remaining error of the order of the (reasonably) achievable accuracy.
In total, the northern section is less constrained than the southern section as the seismic image allows for a wider range of solutions for the deeper geometry. The main uncertainties are the number of basement faults, the amount of initial extensional throw, how many faults and shortcuts are present in the sediments, and the sequence of deformation propagation. The kinematic model in Fig. 13 and the balanced section are thus not unique solutions but provide a satisfactory explanation for the observed structures that is consistent with the mechanical stratigraphy, the regional observations and the local constraints (seismic and surface geology).
In the following section we discuss the implications of the results from the local to regional scale, compare the deformation style to similar fold belts and finally address some uncertainty issues.
6.1 Local paleogeographic controls on deformation
On a local scale the deformation seen in the geological map (Fig. 6) is partly mimicking the original rift geometry. The large-scale folds most likely represent the former location of the main extensional growth grabens. The dominating N–S orientation of fold trends seems to be controlled by the former rift geometry, which apparently has a strong influence on how strain is partitioned on this lateral margin.
In detail, most local differences in the structural style and orientation seem to be based on slight paleogeographic differences as well. Comparing the northern to the southern sectors of the study area, the detachment depth at the trailing edge of thin-skinned deformation is different. In the south, the large syncline (Fig. 9b) indicates a flat segment of the detachment in Lower Jurassic or Triassic rocks. The correlative thrust fault clearly cuts deeper in the north (Figs. 9a, 10, 13). As a consequence, the frontal anticline shows a south-to-north along-strike increase in structural relief. The uplift has been recognized for a long time (wells and the distribution of the existing gas condensate fields), but geometrically it has not been properly investigated. The reason for the along-strike change in the depth of the basal detachment, however, is not known. It may have geometrically related (fault throw, angle, depth) or facies-related (mechanical stratigraphy) reasons. Both, however, would be inherited from the pre-contractional evolution, with the rifting phase likely having the greatest impact.
There is one very clear example of how the long-lived hinge zone and the associated facies changes control the young contractional deformation. The tip of the triangle and duplex in the centre of the southern section is localized at the point at which the Laki Formation limestones (Sui Main limestones, stippled orange line) have their paleo-shelf edge and are replaced laterally by Ghazij Formation shales (Fig. 12a; see also Fig. 9b, point h). The limestones have several hundred metres of thickness in the frontal anticline and are overlain by several tens of metres of Ghazij shales only. West of the Kirthar Escarpment, the Laki Formation–Sui Main limestones are missing; instead, several hundred metres of Ghazij shales are present. The clinoforms of the Sui Main limestones are well imaged (Fig. 9b point h). West of that point most of the Laki Formation is replaced by marls and shales that host the passive roof thrust for the inversion-related footwall duplexes underneath. The juxtaposition of carbonate margins that border basinal facies can localize thrust faults, as has been demonstrated by centrifuge physical modelling (Dixon, 2004).
6.2 Kirthar Fold Belt deformation
Our model of inversion with linked thin-skinned deformation for the central Kirthar Fold Belt is in line with the observations and the model proposed by Smewing et al. (2002a) and Fowler et al. (2004) for the southern Kirthar Fold Belt. In our study we propose a way in which thick-skinned inversion and thin-skinned deformation kinematically link to produce the observed deformation pattern. Our model is also able to explain an observation of Smewing et al. (2002a) in which they describe field evidence of a Jurassic normal fault that is still under net extension, despite the assumed inversion and relatively high structural elevation. Following our model, the upper part of former normal faults could remain in net extension and be significantly uplifted above their original regional elevation due to footwall imbrication and shortcuts (see the former normal faults in Fig. 13). These imbrications, however, do not reach the surface but generate structural wedges with a roof thrust in Ghazij shales. They are unlike the passive roof duplexes originally proposed for the northern Kirthar Fold Belt by Banks and Warburton (1986). Those authors use classical thin-skinned fold–trust belt geometries based on the sequential imbrication of the foreland sequence above a pre-Jurassic continuous planar detachment horizon. Their roof thrusts are localized in Ghazij shales and further towards the hinterland in Goru Formation shales. Shortening in such a system often approaches 40 %–50 %, a value much higher than the shortening observed in the central (our study) and southern Kirthar Fold Belt (Fowler et al., 2004). The large-scale map pattern does not significantly change from our study area towards the northern Kirthar Fold Belt. We propose that the deformation observed in the northern Kirthar Fold Belt (e.g. Banks and Warburton, 1986) could also be caused by linked thick-skinned- and thin-skinned-related deformation, as the thin-skinned solution has significant regional balance problems. The modelled fault shape responsible for the 1931 Mach earthquake studied by Szeliga et al. (2009) comprises a thrust fault up-dip of a steep thrust ramp section that links to a deeper décollement, either in thick sediments or in the basement (see Fig. 2d). The general structure is similar to what we interpret at the deformation front in the central Kirthar Fold Belt. The linkage between a relatively steep, deep-reaching fault and a more shallow dipping frontal thrust can be interpreted as the potential transition from a thick-skinned (inverted?) fault at the frontal thin-skinned system. Similarly, the thin-skinned deformation observed by Schelling (2000; see Fig. 2f) can be put into this context. The sections investigated by Shelling are relatively short and thus only cover the leading-edge margin of the thin-skinned deformation. Thus, no major south-to-north discrepancies in shortening values need to be considered for the Kirthar Fold Belt. The deformation style does not necessarily vary dramatically; however, the way the shortening is accommodated is considered to be controlled by local inherited structures.
6.3 Possible lithospheric inheritance of the inversion belt
It is important to briefly discuss some potential reasons why the central Kirthar Fold Belt is dominated by inversion with thin-skinned deformation instead of following a classical thin-skinned fold–thrust belt model. The importance of a structural inheritance from rifting for the Kirthar Fold Belt has already been proposed by Smewing et al. (2002a). However, most pro-wedge thrust belts affect areas which went through rifting and passive margin settings before collision. Whether the continental margin in the collision phase evolves into a dominated system of thin-skinned or thick-skinned deformation depends on several factors.
The presence of a weak (ductile) middle or lower crust seems to be a key factor which allows for distributed deformation through most of the crust, which results in the formation of fold–thrust belts with a dominant, primarily thick-skinned character (Lacombe and Bellahsen, 2016). Thermally weakened shear zones might be conserved in less extended proximal continental margins, which can also influence the deformation style. Weak crustal levels are often lacking in distal parts of the margins as a result of the rheological evolution of the rifted margin over time (Perez-Gussinye and Reston, 2001; Cloetingh et al., 2005; Reston and Manatschal, 2011). The resulting stronger lithospheric domains are more prone to localized deformation in a continental subduction style (Lacombe and Bellahsen, 2016). Thus, the relative position and the time since rifting apparently play a role in determining in which mode the convergent deformation will reactivate structures.
We therefore speculate that the inversion-dominated central Kirthar Fold Belt represents the inner part of the continental margin in which a weak continental crust is still present. The long-lived hinge line observed in several facies associations is interpreted to approximately reflect the limit of major post-rift subsidence and the eastern border of the extended lithosphere (assuming pure shear). The more than 100 km wide area east of the dominating strike-slip faults (Chaman and Ghazaband faults; Fig. 1) could be considered to have initially accommodated the shortening component of transpression and hence show inversion where suitable faults are located. Sustained deformation should have rotated faults and folds closer to the margin. We infer that this large area shares a similar rheology inherited from Gondwana and the break-up phase. The width of this zone might indicate that the lithosphere rifted in a wide rift mode (Buck, 1991) before continental break-up to the west. Consequently, there should be a narrow zone of highly extended crust (external rifted margin) present west of the inversion belt. Today this zone is covered by flysch sediments and bracketed between the Ghazaband and Chaman faults (Bannert et al., 1992, Fig. 3). How much of the former external rifted margin has been subducted or laterally displaced along the strike-slip faults remains difficult to estimate and is beyond the scope of this paper. Interestingly, further to the north in the Pamir area earthquake tomography data are interpreted to show delamination and rollback of the Indian Plate lithosphere (Kufner et al., 2016). India's thinned western continental margin separates from cratonic India and subducts beneath Asia, while the buoyant northwestern salient of cratonic India bulldozes into cratonic Asia (Kufner et al., 2016).
6.4 Hybrid thick- and thin-skinned systems in other areas
Thick-skinned inversion of passive margin or intra-cratonic rifts is considered to be present in 50 % of orogens with documented deformation style (Nemčok et al., 2013). There are various possibilities related to how thick-skinned deformation can contribute to the deformation of a fold–thrust belt (see recent review of Lacombe and Bellahsen, 2016, and references therein). Here, we briefly compare the deformation style elaborated for the central Kirthar Fold Belt with other well-constrained examples of linked inversion with thin-skinned deformation.
For the Malargüe fold–thrust belt, Giambiagi et al. (2008) revealed that the reactivation of normal faults was coeval with the activation of shallow detachments and low-angle thrusting at the thrust front with several faults moving at the same time in some portions. Also for the Malargüe fold–thrust belt Fuentes et al. (2016) work out the geometric relationships of the hybrid system with a series of detailed sections based on surface geology, seismic and well data through that thrust belt. Their section E shows strong similarities with the deformation style in the southern section of our study, especially the imbrication of sediments in the footwall with duplexes and a passive roof thrust on top. Recently, Mahoney et al. (2017) proposed a very similar deformation for the eastern Muller Range in the Papuan Fold Belt in Papua New Guinea. There, the Cenozoic carbonates are shortened to around 13 %–21 % but are partly uplifted up to 7 km above regional elevation. Mesozoic rift faults, partly inverting and partly linking to thin-skinned detachments, are considered to exert the major control on deformation. Triangular structures and back-thrusts are considered transient deformation steps related to the uplift and erosion history, while the deformation accumulates before linking to the frontal deformation structures (Mahoney et al., 2017). The proposed deformation is very similar to the style we consider for the central Kirthar Fold Belt. In our example the presence of a complex mechanical stratigraphy with several detachment horizons in the stratigraphic column seems to produce even more complex geometries than in the example from Papua New Guinea.
6.5 Uncertainty
Basement involvement is very often used in a balanced section to account for high structural elevation towards the hinterland. However, for a relatively small uplift of structural elevation the thick-skinned explanation is often ambiguous, as there are often several alternative possibilities which are not investigated (e.g. strong wedging of the pre-kinematic sedimentary sequence, change in basal detachment depth, change in basement dip, etc.).
Recently, Butler et al. (2018) demonstrated for several reviewed sections that there is a substantially greater range of solutions available for interpreting the geometry and evolution of thrust belt structures than implied by the original idealized models. For a specific section in the Papuan Fold Belt two realizations are available by different authors: one with thin-skinned and one with inversion-style tectonics (e.g. Hill, 1997; Buchanan and Warburton, 1996; see also Butler et al., 2018). Similarly, there is some discussion on the contribution of thick-skinned deformation below the different segments of the Zagros Fold Belt (see discussions in Lacombe and Bellahsen, 2016; Hinsch and Bretis, 2015, for the mountain front flexure).
In order to overcome limitations from single deterministic geometries, Butler et al. (2018) propose good documentation, alternative models and embracing the uncertainties. In this work, we show the original seismic data, review in detail the regional to local context and use these as arguments why we think our presented deformation model is the most plausible for the central Kirthar Fold Belt. We do not show alternative models, but we highlight our workflow, the considered constraints and indicate uncertainties of the sections. The contribution of deep founded faults with associated thin-skinned deformation can be considered reliable, and the pure thin-skinned deformation style can be considered obsolete. Based on several observations (folding pattern, fold orientation, focal mechanism) this thick-skinned deformation is interpreted to invert inherited zones of weakness from the rift phase that generated the lateral margin of India. This model is very likely, but it remains a conclusion rather than a direct observation. On the other hand, we think it will be difficult to find a solution much different from our presented model that will honour all the constraints. In detail, the interpreted and constructed sections are as good as the constraints allow and thus still have several sub-solutions. How much change in our model is a new solution or just a modification is a matter of definition and is also scale dependent. The amount of uncertainty in the sections thus also depends on the level of observation.
Large-scale strain partitioning along the western Indian Plate leads to major left-lateral strike-slip faulting close to the plate margin as well as to NW–SE to W–E shortening close to the deformation front of the Kirthar Fold Belt. We analyse regional (geological maps, focal mechanisms,) to local (reflection seismic and well data, surface geology) data at the front of the central fold belt to constrain the structural architecture and style. The deformation is most probably controlled by the inversion of inherited rift faults, likely of Jurassic age, which are buried underneath the sediments. The young shortening on the rift faults is coupled with thin-skinned deformation by imbricating and shortcutting into the footwall and transferring some shortening onto suitable detachment horizons. As a consequence, large-scale folds build as a result of the thick-skinned inversion, while smaller-scale folds and thin-skinned deformation form above and in front. In the southern sector a structural elevation gain of approximately 6500 m across one large monocline clearly indicates the influence of the deep-seated faulting. Towards the north the structural elevation gain is distributed across several folds indirectly related to several inverting faults at depth. The main control on deformation is considered to be the presence and orientation of the pre-shortening rift faults and half-grabens. In addition, the rift and post-rift history resulted in some prominent east-to-west proximal-to-distal facies trends being reflected in a heterogeneous mechanical stratigraphy, which is responsible for the deformation style of the thin-skinned structures.
The hybrid deformation style of thin-skinned to thick-skinned deformation is also present in other fold–thrust belts around the world with hydrocarbon resources. Combining as many constraints as possible from regional to local scale facilitates the development of plausible structural models and the assessment of uncertainties. The importance of understanding the structural architecture and kinematics is of paramount importance for the successful exploration of these resources.
The reflection seismic lines and the well data are confidential industry data and cannot currently be publically accessed due to business interests.
The supplement related to this article is available online at: https://doi.org/10.5194/se-10-425-2019-supplement.
RH, MN and MAA conducted the fieldwork. All authors interpreted seismic, well and surface geological data and contributed to discussions leading to the final geological concept. RH conducted the structural modelling. RH and CA compiled the figures and wrote the paper.
The authors declare that they have no conflict of interest.
Several colleagues or former colleagues at OMV Pakistan contributed feedback, local knowledge and assistance in the course of the project: Waqas Ahmed, Muhammad Aamir Rasheed and Muhammad Ibrahim. Colleagues at OMV in Vienna were also involved in the project or contributed through discussions: Zsolt Schleder, Peter Hagedorn, Klaus Pelz, Wolfgang Thöny, Bernhard Bretis, James M. Kiely, Noah Stevens and Maziar Haghighi. Cameron Sheya is thanked for proofreading and language improvements to an earlier version of the paper. The Mehar EL Joint Venture (OMV Pakistan/UEP, OPL, ZPCL, GHPL) is thanked for the permission and opportunity to publish the study. The comments by an anonymous reviewer as well as the constructive review by Jonas Kley significantly improved the final paper.
This paper was edited by Mark Allen and reviewed by Jonas Kley and one anonymous referee.
Ahmad, A., Ali, M., Baitu, A. H., and Sardar, N.: Tectono-Stratigraphic Model for Ghazij Formation and its Implication on Hydrocarbon Exploration in Kirthar Foldbelt, Pakistan, AAPG Search and Discovery Article #90155, AAPG International Conference & Exhibition, Singapore, 16–19 September 2012, 20 pp., 2012.
Ambraseys, N. and Bilham, R.: Earthquakes and associated deformation in northern Baluchistan, B. Seismol. Soc. Am., 93, 1573–1605, 2003.
Banks, C. J. and Warburton, J.: “Passive-roof” duplex geometry in the frontal structures of the Kirthar and Sulaiman mountain belt, Pakistan, J. Struct. Geol., 8, 229–237, 1986.
Bannert, D., Cheema, A., Ahmed, A., and Schafer, U.: The structural development of the western fold belt, Pakistan, Geologisches Jahrbuch Reihe B, 80, 3–60, 1992.
Buchanan, P. G. and Warburton, J.: The influence of pre-existing basin architecture in the development of the Papuan fold and thrust belt: implications for petroleum prospectivity, on: Petroleum Exploration, Development and Production in Papua New Guinea, edited by: Buchanan, P. G., Proceedings of the Third PNG Petroleum Convention, Port Moresby, 89–109, 1996.
Buck, W. R.: Modes of continental lithospheric extension, J. Geophys. Res., 96, 20161–20178, https://doi.org/10.1029/91JB01485, 1991.
Butler, R. W. H., Bond, C. E., Cooper, M. A., and Watkins, H.: Interpreting structural geometry in fold-thrust belts: Why style matters, J. Struct. Geol., 114, 251–273, https://doi.org/10.1016/j.jsg.2018.06.019, 2018.
Cloetingh, S., Ziegler, P., Beekman, F., Andriessen, P., Matenco, L., Bada, G., Garcia-Castellanos, D., Hardebol, N., Dezes, P., and Sokoutis, D.: Lithospheric memory, state of stress and rheology: neotectonic controls on Europe's intraplate continental topography, Quaternary Sci. Rev., 24, 241–304, 2005.
Cooper, M. A., Williams, G. D., de Graciansky, P. C., Murphy, R. W., Needham, T., de Paor, D., Stoneley, R., Todd, S. P., Turner, J. P., and Ziegler, P. A.: Inversion tectonics – a discussion, in: Inversion Tectonics, edited by: Cooper, M. A. and Williams, G. D., Geol. Soc. Spec. Publ., 44, 335–347, 1989.
Dahlen, F. A., Suppe, J., and Davis, D. M.: Mechanics of fold-and-thrust belts and accretionary wedges (continued): Cohesive Coulomb Theory, J. Geophs. Res., 89, 10087–10101, 1984.
Dixon, J. M.: Physical (centrifuge) modeling of fold-thrust shortening across carbonate bank margins–timing, vergence, and style of deformation, in: Thrust tectonics and hydrocarbon systems, edited by: McClay, K. R., AAPG Memoir., 82, 223–238, 2004.
Epard, J.-L. and Groshong, J. H.: Excess Area and Depth to Detachment, AAPG Bull., 77, 1291–1302, 1993.
Eschard, R., Albouy, E., Gaumet, F., and Ayub, A.: Comparing the depositional architecture of basin floor fans and slope fans in the Pab Sandstone, Maastrichtian, Pakistan, in: Continued turbidite systems, edited by: Lomas, S. A. and Joseph, P., Geol. Soc. Spec. Publ., 222, 159–185, 2004.
Fowler, J. N., Graham, R., Sassi, W., Smewing, J. D., and Warburton, J.: Two-dimensional kinematic modeling of the southern Kirthar fold belt, Pakistan, in: Deformation, fluid flow, and reservoir appraisal in foreland fold and thrust belts, edited by: Swennen, R., Roure, F., and Granath, J. W., AAPG Hedberg Series, no. 1, 117–131, 2004.
Fossen, H., Tikoff, T. B., and Teyssier, C. T.: Strain modeling of transpressional and transtensional deformation, Norsk Geol. Tidsskr., 74, 134–145, 1994.
Fuentes, F., Horton, B., Starck, D., and Boll, A.: Structure and tectonic evolution of hybrid thick- and thin-skinned systems in the Malargüe fold–thrust belt, Neuquén basin, Argentina, Geol. Mag., 153, 1066–1084, https://doi.org/10.1017/S0016756816000583, 2016.
Giambiagi, L., Bechis, F., García, V., and Clark, A. H.: Temporal and spatial relationships of thick- and thinskinned deformation: A case study from the Malargüe fold-and-thrust belt, southern Central Andes, Tectonophysics, 459, 123–139, https://doi.org/10.1016/j.tecto.2007.11.069, 2008.
Hinsch, R. and Bretis, B.: A semi-balanced section in the northwestern Zagros region: Constraining the structural architecture of the Mountain Front Flexure in the Kirkuk Embayment, Iraq, GeoArabia, 20, 41–62, 2015.
Hill, K.C.: Structure of the Papuan fold belt, Papua New Guinea, AAPG Bull., 75, 857–872, 1991.
Harrison, J. V. and Falcon, N. L.: Collapse Structures, Geol. Mag., 71, 529–539, https://doi.org/10.1017/S0016756800095005, 1934.
Harrison, J. V. and Falcon, N. L.: Gravity collapse structures in mountain ranges, as exemplified in south-western Persia, Quarterly Journal Geological Society of London, 92, 91–102, 1936.
Hayward, A. B. and Graham, R. H.: Some geometrical characteristics of inversion, in: Inversion Tectonics, edited by: Cooper, M. A. and Williams, G. D., Geol. Soc. Spec. Publ., 44 335–347, 1989.
Humayon, M., Lillie, R. J., and Lawrence, R. D.: Structural interpretation of eastern Sulaiman foldbelt and foredeep, Pakistan, Tectonics, 10, 299–324, 1991.
International Seismological Centre: Internatl. Seismol. Cent., Thatcham, UK, Online Bulletin, available at: http://www.isc.ac.uk (last access: 18 April 2018), 2015.
Jadoon, I. A. K., Lawrence, R. D., and Lillie, R. J.: Balanced and retrodeformed geological cross-section from the frontal Sulaiman Lobe, Pakistan: Duplex development in thick strata along the western margin of the Indian plate, in: Thrust tectonics and hydrocarbon systems, edited by: McClay, K. R., AAPG Memoir., 82, 343–356, 1992.
Jadoon, I. A. K., Lawrence, R. D., and Lillie, R. J.: Evolution of foreland structures: an example from the Sulaiman thrust lobe of Pakistan, southwest of the Himalayas, Geol. Soc. Spec. Publ., 74, 589–602, 1993.
Jarvis, A., Reuter, H. I., Nelson, A., and Guevara, E.: Hole-filled seamless SRTM data V4, International Centre for Tropical Agriculture (CIAT), available at: http://srtm.csi.cgiar.org (last access: 19 January 2017), 2008.
Kadri, I. B.: Petroleum Geology of Pakistan. Pakistan Petroleum Limited, Karachi, Pakistan, 275 pp., 1995.
Khan, S. D., Walker, D. J., Hall, S. A., Burke, K. C., Shah, M. T., and Stockli, L.: Did the Kohistan-Ladakh island arc collide first with India?, GSA Bulletin, 121, 366–384, 2009.
Kufner, S.-K., Schurr, B., Sippl, C., Yuan, X., Ratschbacher, L., Akbar, M., Ischuk, A., Murodkulov, S., Schneider, F., Mechie, J., and Tilmann, F.: Deep India meets deep Asia: Lithospheric indentation, delamination and break-off under Pamir and Hindu Kush (Central Asia), Earth Planet. Sc. Lett., 435, 171–184, https://doi.org/10.1016/j.epsl.2015.11.046, 2016.
Lacombe, O. and Bellahsen, N.: Thick-skinned tectonics and basement-involved fold–thrust belts: insights from selected Cenozoic orogens, Geol. Mag., 153, 763–810, https://doi.org/10.1017/S0016756816000078, 2016.
Lawrence, R. D., Yeats, R. S., Khan, S. H., Farah, A., and DeJong, K. A.: Thrust and strike slip fault interaction along the Chaman transform zone, Pakistan, Geol. Soc. Spec. Publ., 9, 363–370, 1981.
Lentas, K., Di Giacomo, D., Harris, J., and Storchak, D.: The ISC Bulletin as a comprehensive source of earthquake source mechanisms, Earth Syst. Sci. Data Discuss., https://doi.org/10.5194/essd-2018-143, in review, 2018.
Mahoney, L., Hill, K., McLaren, S., and Hanani, A.: Complex fold and thrust belt structural styles: Examples from the Greater Juha area of the Papuan Fold and Thrust Belt, Papua New Guinea, J. Struct. Geol., 100, 98–119, https://doi.org/10.1016/j.jsg.2017.05.010, 2017.
Midland Valley: Move Software, Midland Valley Exploration Ltd, Glasgow, UK, 2016.
Mohadjer, S., Bendick, R., Ischuk, A., Kuzikov, S., Kostuk, A., Saydullaev, U., Lodi, S., Kakar, D. M., Wasy, A., Khan, M. A., Molnar, P., Bilham, R., and Zubovich, A. V.: Partitioning of India–Eurasia convergence in the Pamir-Hindu Kush from GPS measurements, Geophys. Res. Lett., 37, L04305, https://doi.org/10.1029/2009GL041737, 2010.
Nemčok, M., Mora, A., and Cosgrove, J.: Thick-skin-dominated orogens; from initial inversion to full accretion: an introduction, in: Thick-Skin-Dominated Orogens: From Initial Inversion to Full Accretion, edited by: Nemčok, M., Mora A., and Cosgrove, J., Geol. Soc. Spec. Publ., 377, 1–17, 2013.
Pérez-Gussinyé, M. and Reston, T. J.: Rheological evolution during extension at passive non-volcanic margins: onset of serpentinization and development of detachments to continental break-up, J. Geophys. Res., 106, 3691–3975, 2001.
Reston, T. and Manatschal, G.: Rifted margins: building blocks of later collision, in: Arc-Continent Collision: Frontiers in Earth Sciences, edited by: Brown, D. and Ryan, P. D., Springer-Verlag, Berlin, 3–21, 2011.
Reynolds, K., Copley, A., and Hussain, E.: Evolution and dynamics of a fold-thrust belt: the Sulaiman Range of Pakistan, Geophys. J. Int., 201, 683–710, 2015.
Sanderson, D. and Marchini, R. D.: Transpression, J. Struct. Geol., 6, 449–458, 1984.
Schelling, D. D.: Frontal structural geometries and detachment tectonics of the northeastern Karachi arc, southern Kirthar Range, Pakistan, in: Himalaya and Tibet: Mountain Roots to Mountain Tops, edited by: Macfarlane, A., Sorkhabi, R. B., and Quade, J., Geol. S. Am. S., 328, 287–302, https://doi.org/10.1130/0-8137-2328-0.287, 1999.
Schreurs, G. and Colleta, B.: Analogue modelling of faulting in zones of continental transpression and transtension, in: Continental Transpressional and Transtensional Tectonics, edited by: Holdsworth, R. E., Strachan, R. A., and Dewey, J. F., Geol. Soc. Spec. Publ., 195, 59–79, 1998.
Scotese, C. R.: The PALEOMAP Project PaleoAtlas for ArcGIS, version 1, Volume 3, Triassic and Jurassic Paleogeographic and Plate Tectonic Reconstructions, Maps 32–48, PALEOMAP Project, Evanston, IL, https://doi.org/10.13140/RG.2.1.4108.5685, 2014a.
Scotese, C. R.: The PALEOMAP Project PaleoAtlas for ArcGIS, version 1, Volume 2, Cretaceous Paleogeographic and Plate Tectonic Reconstructions, Maps 16–31, PALEOMAP Project, Evanston, IL, https://doi.org/10.13140/RG.2.1.2011.4162, 2014b.
Scotese, C. R.: The PALEOMAP Project PaleoAtlas for ArcGIS, version 1, Volume 1, Cenozoic Paleogeographic and Plate Tectonic Reconstructions, Maps 1–15, PALEOMAP Project, Evanston, IL, https://doi.org/10.13140/RG.2.1.2535.7041, 2014c.
Scotese, C. R.: PALEOMAP PaleoAtlas for GPlates and the PaleoData Plotter Program, PALEOMAP Project, available at: http://www.earthbyte.org/paleomap-paleoatlas-for-gplates (last access: 20 April 2018), 2016.
Smewing, J. D., Warburton, J., Cernuschi, A., and Ul-Haq, N.: Structural inheritance in the southern Kirthar fold belt: Soc. Petrol. Eng. Pakistan Association of Petroleum Geologists, 26–34, 2002a.
Smewing, J. D., Warburton, J., Daley, T., Copestake. P., and Ul-Haq, N.: Sequence stratigraphy of the southern Kirthar Fold Belt and Middle Indus Basin, Pakistan, in: The Tectonic and Climatic Evolution of the Arabian Sea Region, edited by: Clift, P. D., Kroon, D., Gaedicke, C., and Craik, J., Geol. Soc. Spec. Publ., 195, 273–299, 2002b.
Smith, A. G.: A review of the Ediacaran to Early Cambrian (“Infra-Cambrian”) evaporites and associated sediments of the Middle East, Geol. Soc. Spec. Publ., 366, 229–250, 2012.
Suppe, J.: Absolute fault and crustal strength from wedge tapers, Geology, 35, 1127–1130, 2007.
Szeliga, W., Bilham, R., Schelling, D., Kakar, D. M., and Lodi, S.: Fold and thrust partitioning in a contracting fold belt: insights from the 1931 Mach earthquake in Baluchistan, Tectonics, 28, TC5019, https://doi.org/10.1029/2008TC002265, 2009.
Wandrey, C. J., Law, B. E., and Shah, H. A.: Sembar-Goru/Ghazij Composite Total Petroleum System, Indus and Sulaiman-Kirthar Geologic Provinces, Pakistan and India, in: Petroleum Systems and Related Geologic Studies in Region 8, South Asia, edited by: Wandrey, C. J., U.S. Geological Survey Bulletin, 2208-C, 23 pp., 2004.
Yamada, Y. and McClay, K.: 3-D Analog modeling of inversion thrust structures, in: Thrust tectonics and hydrocarbon systems, edited by: McClay, K. R., AAPG Memoir., 82, 276–301, 2004.
Zaigham, N. A. and Mallick, K. A.: Prospect of Hydrocarbon Associated with Fossil-Rift Structures of the Southern Indus Basin, Pakistan, AAPG Bull., 84, 1833–1848, 2000.