the Creative Commons Attribution 4.0 License.
the Creative Commons Attribution 4.0 License.
 | 03 Apr 2019
Ionian Abyssal Plain: a window into the Tethys oceanic lithosphere
Heidrun Kopp
Frauke Klingelhoefer
Dirk Klaeschen
Marc-André Gutscher
Anne Krabbenhoeft
David Dellong
Marzia Rovere
David Graindorge
Cord Papenberg
Ingo Klaucke
The nature of the Ionian Sea crust has been the subject of scientific debate for more than 30 years, mainly because seismic imaging of the deep crust and upper mantle of the Ionian Abyssal Plain (IAP) has not been conclusive to date. The IAP is sandwiched between the Calabrian and Hellenic subduction zones in the central Mediterranean. A NNE–SSW-oriented 131 km long seismic refraction and wide-angle reflection profile, consisting of eight ocean bottom seismometers and hydrophones, was acquired in 2014. The profile was designed to univocally confirm the proposed oceanic nature of the IAP crust as a remnant of the Tethys and to confute its interpretation as a strongly thinned part of the African continental crust. A P-wave velocity model developed from travel-time forward modelling is refined by gravimetric data and synthetic modelling of the seismic data. A roughly 6–7 km thick crust with velocities ranging from 5.1 to 7.2 km s−1, top to bottom, can be traced throughout the IAP. In the vicinity of the Medina seamounts at the southern IAP boundary, the crust thickens to about 9 km and seismic velocities decrease to 6.8 km s−1 at the crust–mantle boundary. The seismic velocity distribution and depth of the crust–mantle boundary in the IAP document its oceanic nature and support the interpretation of the IAP as a remnant of the Tethys lithosphere with the Malta Escarpment as a transform margin and a Tethys opening in the NNW–SSE direction.
- Article
(7204 KB) - Full-text XML
- BibTeX
- EndNote


Starting back in the Cretaceous the ongoing convergence between the African and Eurasian plates results in a complex tectonic setting in the central Mediterranean Sea. This complexity includes segmented and strongly curved subduction zones, shortening of overriding plates, subduction rollback, the formation of extensional back-arc basins, and the existence of several proposed continental or oceanic microplates (e.g. Dewey et al., 1989; Faccenna et al., 2001, 2014; Stampfli et al., 2002; Polonia et al., 2016; Barreca et al., 2016, and references therein). However, seismicity and geodesy measurements show that strain is concentrated in narrow bands bounding the microplates that are moving independently from the overall convergent motion (Faccenna et al., 2014). The lithosphere of the Ionian Sea constitutes one of these microplates, for which the long-lasting contradictions in the interpretations of the nature of the Ionian Sea crust (“oceanic” vs. “thinned continental”) result from a lack of conclusive imaging of the deep crust and upper mantle, preventing a clear characterization. Of special difficulty is the Messinian evaporite unit, which massively impedes seismic energy penetration and hence limits the data quality of geophysical imaging methods. The challenges in imaging have ignited a long-standing debate about the deeper structure and the nature of the crust and lithosphere of the Ionian Abyssal Plain (IAP). The interpretations range from continental or hyperextended continental lithosphere (Finetti and Morelli, 1973; Cloething et al., 1980; Baldi et al., 1982; Makris et al., 1986; Ferrucci et al., 1991; Cernobori et al., 1996; Mantovani et al., 2002; Hieke et al., 2003; Roure et al., 2012) to oceanic or atypical oceanic lithosphere (Finetti, 1981, 1982, 2003; Finetti et al., 1996; Makris et al., 1986; Leister et al., 1986; de Voogd et al., 1992; Faccenna et al., 2001, 2004; Catalano et al., 2001; Gallais et al., 2011, 2012; Speranza et al., 2012; Dellong et al., 2018). A new feature was added to the discussion by Polonia et al. (2017) interpreting diapiric structures to be constructed of serpentine, similar to findings in the back-arc basin of the Tyrrhenian Sea (Prada et al., 2016). If this is true, serpentine should be present in the subducting Ionian plate.
Finetti (1982) used geological, geophysical, and drilling exploration data to infer that the crust in the IAP is of oceanic type adjacent to continental crust. The IAP was interpreted to consist of oceanic type crust by a two-ship deep refraction and reflection seismic experiment (de Voogd et al., 1992). Oceanic crust east of the Malta Escarpment is inferred from the deep reflection seismic CROP lines M23A and M3 (Finetti, 2003). Furthermore, time and pre-stack depth-migrated reflection seismic data (Gallais et al., 2011, 2012) and magnetic anomaly data (Speranza et al., 2012) indicated oceanic crust within the IAP. Contrasting interpretations are based on echo sounding and seismic reflection data (Hieke et al., 2003) and a paleo-geographic analysis of faults (Roure et al., 2012), interpreting the crust of the IAP to be of continental type. While the majority of studies today infer an oceanic type of crust in the IAP (LeBreton et al., 2017; Dellong et al., 2018), robust information on the crustal structure of the IAP, including Moho depth and seismic velocities, to confirm the oceanic nature of the crust are still sparse.
Understanding the geodynamic evolution and intricate interplay between continental and oceanic fragments hence requires exact knowledge of the crustal and lithospheric structures. Given its location in the central Mediterranean Sea, the Ionian Sea is a key element in reconstructing the kinematic evolution of the central–eastern Mediterranean (Finetti, 1982). To fill this gap, RV Meteor cruise M111 in 2014 targeted the crustal and lithospheric structure of the Ionian Abyssal Plain (Fig. 1). Along line DY-05, modern seismic refraction and wide-angle reflection data were acquired using four ocean bottom seismometers (OBSs) and four ocean bottom hydrophones (OBHs). The aim of this work is to provide information on the seismic velocity distribution and crustal structure to assess the debate on the nature of the lithosphere in the IAP.
The Ionian Sea and its abyssal plain are sandwiched between the Calabrian (CSZ) and Hellenic (HSZ) subduction zones in the central–eastern part of the Mediterranean basin (Fig. 1). The IAP comprises an asymmetric basin of approximately 600 km length and 330 km width with water depth reaching ∼4100 m in its central part. Its lithosphere is actively subducting underneath Eurasia along both subduction zones, causing a high potential for devastating earthquakes and tsunamis. Both subduction zones are characterized by large accretionary prisms (Calabrian Arc to the north and western Mediterranean Ridge (WMR) to the east), which have advanced into the Ionian Sea and cover vast parts of the IAP. Imaging of the Ionian lithosphere is difficult because of the voluminous sedimentary cover of the accretionary prism (Dellong et al., 2018), which furthermore is underlain by a thick sequence of Messinian evaporites (Ryan et al., 1982). Only a relatively small “window” of approximately 100 km length and 60 km width remains undisturbed by the highly deformed accreted sequences advancing from the north and east or by the Medina seamount cluster of volcanic origin found to the south (Finetti, 1982). To the south and west, the Ionian Sea is bounded by the continental platforms of Libya and the Malta–Hyblean plateau, respectively. The transition from the deep-ocean environment of the IAP to the shallow-water carbonate platform of the continental Malta–Hyblean plateau is marked by the Malta Escarpment (Micallef et al., 2016). This distinct, 290 km long and 3.2 km high scarp is described as an inherited transform margin from the early Mesozoic (Argnani and Bonazzi, 2005; Micallef et al., 2016; Dellong et al., 2018) that traces the transition from the oceanic domain of the Ionian Sea to the Tertiary–Quaternary continental foreland domain of the Pelagian platform (Barreca et al., 2016).
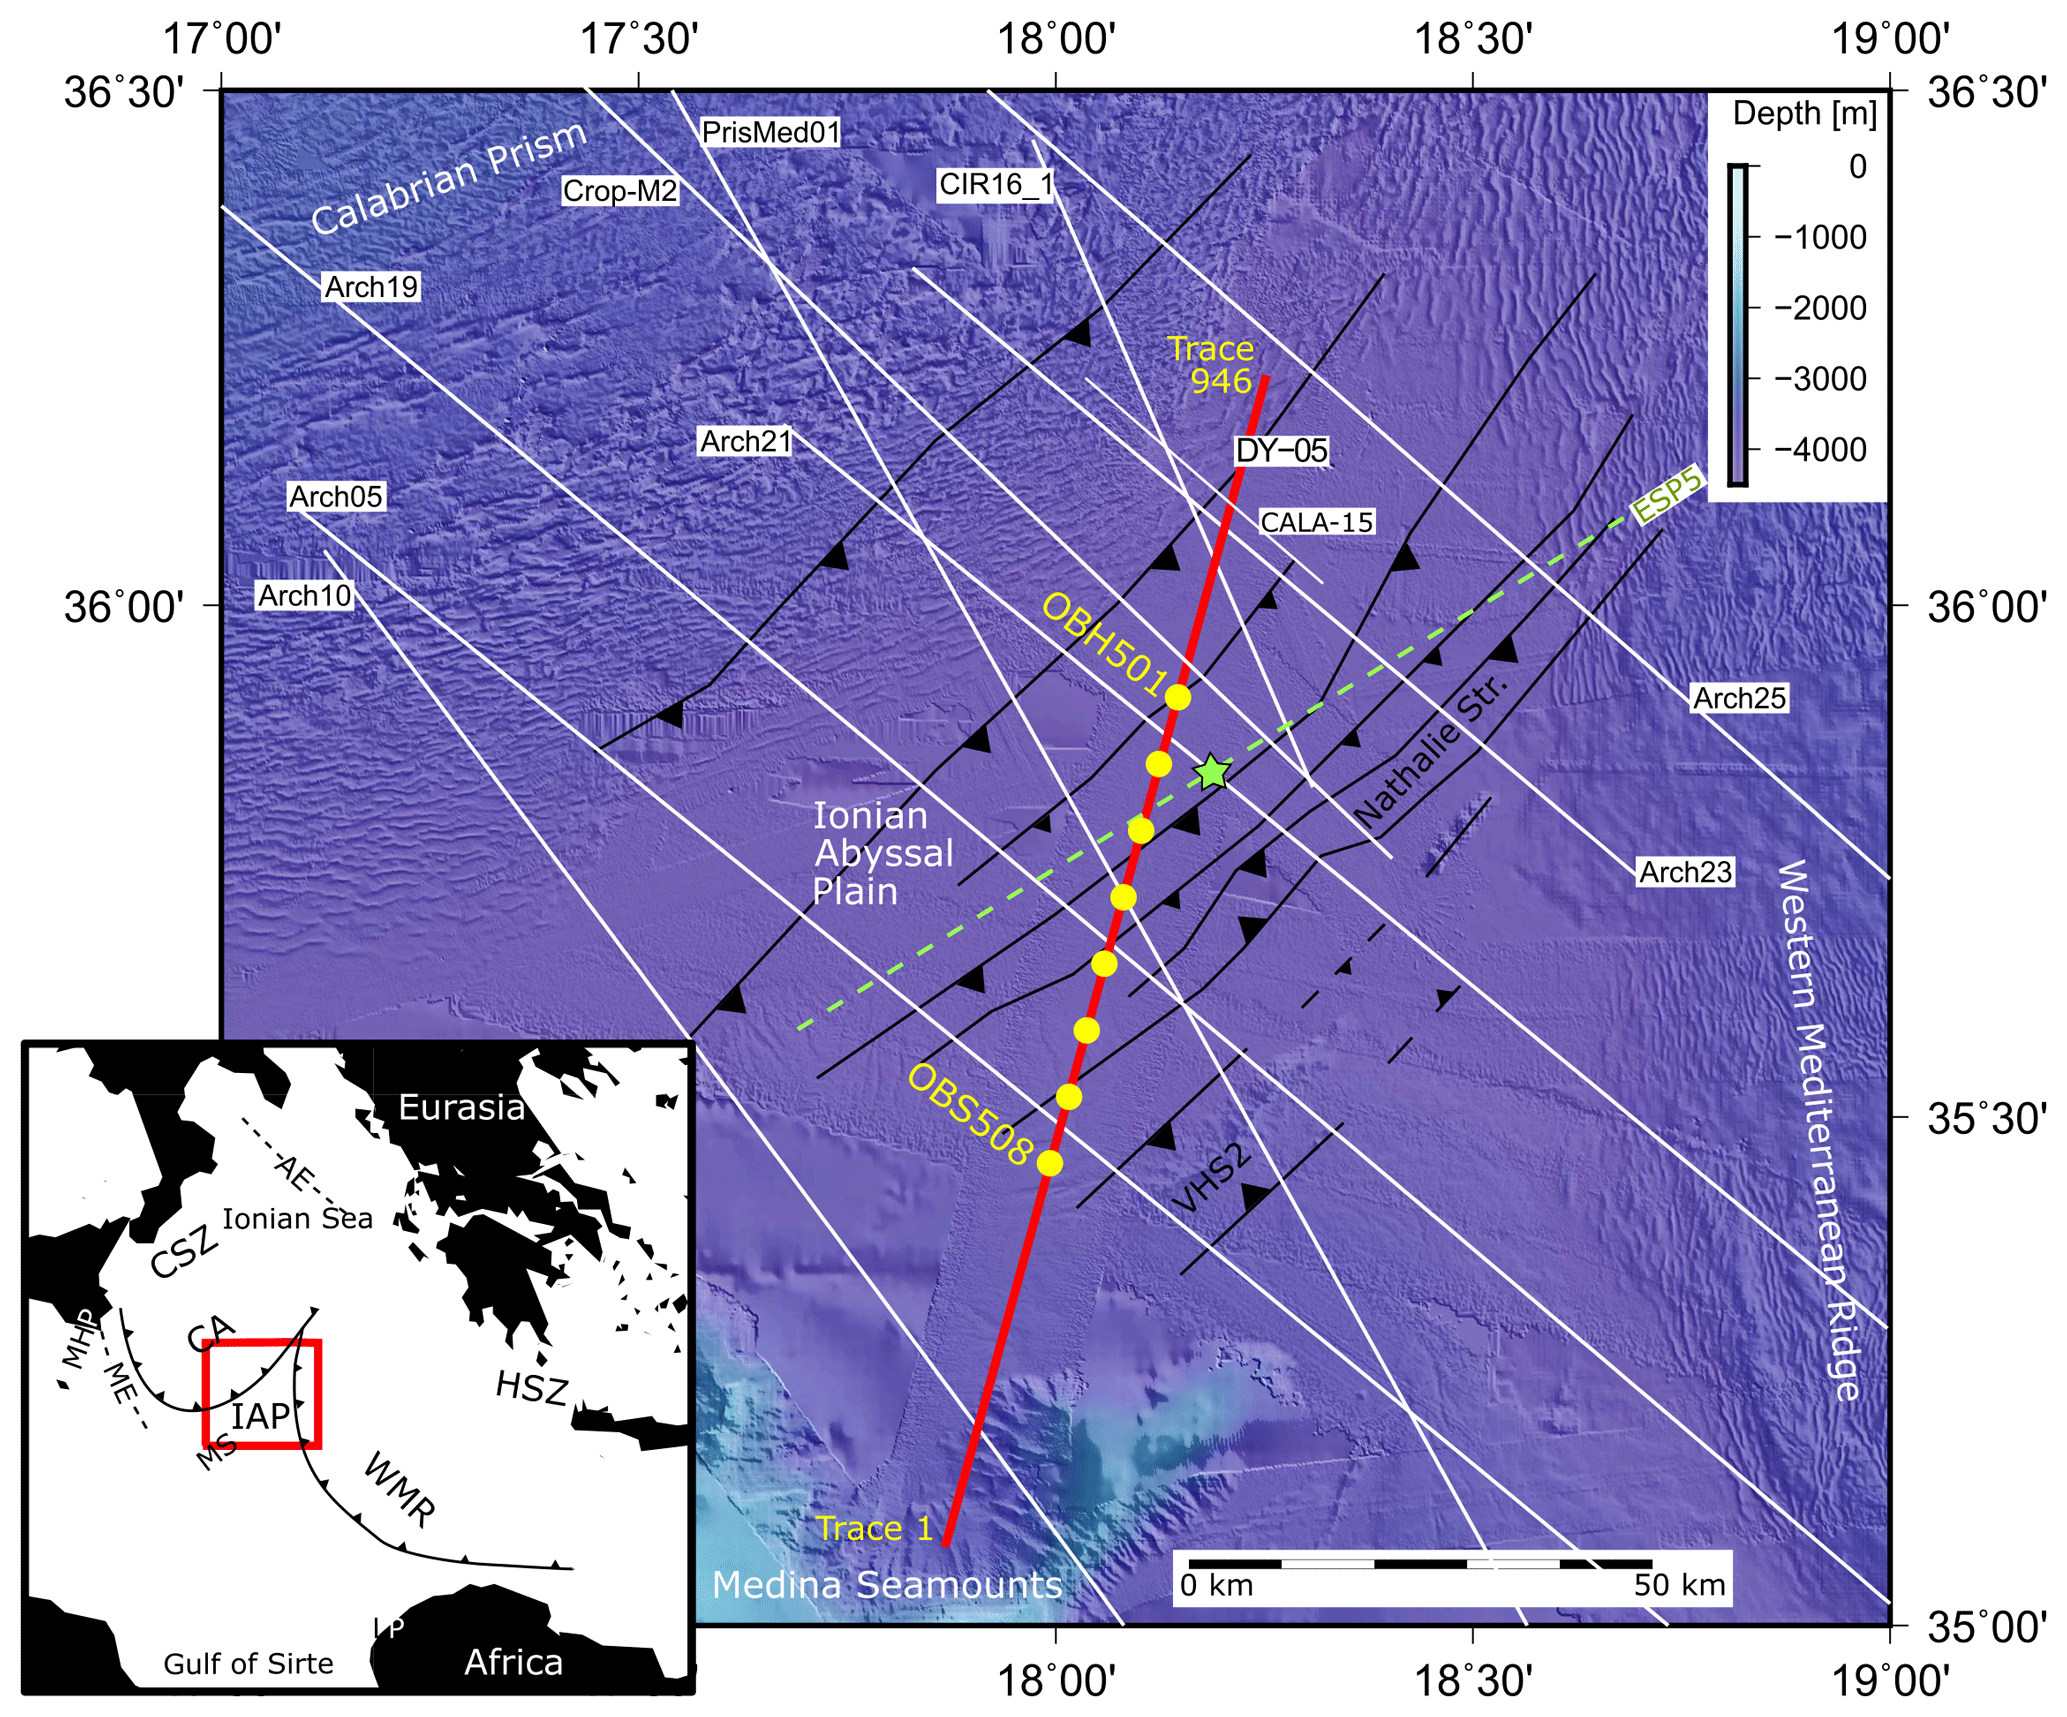
Figure 1Map of the study area showing the location of the OBS profile DY-05 (red line) and the OBS locations (yellow dots). White lines present MCS data (Gallais et al., 2011, 2012; Polonia et al., 2011; Gutscher et al., 2017). The green star marks the location of the ESP5 (de Voogd et al., 1992) and the location of DSDP site 347 (Cita et al., 1978; Hsü et al., 1978) next to it. The ESP shot line is indicated by the green dashed line. Black lines indicate thrust faults (Gallais et al., 2011). The black-and-white map shows the regional structures around the study area: AE – Apulian Escarpment, CA – Calabrian Arc, CSZ – Calabrian subduction zone, HSZ – Hellenic subduction zone, IAP – Ionian Abyssal Plain, ME – Malta Escarpment, MHP – Malta–Hyblean platform, MS – Medina seamounts, LP – Libyan platform, WMR – western Mediterranean Ridge.
Direct sampling of the sediment cover is available from ODP–DSDP sites (Ryan et al., 1973), while sub-basement structure was mainly inferred from potential field and refraction data. Early studies (Locardi and Nicolich, 1988; Nicolich, 1989; de Voogd et al., 1992; Scarascia et al., 1994) considered the crust to be 15–20 km thick. Later investigations refined this value to 8–10 km (Catalano et al., 2001; Gallais et al., 2011; Dellong et al., 2018). Important insight has come from heat flow measurements, which revealed that very low values prevail in the eastern Mediterranean compared to the western Mediterranean (Jiménez-Munt and Negredo, 2003), indicating distinct differences in the age and thickness of the lithosphere in these realms (younger, warmer lithosphere in the west; older, colder, and thicker lithosphere in the east). Low heat flux values of 30–40 mW m−2 (Della Vedova and Pellis, 1989) from the Ionian basin underpin its oceanic origin of at least Mesozoic age, coherent with the Pangea breakup and rifting of the Neo-Tethys Ocean during the late Paleozoic or early Mesozoic (Ricou, 1994; Stampfli et al., 2002; Frizon de Lamotte et al., 2015). In addition, the relatively high Bouguer gravity anomaly of the IAP with values exceeding 200 mgal (Morelli et al., 1975) suggests a shallow Moho boundary (Dellong et al., 2018). The sea-floor magnetic pattern of the IAP indicates that the Ionian Sea lithosphere was formed around 220–230 Ma during Triassic times, and it is considered a remnant of the Tethys Ocean (Speranza et al., 2012).
The IAP lithosphere is subducting beneath the Calabrian Arc, which is proposed to have formed in the late Miocene during the opening of the Tyrrhenian Sea (Faccenna et al., 2001; Chiarabba et al., 2008). Clear Wadati–Benioff zones are imaged below the CSZ in the west (Selvaggi and Chiarabba, 1995) and below the HSZ in the north (Hatzfeld et al., 1993), and recent studies interpreted the slabs to be composed of subducted oceanic crust (Chiarabba et al., 2008; Pearce et al., 2012). The Ionian basin is bounded by the Apulian Escarpment (AE) in the north and the Malta Escarpment (ME) in the southwest. The escarpments are interpreted to be the conjugated passive margins separated during the opening of the Tethys (Catalano et al., 2001; Chamot-Rooke et al., 2005). In contrast, Gallais et al. (2011) and Frizon de Lamotte et al. (2011) interpreted the ME differently and see it as part of a continental transform margin separating the continental domain west of the ME from the deep Ionian basin. The oceanic nature of the Ionian lithosphere supports the hypothesis that the Adriatic microplate, which comprises the Ionian Sea in its southernmost portion, was a rigid promontory of Africa (e.g. Channell et al., 1979; Dewey et al., 1989). However, according to Gallais et al. (2011, 2012), Polonia et al. (2011), and Roure et al. (2012) seismic data show thrust faulting and inversion structures in the IAP (Fig. 1), which are indicative of active deformation and would contradict a totally “rigid” connection to Africa. Roure et al. (2012) favour the IAP to be a thinned part of the African Plate. The occurrence of active deformations in the IAP (Gallais et al., 2011, 2012; Polonia et al., 2011) would support the idea of an independent Adria microplate (i.e. Ustaszewski et al., 2008; Handy et al., 2010, and references therein) allowing it to move relative to Africa, at least in Neogene times (LeBreton et al., 2017). During Neogene times Ustaszewski et al. (2008) determined a ∼20∘ counterclockwise rotation of Adria relative to Eurasia, while only ∼2∘ of rotation has been accommodated between Europe and Africa.
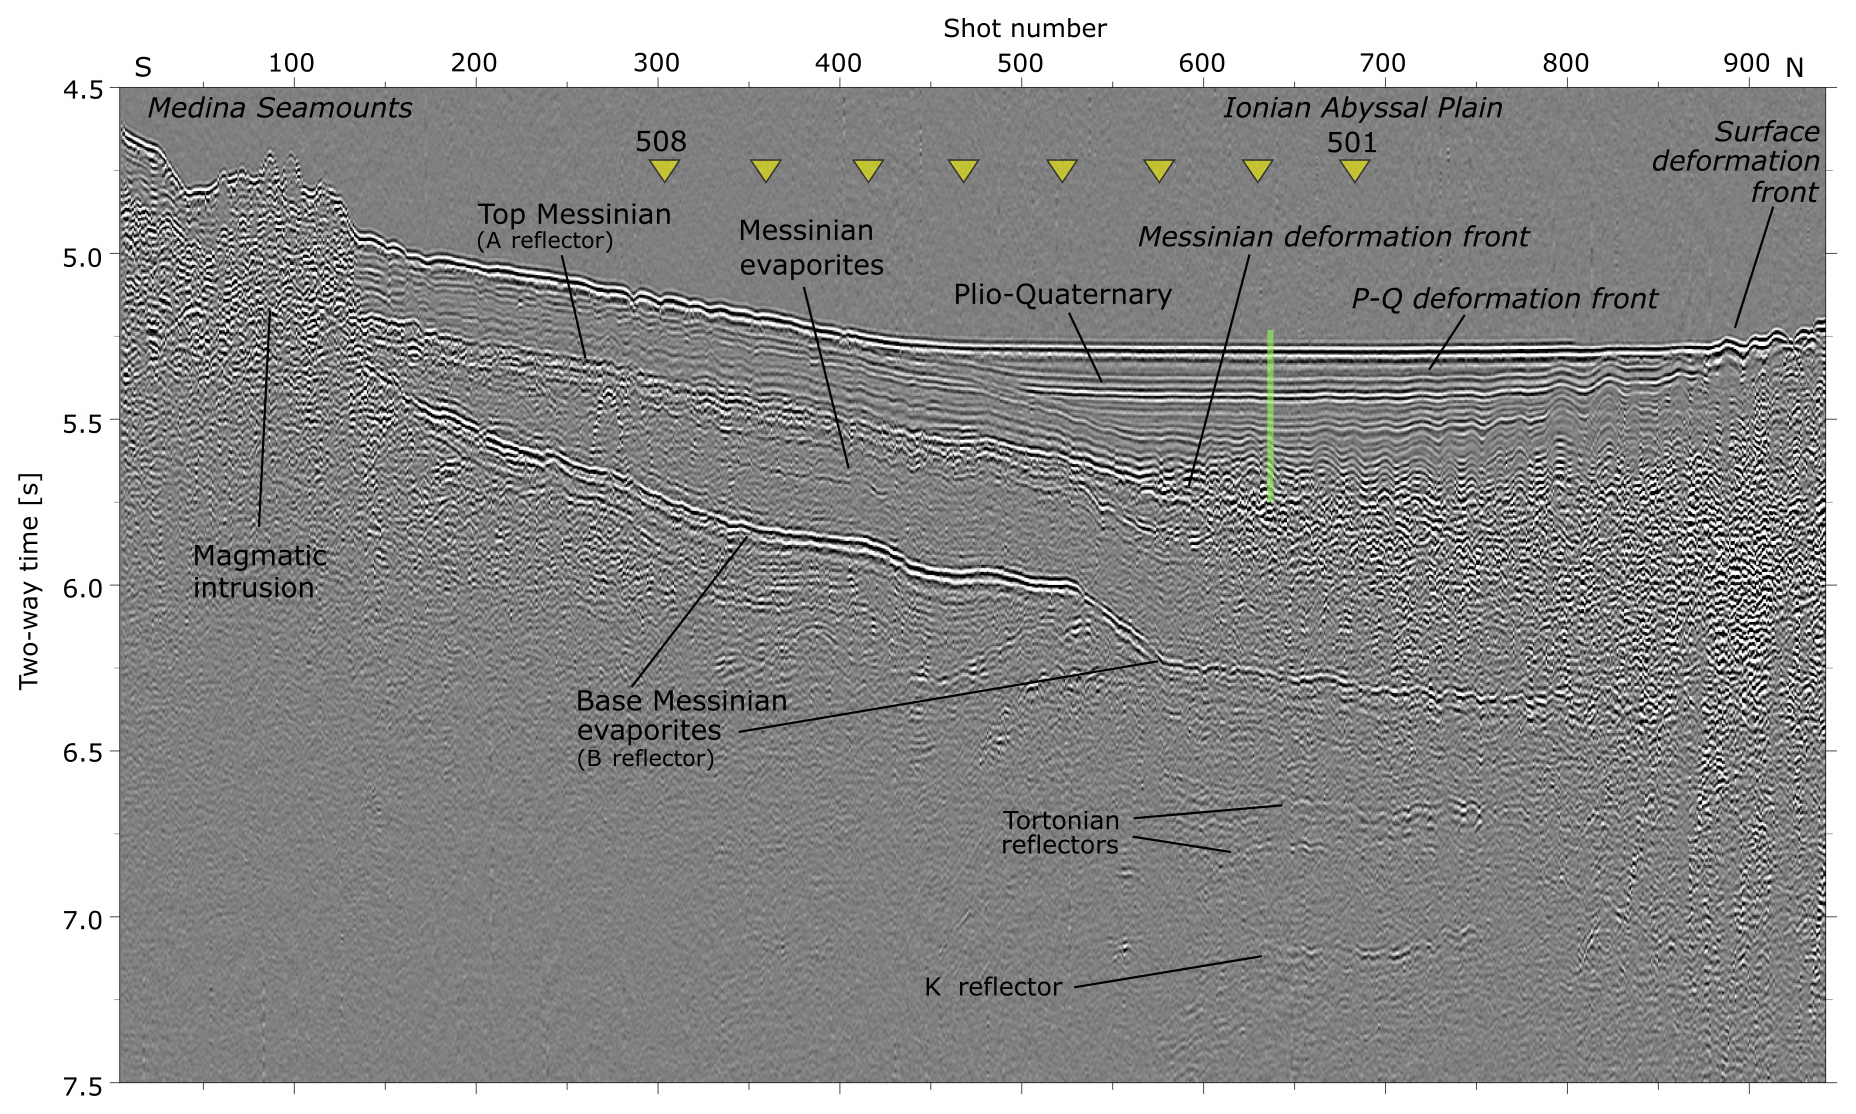
Figure 2Stacked and bandpass-filtered (f=20, 30, 80, 120 Hz) multi-channel data (MCS) along profile DY-05. Yellow triangles mark the OBS locations along the MCS profile. Green bar marks the projected location of DSDP site 374 on the profile DY-05.
During RV Meteor cruise M111 wide-angle refraction seismic data were acquired simultaneously with multi-channel seismic reflection seismic (MCS) data. Profile DY-05 is 131 km long and crosses the IAP from SW to NE (red line in Fig. 1). The location of the line was chosen to cover the area of the IAP that is neither affected by the emplacement of volcanic structures (Medina seamounts in the south) nor by the advancing thick accretionary prisms of deforming sediment in the north and east in order to gain an “unobstructed view” into the deep IAP crust and lithosphere. The central part of the profile was covered by eight sea-floor stations (OBH501–OBS508) with a spacing of 7.4 km. Shooting (946 shots) was extended for ∼40 km beyond the first and last instrument, respectively, in order to record long offsets from shots travelling through the subsurface. An airgun array consisting of six G-gun clusters with a total volume of 84 L (5440 cu in) at 210 bar was fired at a 60 s shot interval. Data quality was very good and arrivals were recorded over the entire profile length. Mantle phases, PmP reflections, and Pn phases were recorded on all stations. A mini-streamer with four channels spread over an active length of 65 m was towed at a depth of 8 m between the airguns. For each channel, six hydrophones with a distance of 0.5 m were grouped together. The streamer served two purposes: it was used to control the correct functioning of the airguns and to provide information on the uppermost sedimentary structures in regions where sea-floor roughness does not cause aliasing. A medium gun delay of 78 ms could be identified, with one gun firing out of sequence, as recognized on the streamer data near trace 800 in Fig. 2.
3.1 Description of the multi-channel seismic reflection data
The stacked MCS data section displays the upper subsurface structure in two-way travel time (twt; Fig. 2). The water depth along the profile increases from ∼3570 m (∼4.7 s twt) at the southern termination in the vicinity of the Medina seamounts to ∼4060 m (∼5.3 s twt) in the central portion of the profile. The water depth declines again towards the northern end of the line, which starts to cover the Ionian accretionary prism (compare Fig. 1). North of the rough sea floor of the Medina seamounts, the data section is dominated by the thick sedimentary and evaporitic sequences which fill the basin. Stratified sediment layers are softly inclined along the southern part of the profile between shot numbers 150 and 450. Towards the centre of the basin, horizontally layered, sub-parallel sequences are onlapping these strata between shots 450 and 550. These units are underlain by a thick sequence of incoherent amplitudes truncating the sediment layers in the south. A prominent strong-amplitude reflector may be traced from shot point 150 at 5.2 s to around shot number 550 at 5.7 s. Whereas a coherent layering is visible in the units above this reflector, the units below are seismically much more opaque. The base of these units is marked by a strong negative reflector at 5.5 (near trace 200) to 6.3 s (near trace 800). Below this reflector, the seismic signal is strongly attenuated and no coherent structures may be identified. Three deep reflectors to the north at 6.6 s, 6.8 s, and at 7.15 s lose their seismic amplitude coherence beyond shot numbers 600 and 750, respectively.
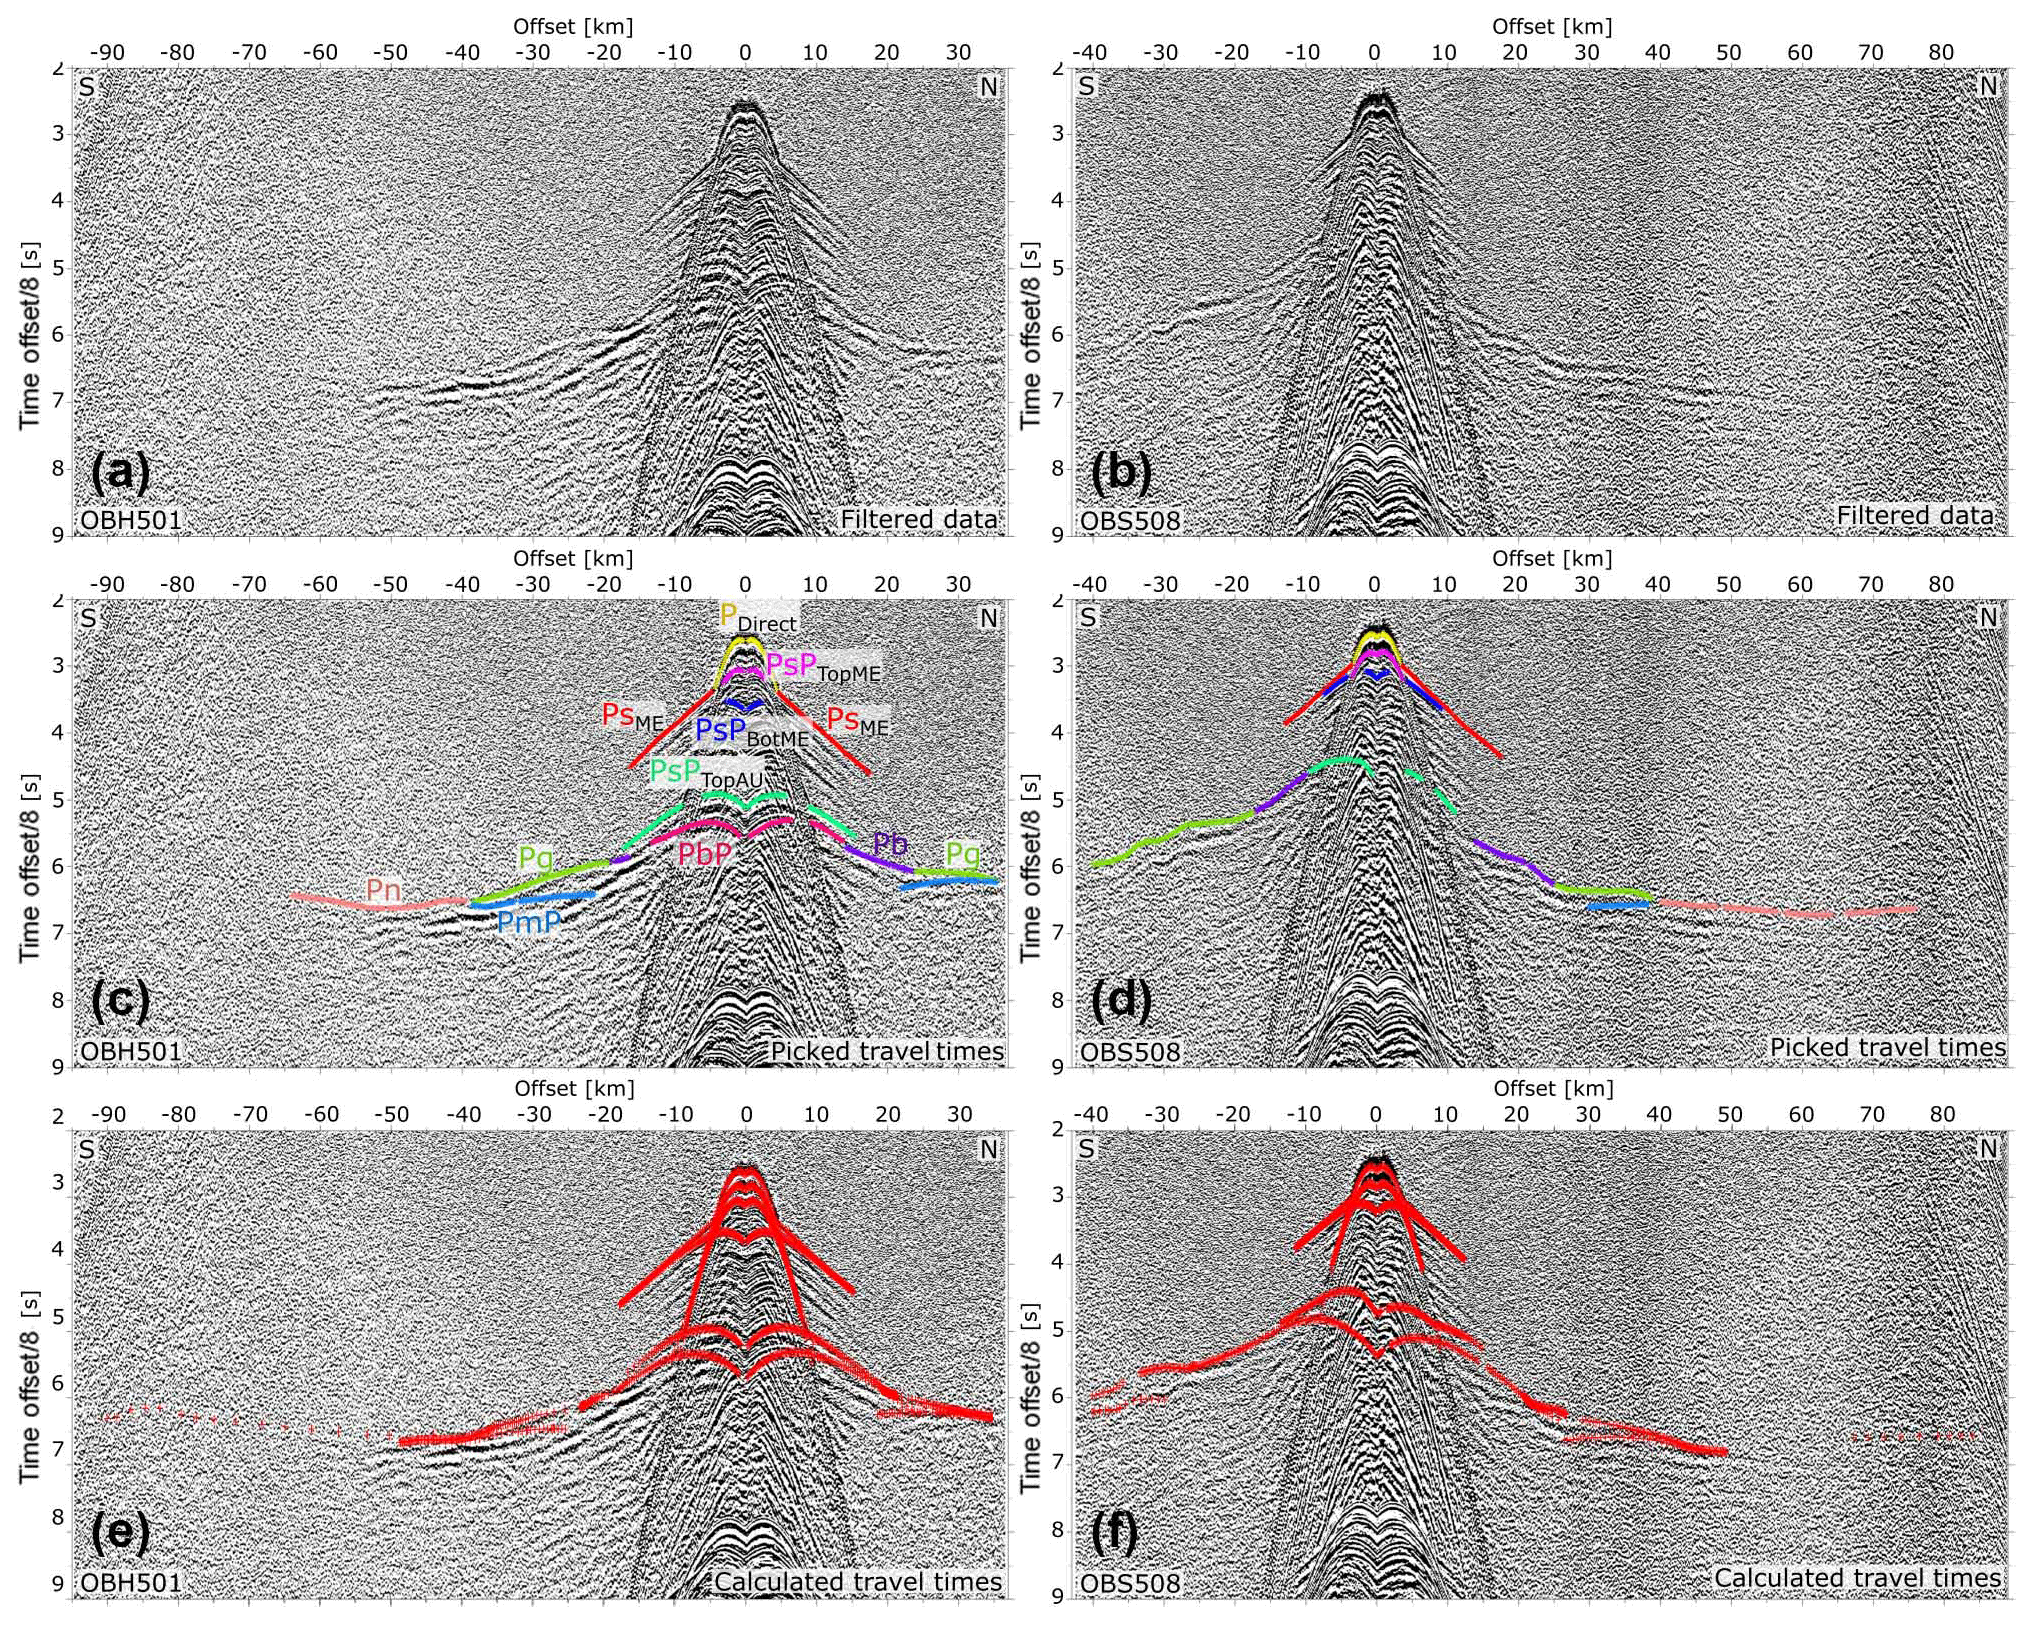
Figure 3Seismic record sections of OBH501 and OBS508. Panels (a) and (b) show processed data. Panels (c) and (d) show the travel-time picks used for the forward modelling (please refer to phase definitions in the text). Calculated travel times from the final model are displayed in (e) and (f). Data are plotted with a reduced time of 8 km s−1.
3.2 Description of the seismic wide-angle reflection and refraction data
Figure 3 presents seismic shot sections, including picked and calculated travel-time picks, of the two outermost stations, OBH501 and OBS508. In the following we want to describe the recorded data using pick phases, pick colours, and layer names, which can be found in Table 1. The earliest arrival at the stations is the direct wave through the water picked in yellow (PDirect, phase 1). Magenta picks (PsPTopME, phase 3) represent the base of the youngest sediment units. The geometry of these sediment layers is well imaged in the multi-channel seismic data (Fig. 2) by a strong positive reflector (PsPTopME). Red picks (PsME, phase 2) follow the first arrivals to an offset of ∼15 km (3.5 to 4.5 s), representing refracted waves travelling through the evaporite layers with an apparent velocity of 4.5 km s−1. At about 15 km offset from the station, at the limit of the red picks (phase 2), a prominent shadow zone indicates a strong negative velocity inversion in the subsurface including a thick low-velocity zone. The near-offset early arrivals are offset by 1.5 s to the deeper crustal first-arrival phases (light green picks, Pg, phase 10) that have been recorded starting at roughly 6 s. A strong negative reflector starting at zero offset is present on all OBS record sections and is picked in dark blue (PsPBotME, phase 5). It marks the base of the Messinian unit at ∼3.6 s at zero offset. After a ∼1.4 s long sequence of high-amplitude reflectors follows a low-frequency high-amplitude reflector (dark green, PsPTopAU, phase 7) visible between 0 and 20 km offset at ∼5 s. Underneath, a second similar reflector is picked in dark magenta (PbP, phase 9) at ∼5.6 s. These two reflectors originate from the base of the slow sediment unit and the basement, respectively. At larger offsets, two crustal phases (violet (Pb, phase 8) and light green (Pg, phase 10) picks) could be identified. At about 35–40 km in offset the mantle reflection is observed and picked in light blue (PmP, phase 11), with mantle-refracted phases in bright red (Pn, phase 12). Except for OBS508, where the PmP phase was observed on the northern branch only, all instruments show wide-angle mantle reflections (phase 11) at both branches.
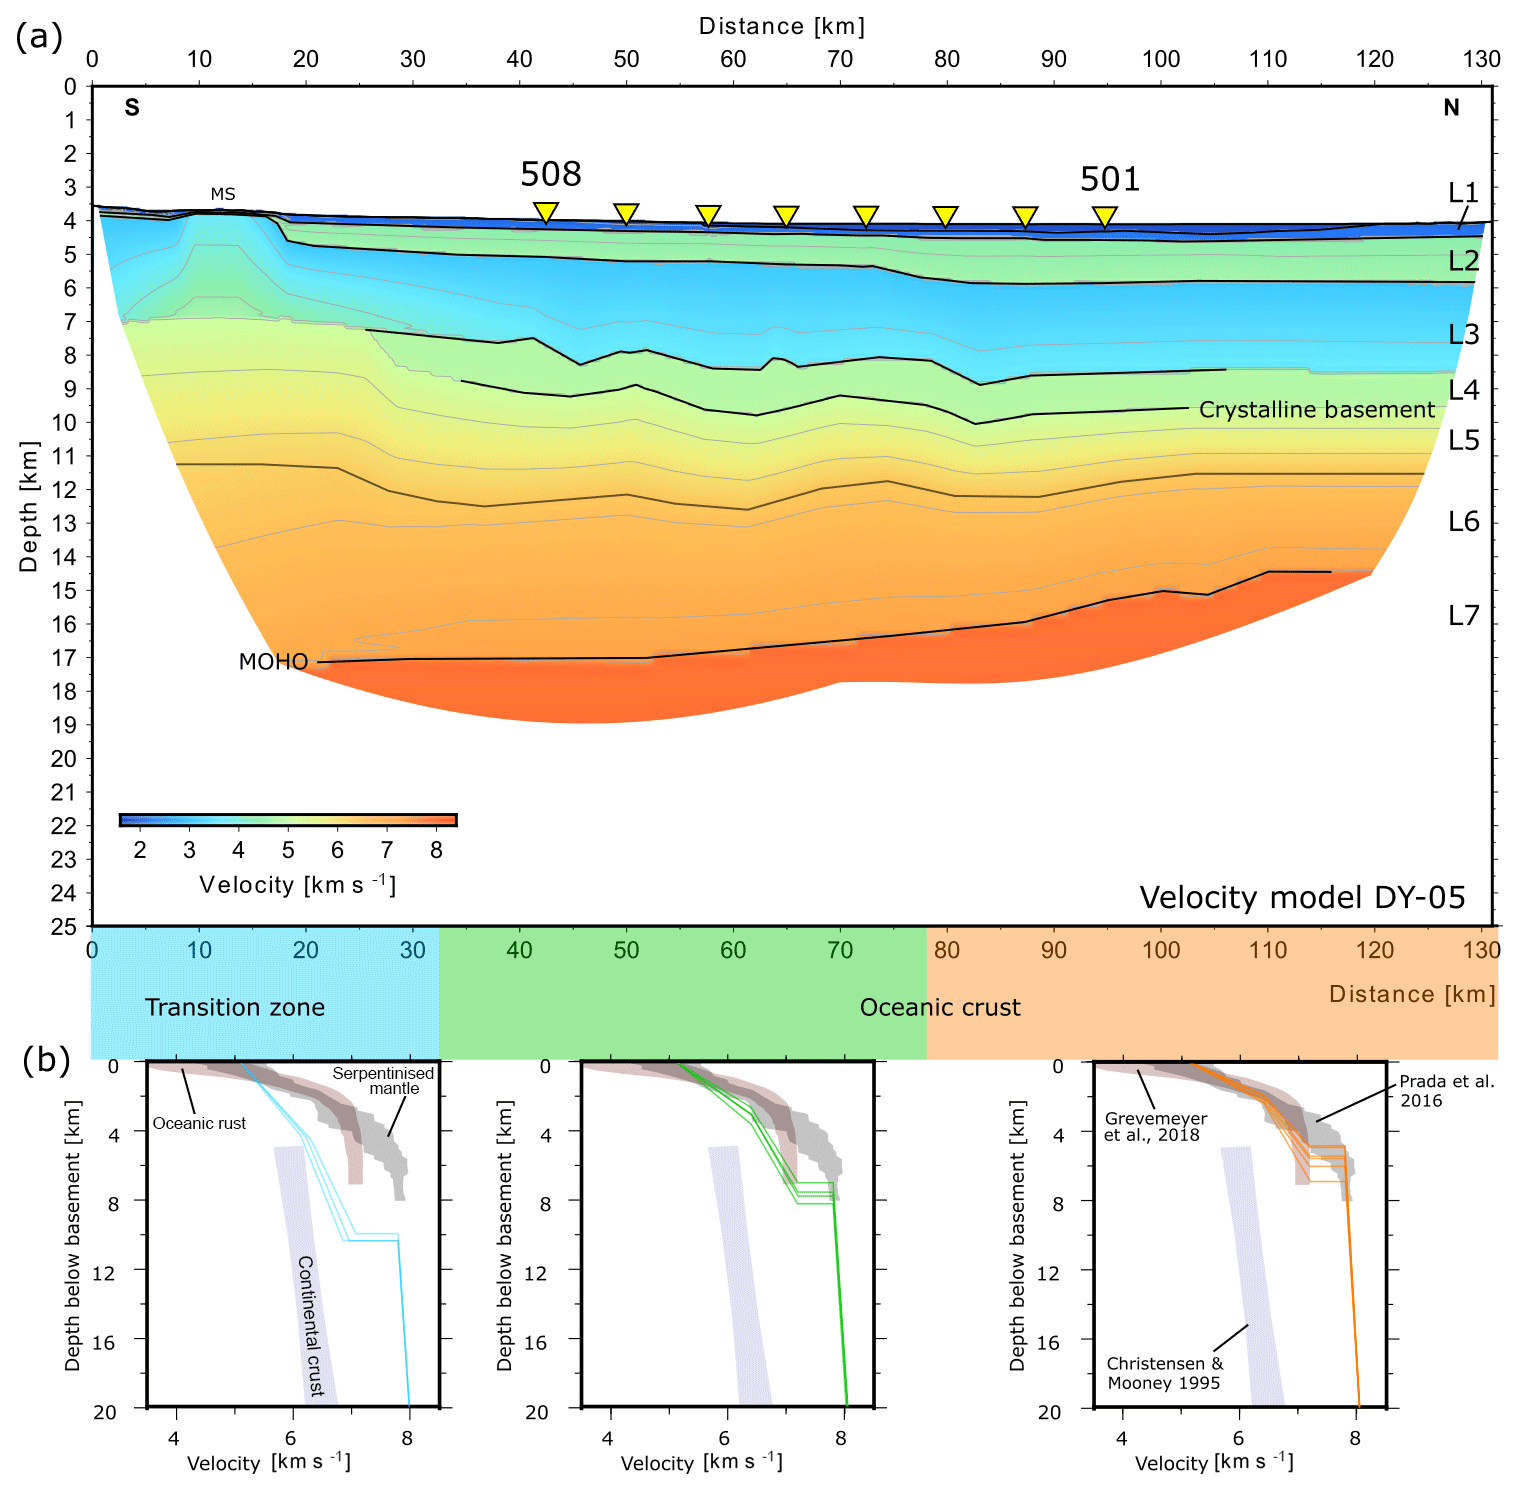
Figure 4(a) Final velocity model for profile DY-05 obtained from forward modelling. (b) Velocity–depth functions (blue, green, and orange) starting at the basement and extracted from the final velocity model every 10 km according to the coloured sections. Observed velocities are compared to oceanic crust (red grey ensemble) (Grevemeyer et al., 2018), continental crust (blue ensemble) (Christensen and Mooney, 1995), and serpentinized mantle (dark grey ensemble) found in the Tyrrhenian Sea (Prada et al., 2016). MS – Medina seamounts.
3.3 Methodology and modelling strategy
By developing a velocity model for profile DY-05 we targeted the structure of the sedimentary strata, the crust, and the uppermost mantle. This was achieved by forward modelling of the observed travel times using the ray-tracing software RAYINVR (Zelt and Smith, 1992; Zelt and Forsyth, 1994). It runs on the graphical user interface MODELING (Fujie et al., 2008). Travel times were picked using the software PASTEUP (Fujie et al., 2008). Attempts to apply tomographic inversion approaches failed due to the presence of a thick low-velocity zone. The final forward model (Fig. 4) was developed starting with the water layer and progressing downward layer by layer. The geometry of the upper layers was constrained by the MCS data (Fig. 2). The geometry of the deeper layer boundaries was optimized by using the inversion algorithm of RAYINVR. The approach of combined forward modelling and layer-wise inversion was chosen to find the simplest model to fit all data without over- or under-fitting the data. The velocity and interface nodes have been spaced irregularly. The velocities are tied to layer interfaces at the top and bottom of each layer. Between the nodes, velocity and interface information is interpolated (Zelt and Smith, 1992; Zelt, 1999). The root mean square (RMS) misfit and the Chi2 value for each phase are provided in Table 1. Pick uncertainties were assigned to avoid over- or under-fitting the data, especially in the inversion modelling. An overall normalized Chi2=1 in travel-time misfit should be achieved for the final model. We receive velocity uncertainties of up to 0.05 km s−1 for the shallow sedimentary units, while the velocity uncertainties for the low-velocity sedimentary layer are higher at ∼0.2 km s−1. At the crustal level and deeper, uncertainties reach 0.1 km s−1. Due to the high number of observed PmP arrivals and the dense shot spacing, the uncertainty for the depth of the Moho is ∼1 km.
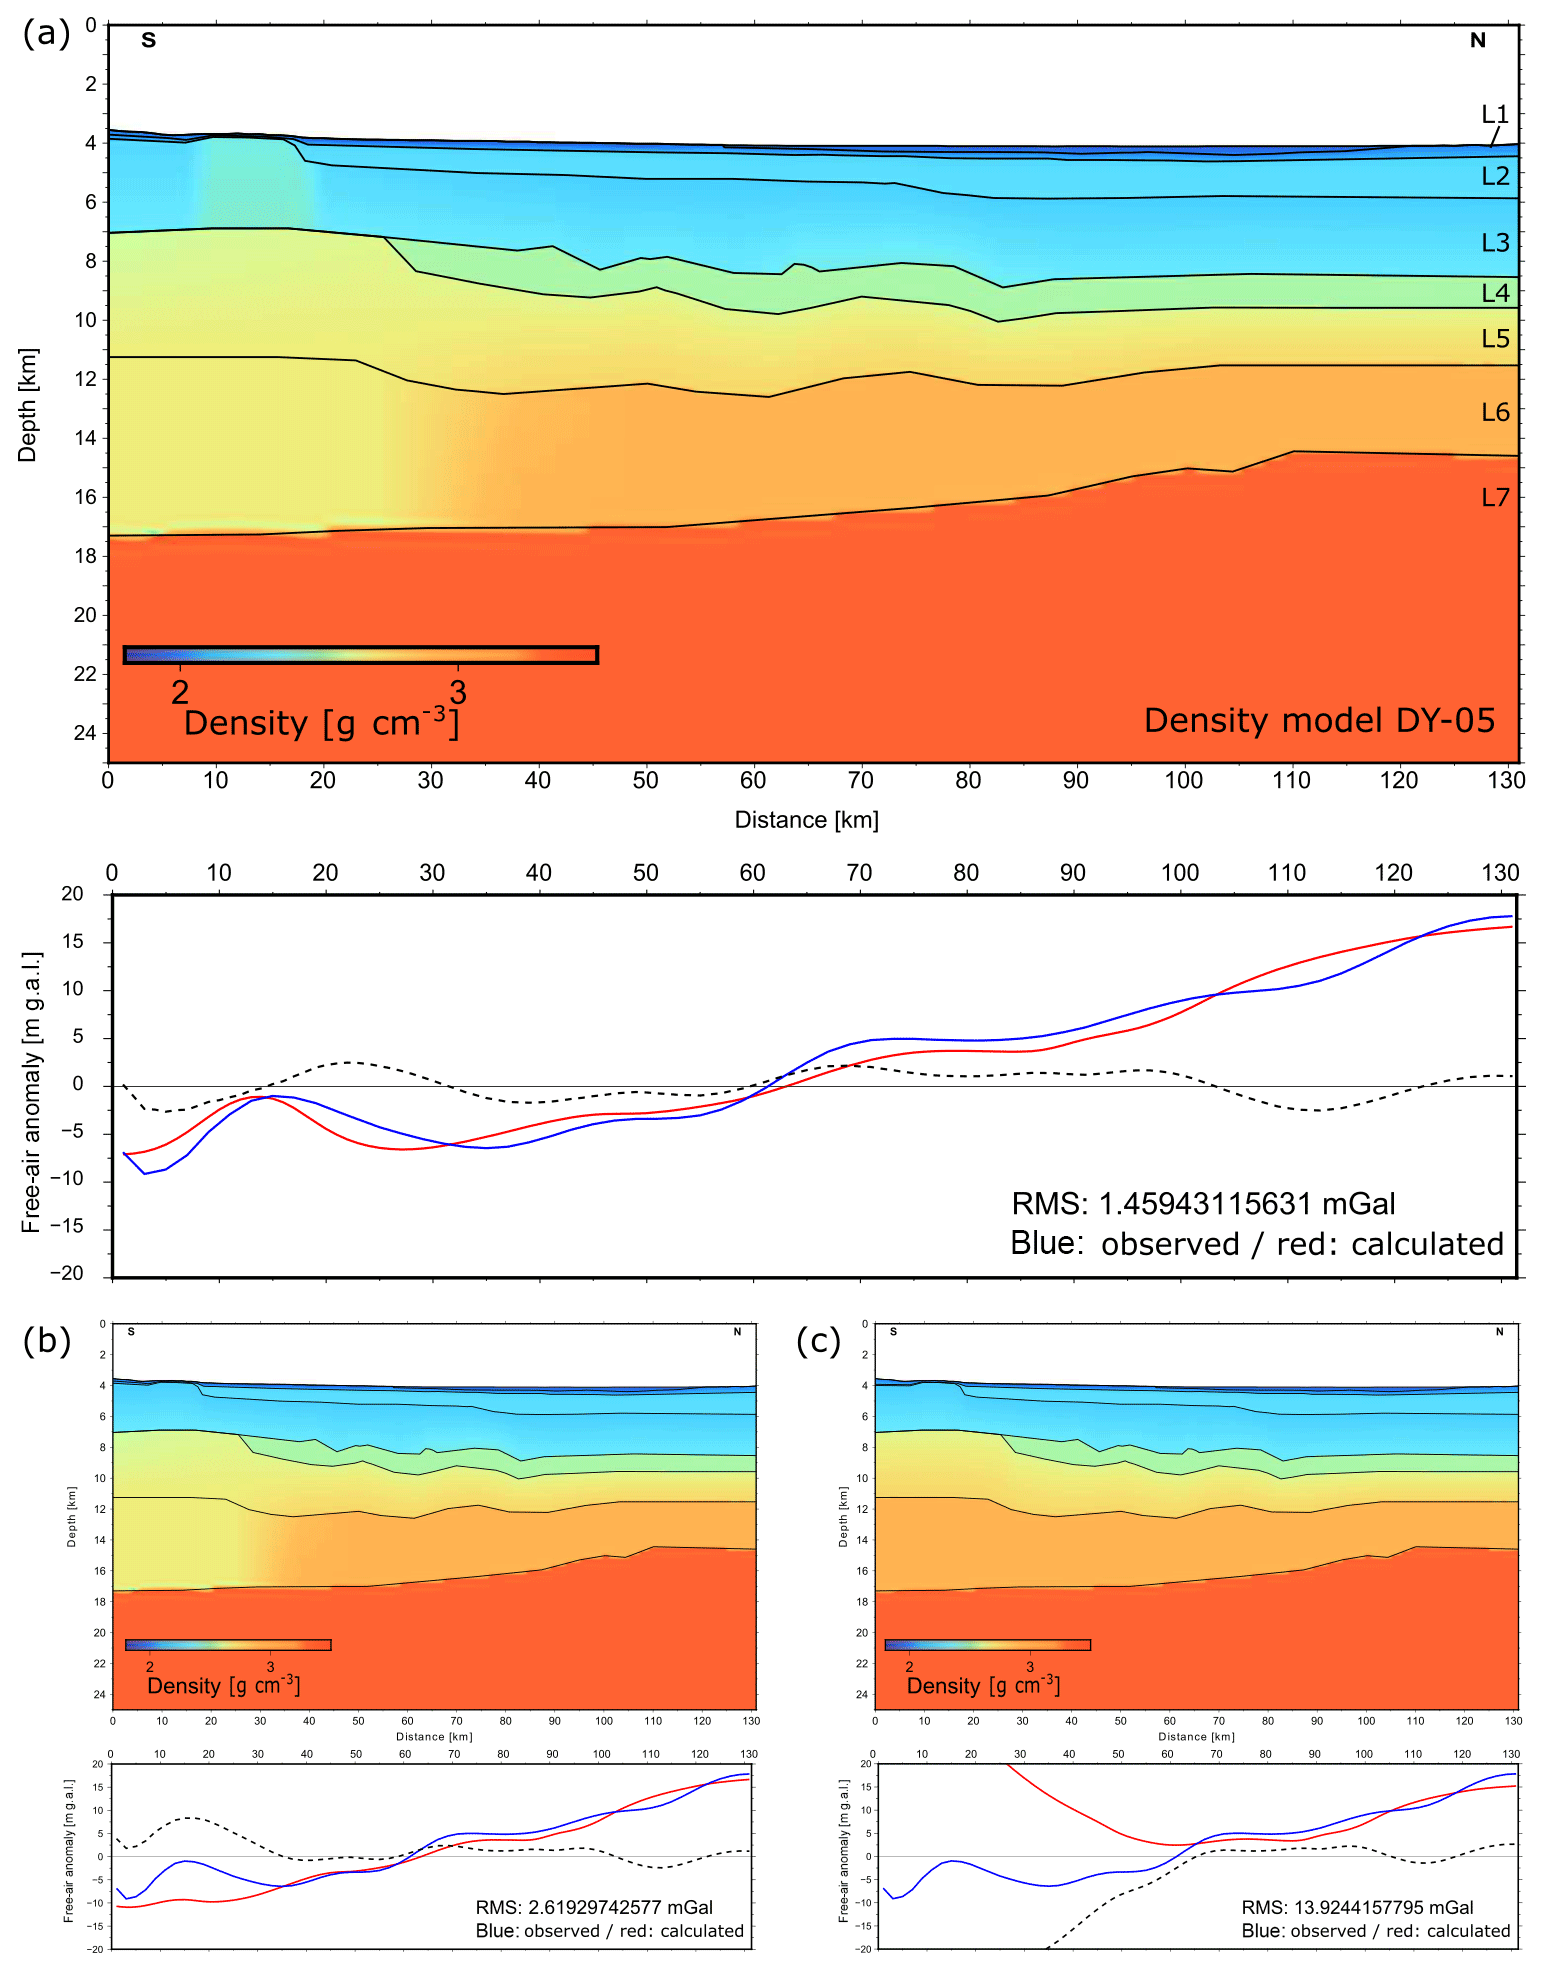
Figure 5(a) The density distribution calculated for profile DY-05 based on seismic velocities and minor adjustments to fit the observed FAA in panels (b, c). (b) Case study for the local influence of the Medina seamounts on the model response. (c) Case study for oceanic crust over the entire profile length. Black dashed line shows the residuum of the observed and calculated data.
To corroborate the seismic velocity model obtained by seismic travel-time forward modelling, complementary two-dimensional gravity forward modelling was performed. Especially at the profile ends with only moderate station coverage, the seismic velocity model is highly uncertain and gravity modelling (Fig. 5) helps to constrain and adjust the model. The free-air anomaly (FAA) along the 2-D profile was extracted from satellite altimetry data (Sandwell and Smith, 1997). Based on the seismic velocities an initial 2-D density model was constructed. The model response (Talwani et al., 1959) was compared to the observed free-air anomaly data along the profile. Minor adjustments to the model densities, all within common density–velocity relationships (Carlson and Herrick, 1990; Christensen and Mooney, 1995), were applied to achieve a reasonable fit between calculated and observed FAA.
To validate the forward modelling, synthetic data based on the final seismic velocity model were calculated and compared to the recorded data (Fig. 6). A finite-difference scheme for the solution of the elastic isotropic wave equation from Hestholm et al. (1994) was used to calculate the synthetic data for a 2-D structure. The input velocity model had a grid cell size of 50 m. The seismogram was computed with a P-wave source frequency up to 30 Hz, while a 2 ms time step was chosen. No random noise was added.
Table 1Observed seismic phases with their pick number, number of picks, pick uncertainty, RMS fit, and Chi2 to allow for an estimation of the robustness of the seismic velocity model obtained from forward modelling.
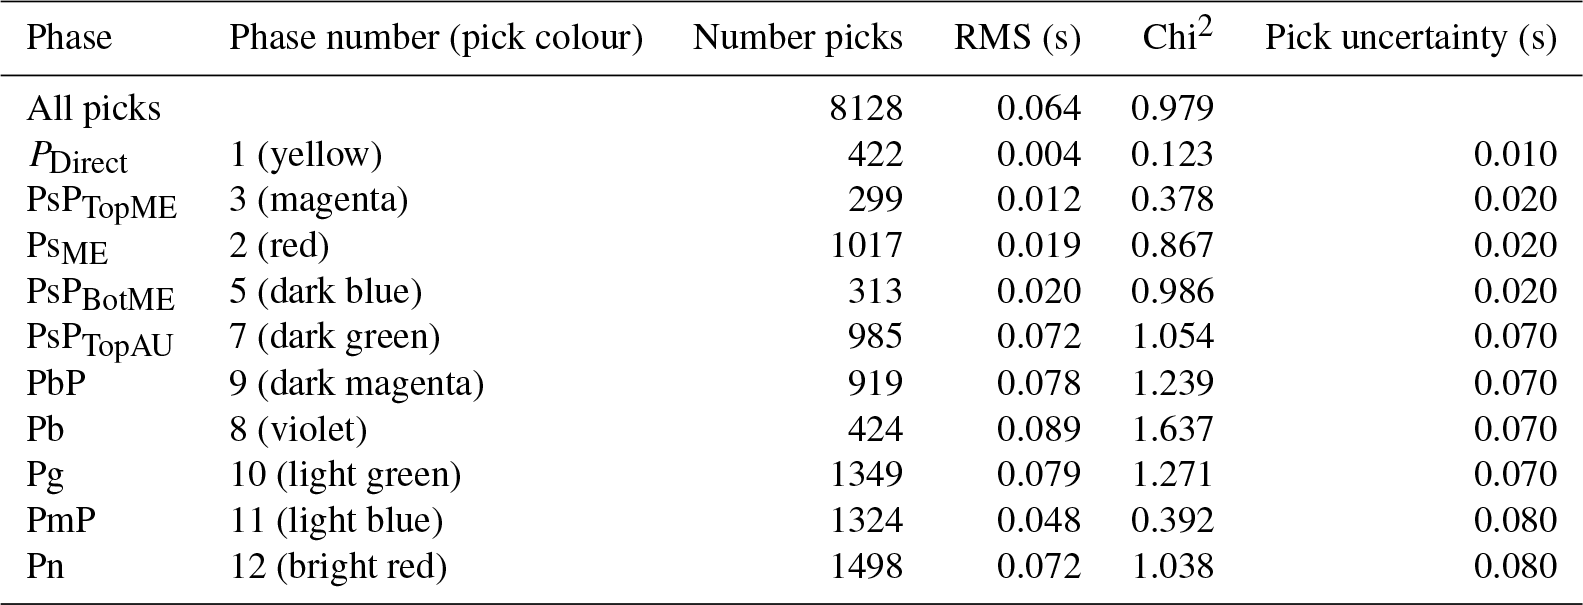
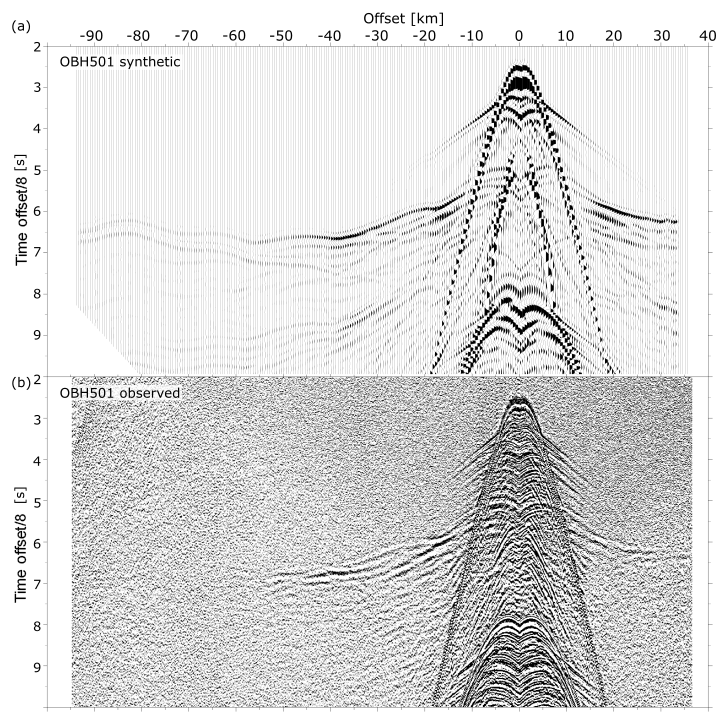
Figure 6(a) Synthetic seismogram of OBH501 based on the final velocity model. (b) Original bandpass-filtered seismogram of OBH501.
4.1 Shallow structures from multi-channel seismic data
The uppermost unit in the MCS data was drilled at DSDP site 374 to a depth of 457 m (Hsü et al., 1978) and corresponds to Plio–Quaternary sediments. The lower limit of this unit is marked by the so-called A reflector (Finetti and Morelli, 1972), which forms the transition to the Messinian evaporite layers (Hsü et al., 1978; Gallais et al., 2011). This reflector corresponds to phase 3 (PsPTopME, magenta picks) in the seismic sections of the OBH (Fig. 3).
The base of the Messinian evaporites has been termed the B reflector by Finetti and Morelli (1972). We interpret phase 5 (PsPBotME, dark blue picks) in the OBS seismic sections (Fig. 3) to correspond to this reflector. The B reflector disappears in our seismic section near trace 800 towards the north due to seismic scattering. Three reflectors identified near trace 650 at 6.6, 6.8, and at 7.15 s indicate pre-Messinian sedimentary layering. We link the upper two reflectors to Tortonian age, while the deeper reflector at 7.15 s is interpreted to be the so-called K reflector, as identified by Gallais et al. (2011) in the crossing seismic line Arch21 (Fig. 1).
At trace 100 of the MCS profile the layering of the upper sediments is disturbed by the volcanic signature of the Medina seamounts (Fig. 2). In the northern part of the profile, starting near trace 570 (OBH503), the A reflector of the Messinian unit gradually disappears towards the northern profile end. The upper Plio–Quaternary sediments are gently folded near trace 700, whereas north of trace 880, all Plio–Quaternary sediments are strongly folded up to the sea floor. The fold amplitude progressively decreases towards the south as observed in Polonia at al. (2011) along the MCS line CALA-15. We interpret these folds to represent the deformation front of the Calabrian accretionary wedge, expressed at different depth levels. The deformation of the sediments and/or differential sediment loading possibly create fluid pathways and may thus support the dissolution of the evaporites below.
4.2 Sedimentary structures from seismic travel-time modelling
Layer 1 in our final velocity model (Fig. 4a) is 250–500 m thick with rapidly increasing seismic velocities from 1.8 to 2.2 km s−1, top to bottom. From drilling it is known that L1 is composed of unconsolidated Plio–Quaternary sediments (Hsü et al., 1978). The underlying layer L2 is characterized by uniform seismic velocities of 4.4 to 4.65 km s−1 and a thickness of 0.8 to 1.3 km. L2 is interpreted as the Messinian evaporite unit (layer 2 in Fig. 4a), similar to the findings along seismic profiles in the Calabrian Arc, profiles DY-01 and DY-03 (Dellong et al., 2018). The A reflector (phase 3, magenta picks, PsPTopME) and the reversed-polarity B reflector (phase 5, dark blue picks, PsPBotME) occur as strong phases in the OBS data at all stations, representing the top and bottom of the Messinian evaporite unit, respectively. The B reflector at the base of the Messinian unit is also known as the S1 horizon from the ESP5 (Expanding Spread Profile) studied by de Voogd et al. (1992).
Below the B reflector, the OBS data show a succession of high-amplitude reflectors similar to observations made by Gallais et al. (2011) in the MCS data (Archimede and PrisMed01 profiles). However, it is difficult to link these reflectors to certain horizons in our velocity model; thus, we modelled the pre-Messinian sediments as a low-velocity layer (layer 3 in Fig. 4a) with velocities increasing from 3.1 km s−1 at the B reflector to 3.7 km s−1 at the base of the unit. Chamot-Rooke et al. (2005), Polonia et al. (2011), and Gallais et al. (2011) propose that the upper part of the unit, containing the succession of reflectors, is of Tortonian age, overlying an undifferentiated Tertiary sequence and Mesozoic sediments. From 20 km towards south, we observe higher velocities up to 3.7–4.7 km s−1 (top to bottom) that we relate to the Medina seamounts. This part of the profile, however, was not covered by OBS stations; thus, the model here is less reliable.
A high-amplitude, low-frequency reflector (phase 7, dark green picks, PsPTopAU in Fig. 3) marks the top of layer 4, with shows a low-velocity gradient, with seismic velocities of 4.8–4.9 km s−1 (Fig. 4a). We interpret L4 as a sedimentary unit based on the seismic velocities and the velocity gradient within the layer. This layer is called the ambiguous unit in Gallais et al. (2011). Thus, we observe the crystalline basement at a depth of ∼9.5 km at OBH501 to ∼8.5 km at OBS508.
4.3 Crustal structures from seismic travel-time modelling
Indeed, layer 5 (Fig. 4a) shows a steeper velocity gradient to a depth of ∼11 km. The seismic velocities increase from 5.1 to 6.4 km s−1, typical for upper oceanic crust (seismic layer 2) (White et al., 1992; Grevemeyer et al., 2018). The upper crust is approximately 2–3 km thick. Layer 6 (Fig. 4a) again shows a lower-velocity gradient with velocities increasing from 6.4 to 7.2 km s−1 from top to bottom, typical for lower oceanic crust (seismic layer 3) (White et al., 1992; Grevemeyer et al., 2018). Layer 7 (Fig. 4a), with velocities higher than 7.8 km s−1, is interpreted as mantle with a seismic Moho at ∼15 km of depth at OBH501 and at ∼17 km of depth at OBS508.
In Fig. 4b we compare seismic velocity–depth profiles along profile DY-05 with a velocity–depth ensemble for magmatic crust (Grevemeyer et al., 2018), as well as with a velocity–depth ensemble for serpentinized mantle found in the Tyrrhenian Sea (Prada et al., 2016) and a velocity–depth profile typical for extended continental metamorphic crust. In the northern portion of the profile (orange section) and at shallow depth (∼2 km into the basement) the profile fits both ensembles for magmatic crust and serpentinized mantle, while at greater depth in the northern portion of the profile (orange section), lower-crust velocities typical for gabbro are observed. Between 40 and 130 km (green and orange sections), the observed seismic velocity field and the velocity gradients are typical for magmatic crust.
In the northern part of the profile in the IAP, 6–7 km thick crust is encountered. Towards the southern end, the crust thickens to at least ∼9 km. Due to the moderate resolution at the model termination in the south, especially at greater depth, it is difficult to identify the nature of the crust in the southern part. In conjunction with crustal thickening we observe crustal velocities at the crust–mantle boundary of 6.8 km s−1, which plot closer to the velocity–depth ensemble of continental metamorphic crust (compare to Fig. 4b, blue section). The recorded seismic data show a change in the characteristics of the mantle phases towards the south. This could result from a change in the nature of the crust or simply originate from the influence of the Medina seamounts with their proposed volcanic composition (Finetti, 1982).
Again, at the edges and with increasing depth, modelling becomes less accurate. Pick uncertainties and data fits are presented in Table 1. Table 2 lists layers L1 to L7 (used in Fig. 4a) with their seismic velocities.
4.4 Gravity modelling
The results of the 2-D gravity forward modelling are shown in Fig. 5. In the south, possible 3-D effects of the Medina seamounts have not been taken into account during the modelling. However, the seismic velocities of the crust and the density of the crust decrease towards the south, roughly south of kilometre 30 of the profile. At the corresponding location in the model, a thickening of the crust is observed. A good fit is observed with an RMS deviation of 1.46 mgal. Figure 5b presents a case without the shallow density anomaly between 5 and 20 km along the profile. The overall trend of an increasing FAA from south to north can be still observed; however, the short-wavelength fit is inferior compared to the final model (Fig. 5a): the RMS misfit is 2.62 mgal. This part of the model is not covered by OBS, resulting in less well-constrained seismic velocities; however, shallow denser material supports the observed higher seismic velocities. This is supported as well by the MCS data in Fig. 2, for which the sedimentary succession is deformed and reflectors are disturbed. To further test the velocity model, a constant crustal velocity was assumed. In contrast to the final model, densities in the crust were defined with constant values typical of oceanic crust over the entire profile (Fig. 5c). The model response in Fig. 5c shows a strong RMS misfit of 13.92 mgal between observed and calculated FAA south of kilometre 60. In this scenario, the crustal densities are too high in the southern part of the model. Additionally, assuming a constant crustal thickness would even enlarge the misfit of the data. By means of the gravity study, we can confirm the final seismic velocity model, even for the portions not covered by OBS.
4.5 Synthetic data
The computation of synthetic data serves to test the forward modelling results. Figure 6 compares the synthetic seismogram based on the final velocity model (Fig. 4) with the recorded seismogram of OBH501. The gross features of the observed amplitudes (Fig. 6b) could be reproduced in the synthetic record section (Fig. 6a). The near-offset waveforms (between 5 and 15 km offset and between 3.5 and 4 s) of the evaporite unit show high amplitudes that rapidly decrease with offset. The large shadow zone, starting at 15 km offset and at ∼4 s to both sides, is caused by a thick unit of sediment layers with slower seismic velocities compared to the evaporite unit. This portion of the model was kept simple during forward modelling; thus, we observe a lack in phases between 4 and 5 s in the synthetic data compared to the observed data in Fig. 6b. The additional phases in the observed data indicate internal layering of the evaporite unit as well as layering within the slow sedimentary unit below, which were not resolved during travel-time modelling. At roughly 5 s the reflected phase of the fast sedimentary unit above the basement and the reflection of the basement at 5.5 s are present in the synthetic data with weak amplitudes (Fig. 6a). The crustal phases between 15 and 30 km offset become stronger again, while the PmP, between 40 and 50 km offset at about 7 s, shows high amplitudes. This feature is observed in the recorded data as well and is associated with a discontinuity at the crust–mantle boundary. The mantle phases with offsets larger than 55 km slowly fade. They can be better recognized in the synthetic data in which they are not obscured by ambient noise. The apparent velocities of the main features fit the observed data.
Table 2Overview of the layers in Figs. 4 and 5 including interpretation of the unit and seismic velocities for each layer at OBH501.
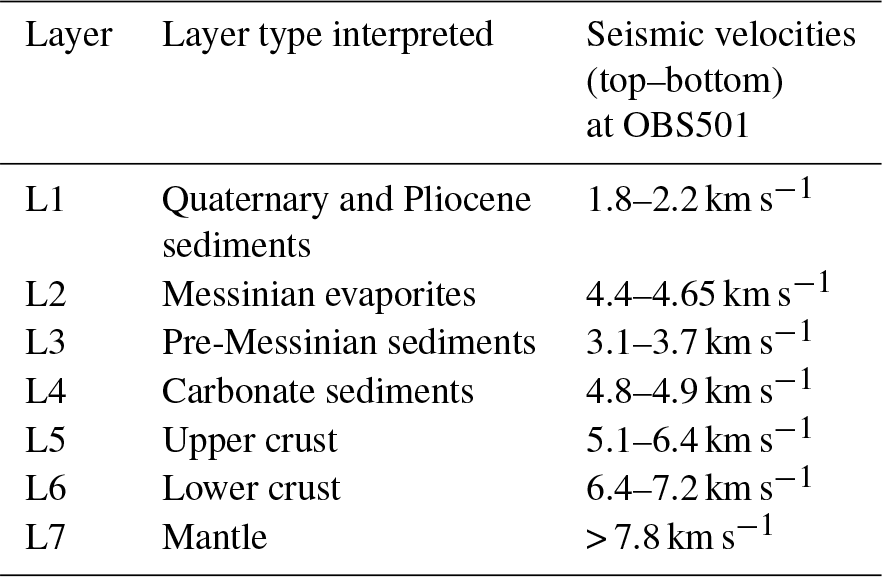
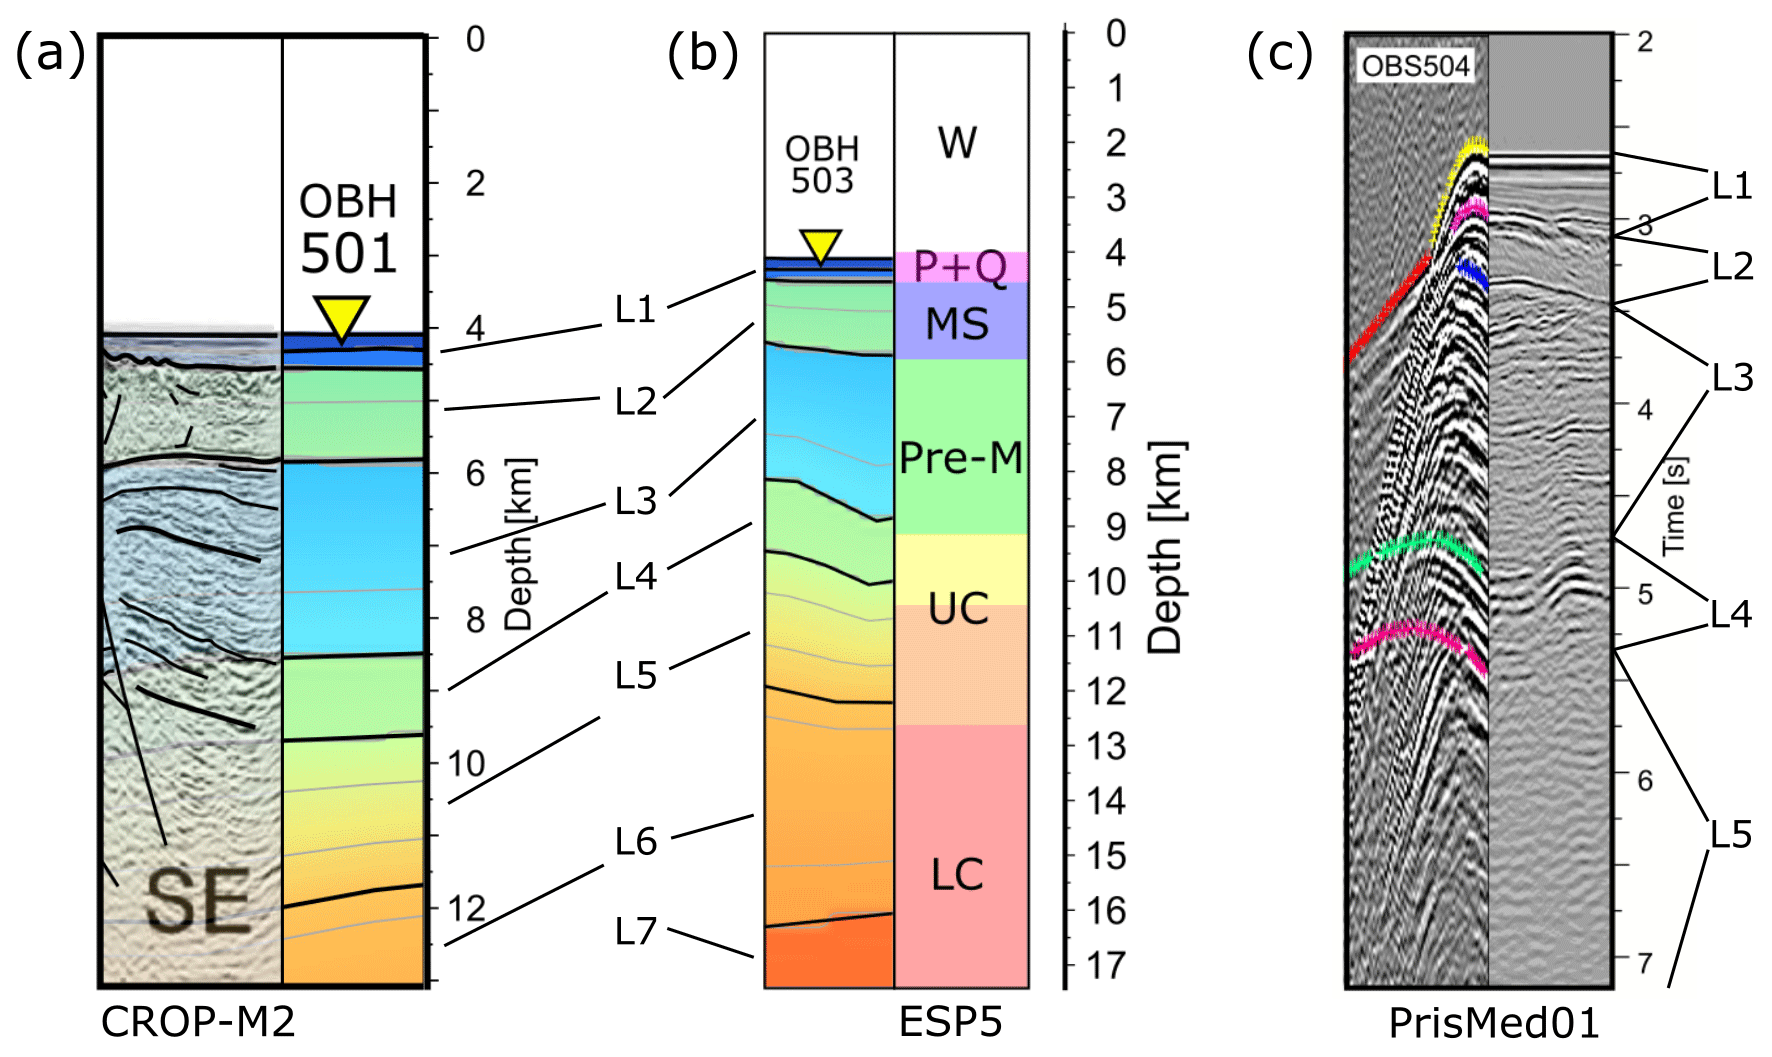
Figure 7Comparison of the data and the final velocity model from this study (OBH501, OBH503, OBS504) with previous studies: (a) CROP M2 (Polonia et al., 2011), (b) ESP5 (de Voogd et al. 1992), and (c) PrisMed01 (Gallais et al., 2011). L1–L7 follow the same layer convention as in the final velocity model. Abbreviations in panel (b): W – water, P+Q – Pliocene and Quaternary sediments, MS – Messinian sediments, Pre-M – pre-Messinian sediments, UC – upper crust, LC – lower crust.
5.1 Deformation and tectonic thickening at the front of the Calabrian accretionary prism
Folds in the sedimentary units have been observed at different depth levels at the sea floor within the Plio–Quaternary unit and in the Messinian evaporites (Fig. 2); however, we do not interpret this as a result of deformation stepping back in time towards the north. We rather interpret the scenario as deformation occurring at all three depth levels, most likely simultaneously, caused by the distributed thrusting at the toe of the Calabrian accretionary wedge. Along the MCS line CALA-15, which crosses our profile in the northern IAP (Fig. 1), frontal thrusting affecting the sea floor was observed, as was a zone of “proto-thrusts” that deform deeper layers, but without reaching the sea floor yet (Polonia et al., 2011) (see their Fig. 8). The same is true for the line PrisMed-1 (Gallais et al., 2012) (see their Fig. 5a). The distribution of the deformation fronts is most likely a function of the rheological properties of the different layers. In fact, we observe distributed shortening and tectonic thickening of the Messinian salt unit, resulting in an obscured and chaotic A reflector within a short distance towards the north. While the Plio–Quaternary sediments at greater depth show gently undulating folds, we observe an increase in the amplitude of these folds towards the north where they affect the entire Plio–Quaternary sediment unit up to the sea floor. We interpret the sudden onset of strongly undulating folds expressed at the sea floor as the signature of the outer deformation front of the Calabrian wedge at the sea floor, while the Plio–Quaternary sediments at the bottom of the unit are already affected by the growth of the accretionary wedge. Along the approximately perpendicular MCS profile CALA-15 the same pattern is observed from SE to NW (Polonia et al., 2011). The thickness of the Plio–Quaternary sediments is predominantly constant (Figs. 2 and 4), supporting the idea that rheological properties influence the location of the deformation front at each layer. The MCS profile CROP M2 (Polonia et al., 2011) crosses the DY-05 profile at OBH501 (Fig. 7a). Polonia et al. (2011) interpreted the base of the Messinian evaporites as the detachment acting as the plate boundary between the post-Messinian wedge (Eurasia) and pre-Messinian sediments on top of the very old African subducting oceanic crust. This would indeed be consistent with our observations of a B reflector that can be traced through almost the entire profile and the undisturbed flat-lying Plio–Quaternary sediments on top of the Messinian evaporites, which are affected in the north by the advancing Calabrian wedge.
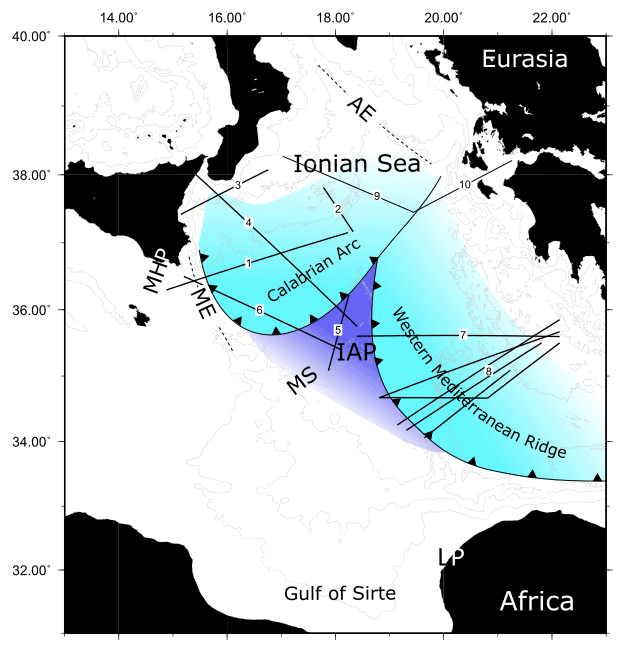
Figure 8Dark blue marks the presence of oceanic lithosphere below the sea floor in the Ionian Abyssal Plain (undeformed portion) as determined by seismic studies. Light blue areas mark the extent of buried oceanic lithosphere below adjacent accretionary wedges as determined by seismic studies. Profiles 1–5: M111; profile 6: Makris et al. (1986) and Finetti (2003) (part of CROP M23A); profiles 7–8: IMERSE profiles (Fruehn et al., 2001; Westbrook and Reston, 2002; Reston et al., 2002); profiles 9 and 10: ION6 (Cernobori et al., 1996) and ION7 (Kokinou et al., 2003). AE – Apulian Escarpment. Further abbreviations are explained in Fig. 1.
5.2 Pre-Messinian sedimentary layers
Beneath the B reflector, the seismic signal is strongly attenuated both in the OBS and MCS data. In the MCS data, short reflective bands can be observed, indicating pre-Messinian sedimentary layering. The OBS data show a sequence of steep angle reflections with high frequencies. However, a comparison of OBS and MCS data proved unsuitable to correlate the observed phases at the different stations. The model in this portion is highly unreliable, especially the velocity information with absolute velocities and the velocity gradient.
Layer 4 was the next layer that could be verified by a high-amplitude, low-frequency reflector. Based on the absolute velocity and the low-velocity gradient it is interpreted as a sedimentary layer. While de Voogd et al. (1992) interpreted layer 4 (Fig. 4a) as oceanic upper-crust layer 2A, we interpret this to be a 1 km thick layer of fast sediments, possibly carbonate sediments of Mesozoic age (Polonia et al., 2011) (Fig. 7b). For seismic layer 2 of oceanic crust, we would expect a high-velocity gradient with absolute velocities lower than observed (< 4.4 km s−1) (Carlson, 1998; White et al., 1992; Grevemeyer et al., 2018) or a low-velocity gradient with higher absolute velocities (> 5.7 km s−1) for continental crust (Christensen and Mooney, 1995). Finetti (1982), LeMeur (1997), and Gallais et al. (2011) also proposed that L4 represents a further Mesozoic sedimentary unit, which is supported by the imaged layered facies in their studies (compare Fig. 7c).
5.3 Nature of the lithosphere of the Ionian Abyssal Plain
Based on the results of our seismic modelling and the gravimetric modelling, we interpret the IAP to be of oceanic nature with a thickness of 6–7 km. Further south in the vicinity of the Medina seamounts, we observe a change in the characteristics of the crust towards a continental type of crust with a thickness of 9 km. We briefly resume the discussion from the Introduction in the context of our results, and we will concentrate on the lithosphere of the central IAP.
Thinned continental crust vs. oceanic crust. In Fig. 4b we compare seismic velocity–depth profiles along profile DY-05 with a velocity–depth ensemble for magmatic crust (Grevemeyer et al., 2018), as well as with a velocity–depth ensemble for continental metamorphic crust (Christensen and Mooney, 1995) that includes extended continental crust. The seismic velocities within the basement obtained from the final velocity model (Fig. 4a) plot into the velocity–depth field typical for oceanic crust but are too fast for continental crust (Fig. 4b).
Hyperextended continental crust vs. oceanic crust. Thinned or extended continental crust is slower than normal continental crust (Christensen and Mooney, 1995). In a seismic refraction study in the Gulf of California (Lizarralde et al., 2007), seismic velocities have been shown to decrease as the continental crust becomes thinner towards the continent–ocean transition zone. Lower-crust velocities reach 6.4 km s−1, which is much slower than observed in the final velocity model along DY-05 (Fig. 4a).
In conclusion, based on seismic P-wave velocities, the lithosphere of the central IAP is interpreted to be of oceanic type. This is supported by the gravity modelling results presented in Fig. 5. To continue the discussion we want to investigate if the oceanic domain is constructed of magmatic crust or serpentinized mantle.
Serpentinized mantle vs. magmatic crust. In Fig. 4b we show the velocity–depth ensemble for serpentinized mantle found in the Tyrrhenian Sea (Prada et al., 2016). At shallow depth (∼2 km into the basement) the profile fits both ensembles for magmatic crust and serpentinized mantle. Based on seismic P-wave velocities only it is not possible to discriminate between upper crust and highly serpentinized mantle. However, at greater depth lower-crust velocities typical for gabbro (Carlson and Miller, 2004) are observed. The data fit the ensemble for magmatic crust as observed by Grevemeyer et al. (2018), and we exclude serpentinized mantle on top of gabbroic crustal rocks.
We conclude that based on seismic P-wave velocities, the lithosphere of the central IAP comprises magmatic crust with a crustal thickness of 6–7 km (Fig. 5). Our gravity modelling along profile DY-05 (Fig. 5) shows a good fit assuming oceanic crust in the central and northern part of the profile with a possible change in crustal type towards the south and towards the extension of the Malta Escarpment.
Previous and recent studies of the area are combined in Fig. 8 to show the distribution of oceanic lithosphere in the Ionian Sea. In the following discussion we want to summarize previous works and compare them to our results.
-
Hieke et al. (2003) presented an extensive discussion of previous work and argued that based on magnetic anomalies, missing heat flow anomalies, and the gravity data, the IAP is a thinned part of the African continental crust. We agree that the system seems to be in equilibrium regarding the heat flow; however, similar low values of 38–46 mW M−2 are expected for very old oceanic crust as well (Sclater et al., 1980). Our interpretation of a possible change in crustal type from the central IAP towards the Medina seamounts and the extension of the ME is supported by new marine satellite gravity maps of the area (Sandwell et al., 2014). We can identify the deep-seated ME as a transition zone from continental to oceanic type of crust, further south towards the Medina seamounts.
-
Similar to our findings, Makris et al. (1986) observed velocities up to 7.2 km s−1 resulting from oceanic crust. However, the authors could not exclude stretched continental crust with intruded upper mantle. The stations within the IAP failed and their profile could only be extended to the IAP based on shots within the IAP recorded at stations outside the IAP. This leaves their results with a high uncertainty in this portion of the profile. This lack of resolution was overcome by the design of profile DY-05 that has a dense shot (∼140 m) and station (∼7.6 km) spacing.
-
Thinned continental crust in the IAP was interpreted by Finetti and Morelli (1973) and Finetti (1981, 1982) based on gravity data; however, they could not explain the gravity data without having mantle material that intruded into the crust. In a later work based on seismic MCS line CROP M3, Finetti (2003) interpreted the crust east of the ME to be of oceanic nature, with a crystalline basement at 7 to 8 s twt, which is, if converted into depth, similar to our findings. As part of the work of Polonia et al. (2011) the data were reprocessed and the authors could confirm the occurrence of oceanic crust east of the ME. During RV Meteor M111 cruise, wide-angle refraction seismic data (DY-01) were acquired along CROP M3 (Dellong et al., 2018). In this study the deeper crustal structures along the profile could be better resolved and the authors proved that oceanic crust has been subducted into the CA.
-
De Voogd et al. (1992) analysed the ESP5 data from a two-ship experiment in the vicinity of OBS502. We find similar results for the shallow part of the models (Fig. 7b), while the deeper portions vary regarding the depth of the layers. The crustal thickness at ESP5 is about 8 km versus 6 km at OBS502 along profile DY-05. The lower crust has a similar thickness for both experiments. We observe a seismic mantle velocity of 7.8 km s−1 at the crust–mantle boundary that is increasing with depth in at least the upper 2 km below the Moho, while the studies of the ESP5 experiment (de Voogd et al., 1992) (Fig. 7b) and Makris et al. (1986) show constant mantle velocities of 8.1 and 8.5 km s−1.
-
Sioni (1996) and Gallais et al. (2011) interpreted the high-amplitude reflector at 8 s twt (in the seismic line PrisMed01) as the top of oceanic crust. The reflectors from OBS502 and PrisMed01 lines show an ideal fit (Fig. 7c).
-
Polonia et al. (2017) interpreted diapiric structures in the CA to be constructed of serpentine. In our study as well as in the seismic study from Dellong et al. (2018) we find no evidence for major serpentine structures as layers in the IAP lithosphere or in the vicinity of fault systems in the CA. This does not rule out the findings of Polonia et al. (2017) for the CA region, where a fossil fracture zone might has been subducted, allowing serpentinized material to rise.
5.4 The oceanic IAP in the frame of plate tectonics
The geophysical characteristics, for example seismic velocities, crustal thickness, densities (Figs. 4 and 5), and heat flow, confirm the IAP to be oceanic lithosphere. The IAP is consequently a leftover of the Tethyan lithosphere, and the Apulia–Adriatic domain and the eastern Mediterranean basin do not belong to the former southern continental margin of the Tethys as suggested by Roure et al. (2012). However, the isostatic equilibrium and magnetic anomalies exclude a sea-floor age younger than Late Triassic or Early Jurassic (de Voogd et al., 1992; Stampfli, 2000; Speranza et al., 2012). The Apulian Escarpment in the N and the Malta Escarpment in the SW are bounding the Tethys basin and are most probably transform margins (Gallais et al., 2011; Frizon de Lamotte et al., 2011) and not conjugate passive margins (Catalano et al., 2001). They are present as steep and high steps in the sea-floor bathymetry, which is not expected at passive margins where sedimentation and erosion over a period of ∼200 Myr would overprint and smoothen the topography (Mosher et al., 2017). Additionally, the ME and the AE as passive margins would require a plate boundary in the NW–SE direction within the Ionian basin, which has not been observed so far. On the other hand, interpreting the ME and the AE as transform margins, a plate boundary would be expected in the SW–NE direction, parallel to the observed deep reverse faults beneath the IAP (Gallais et al., 2011; Polonia et al., 2011) (Fig. 1), and could explain our results of the observed transition from oceanic crust towards continental crust in the vicinity of the Medina seamounts (Fig. 4).
Oceanic lithosphere is considered to be rigid and shows little deformation compared to continental lithosphere that is mechanically weak, especially when thinned (Polonia et al, 2016). An IAP made of Tethyan lithosphere, due to its rigidity, would imply that the connection between Africa and Adria was rigid since the end of oceanic spreading in the early Mesozoic. However, deformation within the IAP lithosphere was observed in seismic data by Gallais et al. (2011), Polonia et al. (2011) (Fig. 1), and in this study (Fig. 2). The deformation caused by contraction is possibly connected to subduction processes during Neogene times and subduction might be still active. The connection between Adria and Africa during Neogene times is consequently not particularly rigid (Gallais et al., 2011; Le Breton et al., 2017) as proposed earlier (e.g. Channell et al., 1979; Dewey et al., 1989), and Adria might move relative to Africa. This supports the hypothesis of an independent Adriatic microplate that was separated during the opening of the Tethys as proposed in reconstructions by Handy et al. (2010) and Ustaszewski et al. (2008).
Our new seismic velocity model images the deep subsurface of the Ionian Abyssal Plain in more detail than previous approaches. In addition, gravimetric modelling validates these findings. We interpret the layer directly above the crystalline basement, interpreted earlier as layer 2A, as a unit of seismically fast sediments, possibly carbonates of Mesozoic age. This is in agreement with the warm environment during the formation of the Tethys Ocean. Our data and the model indicate that the Ionian Abyssal Plain is underlain by oceanic crust with seismic velocities increasing with depth from 5.1 to 7.2 km s−1. The thickness of the crust in the Ionian Abyssal Plain is 6–7 km but thickens to ∼9 km in the south. At the crust–mantle boundary crustal seismic velocities decrease from 7.2 km s−1 in the north to 6.8 km s−1 in the south. This change in the crustal structure supports the interpretation of the Malta Escarpment as a transform margin, reactivated normal faults in the SW–NE direction in the Ionian microplate, and a passive margin in the vicinity of the Medina seamounts.
Based on the seismic and gravimetric results the crust is interpreted to be oceanic. We consider the Ionian Abyssal Plain to be a remnant of the Tethys lithosphere. This supports the hypothesis that the Adria was a rigid promontory of Africa until the beginning of the opening of the Tethys in the early Mesozoic. During the opening of the Tethys, the Adriatic microplate was separated from Africa. Between the end of spreading in the early Mesozoic and the formation of the Calabrian Arc in the Miocene the connection between Adria and Africa might have been rigid. However, at least in Neogene times, the Tethyan lithosphere was less rigid, allowing the Adria microplate to move relative to Africa again. This places the African Plate margin much further south than previously thought, to the Hellenic subduction zone and the Calabrian subduction zone, and supports an Adria microplate that can move relative to Africa and Europe.
Seismic data are available on request from the first or second author or via https://doi.org/10.1594/PANGAEA.899796 (Dannowski and Kopp, 2019).
The authors declare that they have no conflict of interest.
The cruise M111 of RV Meteor was funded by the Deutsche
Forschungsgemeinschaft (DFG) with additional support from GEOMAR. Our special
thanks go to the captain and crew of RV Meteor for their excellent support
at sea. We thank Alina Polonia and Eline Le Breton for their detailed and
helpful reviews to improve the paper.
The article processing charges for this open-access
publication were covered by a Research
Centre of the Helmholtz Association.
This paper was edited by Patrice Rey and reviewed by Eline Le Breton and Alina Polonia.
Argnani, A. and Bonazzi, C.: The Malta Escarpment fault zone offshore eastern Sicily: Pliocene-Quaternary tectonic evolution based on new multichannel seismic data, Tectonics, 24, TC4009, https://doi.org/10.1029/2004TC001656, 2005.
Baldi, P., Degli Angioli, E., Piallini L., and Mantovani, E.: Gravity anomaly interpretation in the Calabrian Arc and surrounding regions: a tridimensional approach, Earth Evol. Sci., 3, 243–247, 1982.
Barreca, G., Scarfì, L., Cannavò, F., Koulakov, I., and Monaco, C.: New structural and seismological evidence and interpretation of a lithospheric-scale shear zone at the southern edge of the Ionian subduction system (central-eastern Sicily, Italy), Tectonics, 35, 1489–1505, https://doi.org/10.1002/2015TC004057, 2016.
Carlson, R. L.: Seismic velocities in the uppermost oceanic crust: Age dependence and the fate of layer 2A, J. Geophys. Res., 103, 7069–7077, https://doi.org/10.1029/97JB03577, 1998.
Carlson, R. L. and Herrick, C. N.: Densities and porosities in the oceanic crust and their variations with depth and age, J. Geophys. Res., 95, 9153–9170, https://doi.org/10.1029/JB095iB06p09153, 1990.
Carlson, R. L. and Miller, D. J.: Influence of pressure and mineralogy on seismic velocities in oceanic gabbros: Implications for the composition and state of the lower oceanic crust, J. Geophy. Res., 109, B09205, https://doi.org/10.1029/2003JB002699, 2004.
Catalano, R., Doglioni, C., and Merlini, S.: On the Mesozoic Ionian Basin, Geophys. J. Int., 144, 49–64, https://doi.org/10.1046/j.0956-540X.2000.01287.x, 2001.
Cernobori, L., Hirn, A., McBride, J. H., Nicolich, R., Petronio, L., and Romanelli, M.: Crustal image of the Ionian basin and its Calabrian margins, Tectonophysics, 264, 175–189, https://doi.org/10.1016/S0040-1951(96)00125-4, 1996.
Chamot-Rooke, N., C. Rangin, X. Le Pichon, and Dotmed Working Group: DOTMED–Deep Offshore Tectonics of the Mediterranean: A synthesis of deep marine data in eastern Mediterranean, Mem. Soc. Geol. Fr., 177, 64 pp., 69 maps with CD-ROM, 2005.
Channell, J. E. T., D'Argenio, B., and Horvath, F.: Adria, the African promontory, in Mesozoic Mediterranean palaeogeography, Earth Sci. Rev., 15, 213–292, https://doi.org/10.1016/0012-8252(79)90083-7, 1979.
Chiarabba, C., De Gori, P., and Speranza, F.: The southern Tyrrhenian subduction zone: Deep geometry, magmatism and Plio-Pleistocene evolution, Earth Planet. Sc. Lett., 268, 408–423, https://doi.org/10.1016/j.epsl.2008.01.036, 2008.
Christensen, N. I. and Mooney, W. D.: Seismic velocity structure and composition of the continental crust: A global view, J. Geophys. Res.-Sol. Ea., 100, 9761–9788, https://doi.org/10.1029/95JB00259, 1995.
Cita, M. B., Ryan, W. B. F., and Kidd, R. B.: Sedimentation rates in Neogene deep-sea sediments from the Mediterranean and geodynamic implications of their changes, edited by: Kidd, R. B. and Worstell, P. J., Init. Rep. DSDP XLII (part 1), 991–1002, 1978.
Cloetingh, S., Nolet, G., and Wortel, R.: Crustal structure of the Eastern Mediterranean inferred from Rayleigh wave dispersion, Earth Planet Sc. Lett., 51, 336–342, 1980.
Dannowski, A. and Kopp, H.: A seismic refraction and wide-angle reflection profile M111 – DY-05 during METEOR cruise M111 in the Ionian Sea, with links to SGY data files, PANGAEA, https://doi.org/10.1594/PANGAEA.899796, 2019.
Della Vedova, B. and Pellis, G.: New heat flow density measurements in the Ionian sea, Atti VIII Convegno GNGTS, Roma, 1133–1145, 1989.
Dellong, D., Klingelhoefer, F., Kopp, H., Graindorge, D., Margheriti, L., Moretti, M., Murphy, S., and Gutscher, M.-A.: Crustal structure of the Ionian basin and eastern Sicily margin: Results froma wide-angle seismic survey, J. Geophys. Res., 123, 2090–2114, https://doi.org/10.1002/2017JB015312, 2018.
de Voogd, B., Truffert, C., Chamot-Rooke, N.. Huchon, P., Lallemant, S., and Le Pichon, X.: Two-ship deep seismic soundings in the basins of the Eastern Mediterranean Sea (Pasiphae cruise), Geophys. J. Int., 109, 536–552, 1992.
Dewey, J. F., Helman, M. L., Knott, S. D., Turco, E., and Hutton, D. H. W.: Kinematics of the western Mediterranean, Geol. Soc. Spec. Publ., 45, 265–283, https://doi.org/10.1144/GSL.SP.1989.045.01.15, 1989.
Faccenna, C., Becker, T. W., Pio Lucente, F., Jolivet, L., and Rosetti, F.: History of subduction and back-arc extension in the Central Mediterranean, Geophys. J. Int., 145, 809–820, 2001.
Faccenna, C., Piromallo, C., Crespo-Blanc, A., and Jolivet, L.: Lateral slab deformation and the origin of the western Mediterranean arcs, Tectonics, 23, TC1012, https://doi.org/10.1029/2002TC001488, 2004.
Faccenna, C., Becker, T. W., Auer, L., Billi, A., Boschi, L., Brun, J. P., Capitanio, F. A., Funiciello, F., Horvàth, F., Jolivet, L., Piromallo, C., Royden, L., Rossetti, F., and Serpelloni, E.: Mantle dynamics in the Mediterranean, Rev. Geophys., 52, 283–332, https://doi.org/10.1002/2013RG000444, 2014.
Ferrucci, F., Gaudiosi, G., Hirn, A., and Nicolich, R.: Ionian basin and Calabrian arc: some new elements from DSS Data, Tectonophysics, 195, 411–419, 1991.
Finetti, I.: Geophysical study on the evolution of the Ionian Sea, in: Sedimentary basins of Mediterranean margins, edited by: Wezel, F. C., C.N.R. Italian Project of Oceanography, Bologna (Tecnoprint), 465–484, 1981.
Finetti, I.: Structure, stratigraphy and evolution of central Mediterranean, B. Geofis. Teor. Appl., 24, 247–312, 1982.
Finetti, I.: The CROP profiles across the Mediterranean Sea (CROP MARE I and II), in: Memorie descrittive della carta geologica d'Italia – CROP Atlas – Seismic Reflection Profiles of the Italian Crust, LXII, 171–184, 2003.
Finetti, I. and Morelli, C.: Wide scale digital seismic exploration of the Mediterranean Sea, B. Geofis. Teor. Appl., 14, 291–342, 1972.
Finetti, I. and Morelli, C.: Geophysical exploration of the Mediterranean Sea, B. Geofis. Teor. Appl., 15, 263–341, 1973.
Finetti, I., Lentini, F., Carbone, S., Catalano, S., and Del Ben, A.: Il sistema Appennino Meridionale–Arco Calabro–Sicilia nel Mediterraneo Centrale: studio geologico-geofisico, Boll. Soc. Geol. Ital., 115, 529–559, 1996.
Frizon de Lamotte, D., Raulin, C., Mouchot, N., Wrobel-Daveau, J. C., Blanpied, C., and Ringenbach, J. C.: The southernmost margin of the Tethys realm during the Mesozoic and Cenozoic: Initial geometry and timing of the inversion processes, Tectonics, 30, TC3002, https://doi.org/10.1029/2010TC002691, 2011.
Frizone de Lamotte, D., Fourdan, B., Leleu, S., Leparmentier, F., and de Clarens, P.: Style of rifting and the stages of Pangea breakup, Tectonics, 34, 1009–1029, https://doi.org/10.1002/2014TC003760, 2015.
Fruehn, J., Reston, T. J., Huene, R. V., and Bialas, J.: Structure of the Mediterranean Ridge accretionary complex from seismic velocity information, Mar. Geol., 186, 43–58, 2001.
Fujie, G., Kasahara, J., Murase, K., Mochizuki, K., and Kaneda, Y.: Interactive analysis tools for the wide-angle seismic data for crustal structure study (Technical Report), Geophysical Exploration (BUTSURI-TANSA), 61, 26–33, 2008.
Gallais, F., Gutscher, M. A., Graindorge, D., Chamot-Rooke, N., and Klaeschen, D.: A Miocene tectonic inversion in the Ionian Sea (central Mediterranean): Evidence from multichannel seismic data, J. Geophys. Res.-Sol. Ea., 116 B12108, https://doi.org/10.1029/2011JB008505, 2011.
Gallais, F., Gutscher, M. A., Klaeschen, D., and Graindorge, D.: Two-stage growth of the Calabrian accretionary wedge in the Ionian Sea (Central Mediterranean): Constraints from depth-migrated multichannel seismic data, Mar. Geol., 326–328, 28–45, https://doi.org/10.1016/j.margeo.2012.08.006, 2012.
Grevemeyer, I., Ranero, C. R., and Ivandic, M.: Structure of oceanic crust and serpentinization at subduction trenches, Geosphere, 14, 395–418, https://doi.org/10.1130/GES01537.1, 2018.
Gutscher, M. A., Kopp, H., Krastel, S., Bohrmann, G., Garlan, T., Zaragosi, S., Klaucke, I., Wintersteller, P., Loubrieu, B., LeFaou, Y., SanPedro, L., Dominguez, S., Rovere, M., Mercierde-Lepinay, B., Ranero, C., and Sallares, V.: Active tectonics of the Calabrian subduction revealed by new multi-beam bathymetric data and high-resolution seismic profiles in the Ionian Sea (Central Mediterranean), Eearth Planet. Sc. Lett., 461, 61–72, https://doi.org/10.1016/j.epsl.2016.12.020, 2017.
Handy, M. R., Schmid, S. M., Bousquet, R., Kissling, E., and Bernoulli, D.: Reconciling plate-tectonic reconstructions of Alpine Tethys with the geological–geophysical record of spreading and subduction in the Alps, Earth-Scie. Rev., 102, 121–158, https://doi.org/10.1016/j.earscirev.2010.06.002, 2010.
Hatzfeld, D., Besnard, M., Makropoulos, K., and Hatzidimitriou, P.: Microearthquake seismicity and fault-plane solutions in the southern Aegean and its geodynamic implications, Geophys. J. Int., 115, 799–818, https://doi.org/10.1111/j.1365-246X.1993.tb01493.x, 1993.
Hestholm, S. O., Husebye, E. S., and Ruud, B. O.: Seismic wave propagation in complex crust-upper mantle media using 2-D finite-difference synthetics, Geophys. J. Int., 118, 643–670, https://doi.org/10.1111/j.1365-246X.1994.tb03991.x, 1994.
Hieke, W., Hirschleber, H. B., and Dehghani, G. A.: The Ionian Abyssal Plain (central Mediterranean Sea): Morphology, subbottom structures and geodynamic history–an inventory, Mar. Geophys. Res., 24, 279–310, 2003.
Hsü, K. J., Montadert, L., Bernoulli, D., Bizon, G., Cita, M. B., Erickson, A., Fabricius, F., Garrison, R. E., Kidd, R. B., Mélières, F., Müller, C., and Wright, R. C.: Site 374: Messina Abyssal Plain, edited by: Kidd, R. B. and Worstell, P. J.: Init. Rep. DSDP XLII (part 1), 175–217, https://doi.org/10.2973/dsdp.proc.42-1.105.1978, 1978.
Jiménez-Munt, I. and Negredo, A.: Neotectonic modelling of the western part of the Africa-Eurasia plate boundary: From the Mid-Atlantic ridge to Algeria, Earth Planet. Sc. Lett., 205, 257–271, https://doi.org/10.1016/S0012-821X(02)01045-2, 2003.
Kokinou, E., Vafidis, A., Loucogiannakis, M., and Louis, I.: Deep Seismic Imaging and Velocity Estimation in Ionian Sea, J. Balkan Geophys. Soc., 6, 100–116, 2003.
Le Breton, E., Handy, M. R., Molli, G., and Ustaszewski, K.: Post-20 Ma Motion of the Adriatic Plate: New Constraints From Surrounding Orogens and Implications for Crust-Mantle Decoupling, Tectonics, V36, 3135–3154, https://doi.org/10.1002/2016TC004443, 2017.
Leister, K., Makris, J., Nicolich, R., and Rancke, D.: Crustal structure and crustal development in the Ionian Sea, Condenses Des Travaux Presentes Lors Du Xxxe Congres-Assemblee Pleniere de la C.I.E.S.M., Commission Internationale Pour l'Exploration Scientifique de la Mer Mediterranee, Paris, 30, 84, 1986.
LeMeur, D: Etude géophysique de la structure profonde et de la tectonique active de la partie occidentale de la Ride Méditerranéenne, 225 pp., PhD thesis, Univ. Paris XI, Paris, 1997.
Lizarralde, D., Axen, G. J. Brown, H. E. Fletcher, J. M. Gonzáles-Fernádez, A., Harding, A. J., Holbrook, W. S., Kent G. M., Paramo, P., Sutherland, F., and Umhoefer, P. J.: Variation in styles of rifting in the Gulf of California, Nature, 448, 466–469, https://doi.org/10.1038/nature06035, 2007.
Locardi, E. and Nicolich, R.: Geodinamica del Tirreno e dell'Appennino centro-meridionale: la nuova carta della Moho, Mem. Soc. Geol. It., 41, 121–140, 1988.
Makris, J., Nicolich, R., and Weigel, W.: A seismic study in the Western Ionian Sea, Ann. Geophys., 4, 665–678, 1986.
Mantovani, E., Albarello, D., Babbucci, D., Tamburelli, C., and Viti, M.: Trench-arc-back arc systems in the Mediterranean area: examples of extrusion tectonics, J. Virtual Explorer, 8, 131–147, https://doi.org/10.3809/jvirtex.2002.00050, 2002.
Micallef, A., Georgiopoulou, A., Mountjoy, J., Huvenne, V. A. I., Lo Iacono, C., Le Bas, T., Del Carlo, P., and Otero, D. C.: Outer shelf seafloor geomorphology along a carbonate escarpment: The eastern Malta Plateau, Mediterranean Sea, Cont. Shelf Res., 131, 12–27, https://doi.org/10.1016/j.csr.2016.11.002, 2016.
Morelli, C., Gantar, G., and Pisani, M.: Bathymetry, gravity and magnetism in the Strait of Sicily and in the Ionian Sea, B. Geofis. Teor. Appl., 17, 39–58, 1975.
Mosher, D. C., Campbell, D. C., Gardner, J. V., Piper, D. J. W., Chaytor, J. D., and Rebesco, M.: The role of deep-water sedimentary processes in shaping a continental margin: The Northwest Atlantic, Mar. Geol., 393, 245–259, https://doi.org/10.1016/j.margeo.2017.08.018, 2017.
Nicolich, R.: Crustal structures from seismic studies in the frame of the European Geotraverse (southern segment) and Crop projects, in: The Lithosphere in Italy, edited by: Boriani, A., Bonafede, M., Piccardo, G. B., and Vai, G. B., Accad. Naz. Lincei, 80, 41–61, 1989.
Pearce, F. D., Rondenay, S., Sachpazi, M., Charalampakis, M., and Royden, L. H.: Seismic investigation of the transition from continental to oceanic subduction along the western Hellenic Subduction Zone, J. Geophys. Res., 117, B07306, https://doi.org/10.1029/2011JB009023, 2012.
Polonia, A., Torelli, L., Mussoni, P., Gasperini, L., Artoni, A., and Klaeschen, D.: The Calabrien Arc subduction complex in the Ionian Sea: Regional architecture, active deformation, and seismic hazard, Tectonics, 30, TC5018, https://doi.org/10.1029/2010TC002821, 2011.
Polonia, A., Torelli, L., Artoni, A., Carlini, M., Faccenna, C., Ferranti, L., Gasperini, L., Govers, R., Klaeschen, D., Monaco, C., Neri, G., Nijholt, N., Orecchio, B., and Wortel, R.: The Ionian and Alfeo–Etna fault zones: New segments of an evolving plate boundary in the central Mediterranean Sea?, Tectonophysics, 675, 69–90, https://doi.org/10.1016/j.tecto.2016.03.016, 2016.
Polonia, A., Torelli, L., Gasperini, L., Cocchi, L., Muccini, F., Bonatti, E., Hensen, C., Schmidt, M., Romano, S., Artoni, A., and Carlini, M..: Lower plate serpentinite diapirism in the Calabrian Arc subduction complex, Nat. Commun., 8, 2172, https://doi.org/10.1038/s41467-017-02273-x, 2017.
Prada, M., Ranero, C. R., Sallarès, V., Zitellini, and Grevemeyer, I.: Mantle exhumation and sequence of magmatic events in the Magnaghi–Vavilov Basin (Central Tyrrhenian, Italy): New constraints from geological and geophysical observations, Tectonophysics, 689, 133–142, https://doi.org/10.1016/j.tecto.2016.01.041, 2016.
Reston, T. J., Huene, R. V., Dickmann, T., Klaeschen, D., and Kopp, H.: Frontal accretion along the western Mediterranean Ridge: the effect of Messinian evaporites on wedge mechanics and structural style, Mar. Geol., 186, 59–82, 2002.
Ricou, L. E.: Tethys reconstructed: Plates, continental fragments and their boundaries since 260 Ma, from Central America to south-eastern Asia, Geodin. Acta, 7, 169–218, https://doi.org/10.1080/09853111.1994.11105266, 1994.
Roure, F., Casero, P., and Addoum, B.: Alpine inversion of the North African margin and delamination of its continental lithosphere. Tectonics, 31, TC3006, https://doi.org/10.1029/2011TC002989, 2012.
Ryan, W. B. F., Hsü, K. J., Cita, M. B., Dumitrica, P., Lort, J. M., Maync, W., Nesteroff, W. D., Pautot, G., Stradner, H., and Wezel, F. C.: Initial Reports of the Deep Sea Drilling Project – Leg 13, U.S. Government Printing Office, Washington, Part 1, 1973.
Ryan W. B. F., Kastens, K. A., and Cita, M. B.: Geological evidence concerning compressional tectonics in the eastern Mediterranean, Tectonophysics, 86, 213–242, 1982.
Sandwell, D. T. and Smith, W. H. F.: Marine gravity anomaly from Geosat and ERS-1 satellite altimetry, J. Geophys. Res., 102, 10039–10054, https://doi.org/10.1029/96JB03223, 1997.
Sandwell, D. T., Müller, R.D., Smith, W. H. F., Garcia, E., and Francis, R.: New global marine gravity model from CryoSat-2 and Jason-1 reveals buried tectonic structure, Science 346, 65–67, https://doi.org/10.1126/science.1258213, 2014.
Scarascia, S., Lozej, A., and Cassinis, R.: Crustal structures of the Ligurian, Tyrrhenian and Ionian seas and adjacent onshore areas interpreted from wide-angle seismic profiles, B. Geofis. Teor. Appl., 36, 5–19, 1994.
Sclater, J. G., Jaupart, C., and Galson, D.: The heat flow through ocean and continental crust and the heat loss of the Earth, Rev. Geophys., 18, 269–311, https://doi.org/10.1029/RG018i001p00269, 1980.
Selvaggi, G. and Chiarabba, C.: Seismicity and P-wave velocity image of the southern Tyrrhenian subduction zone, Geophys. J. Int., 121, 818–826, https://doi.org/10.1111/j.1365-246X.1995.tb06441.x, 1995.
Sioni, S.: Mer Ionienne et Apulie depuis l'ouverture de l'Océan Alpin, PhD, Université de Bretagne Occidentale Brest, 241 pp., 1996.
Speranza, F., Minelli, L., Pignatelli, A., and Chiappini, M.: The Ionian Sea: The oldest in situ ocean fragment of the world?, J. Geophys. Res.-Sol. Ea., 117, https://doi.org/10.1029/2012JB009475, 2012.
Stampfli, G. M.: Tethyan oceans, Geological Society, London, Special Publications, 173, 1–23, https://doi.org/10.1144/GSL.SP.2000.173.01.01, 2000.
Stampfli, G. M., Borel, G. D., Marchant, R., and Mosar, J.: Western Alps geological constraints on western Tethyan reconstructions, Journal of the Virtual Explorer, 8, 75–104, 2002.
Talwani, M., Worzel, J. L., and Landisman, M.: Rapid gravity computations for two-dimensional bodies with application to the Mendocino submarine fracture zone, J. Geophys. Res., 64, 49–59, 1959.
Ustaszewski, K., Schmid, S. M., Fügenschuh, B., Tischler, M., Kissling, E., and Spakman, W.: A map-view restoration of the Alpine-Carpathian-Dinaridic system for the Early Miocene, Swiss J. Geosci., 101, 273–294, https://doi.org/10.1007/s00015-008-1288-7, 2008.
Westbrook, G. K. and Reston, T. J.: The accretionary complex of the Mediterranean Ridge: tectonics, fluid flow and the formation of brine lakes – an introduction to the special issue of Marine Geology, Mar. Geol., 186, 1–8, 2002.
White, R. S., McKenzie, D., and O'Nions, R. K.: Oceanic crustal thickness from seismic measurements and rare earth element inversions, J. Geophys. Res., 97, 19683–19715, 1992.
Zelt, C. A.: Modelling strategies and model assessment for wide-angle seismic traveltime data, Geophys. J. Int., 139, 183–204, https://doi.org/10.1046/j.1365-246X.1999.00934.x, 1999.
Zelt, C. A. and Forsyth, D. A.: Modeling wide-angle seismic data for crustal structure: Southeastern Grenville Province, J. Geophys. Res., 99, 11687–11704, https://doi.org/10.1029/93JB02764, 1994.
Zelt, C. A. and Smith, R. B.: Seismic traveltime inversion for 2-D crustal velocity structure, Geophys. J. Int., 108, 16–34, https://doi.org/10.1111/j.1365-246X.1992.tb00836.x, 1992.