the Creative Commons Attribution 4.0 License.
the Creative Commons Attribution 4.0 License.
 | 25 Apr 2019
The Ulakhan fault surface rupture and the seismicity of the Okhotsk–North America plate boundary
Boris Sedov
Susanne Lindauer
Kevin Mackey
New field work, combined with analysis of high-resolution aerial photographs, digital elevation models, and satellite imagery, has identified an active fault that is traceable for ∼90 km across the Seymchan Basin and is part of the Ulakhan fault system, which is believed to form the Okhotsk–North America plate boundary. Age dating of alluvial fan sediments in a channel system that is disturbed by fault activity suggests the current scarp is a result of a series of large earthquakes (≥Mw 7.5) that have occurred since 11.6±2.7 ka. A possible channel feature offset by 62±4 m associated with these sediments yields a slip rate of 5.3±1.3 mm yr−1, in broad agreement with rates suggested from global plate tectonics. Our results clearly identify the Ulakhan fault as the Okhotsk–North America plate boundary and show that tectonic strain release is strongly concentrated on the boundaries of Okhotsk. In light of our results, the likelihood of recurrence of Mw 7.5 earthquakes is high, suggesting a previously underestimated seismic hazard across the region.
- Article
(37830 KB) - Full-text XML
- BibTeX
- EndNote


Since the earliest days of plate tectonics, the Eurasia (Eur) and North America (NAm) plate boundary zone in northeastern Asia was recognised as a likely location for smaller blocks and micro-plates, even if these could not be precisely identified at the time (Morgan, 1968). The existence of an Okhotsk plate (Okh), encompassing a region including parts of northern Japan, most of the Kamchatka Peninsula, and Sakhalin Island, as well as a significant continental region north of the Okhotsk Sea, has been suggested by multiple studies using the usual plate-tectonic inverse methods (Seno et al., 1996; Apel et al., 2006; Sella et al., 2002). The northernmost portion of Okh forms a broadly triangular region squeezed between the converging Eur and NAm plates, whose pole of rotation lies more or less on their mutual boundary (Fig. 1), and a little way north of the NAm–Eur–Okh triple junction at the apex of Okh (Cook et al., 1986; Hindle et al., 2006, 2009). The northern end of Okh is also a region of diffuse seismicity and has undergone several relatively large (up to Mw 6.4) “intraplate” earthquakes (Fujita et al., 2002; McLean, 2009; McLean et al., 2009). However, the boundaries of this northern portion of the plate have remained difficult to clearly demonstrate, mostly for two reasons. One is the low deformation rate (≤5 mm yr−1 contraction–extrusion) leading to small numbers of earthquakes with well-defined focal mechanisms, usable in plate-tectonic studies. A second is the likelihood of elastic transient deformation affecting much of the region due to its proximity to locked plate boundaries, which makes rigid plate-tectonic interpretations of the limited amount of GPS data available problematic (Apel et al., 2006).
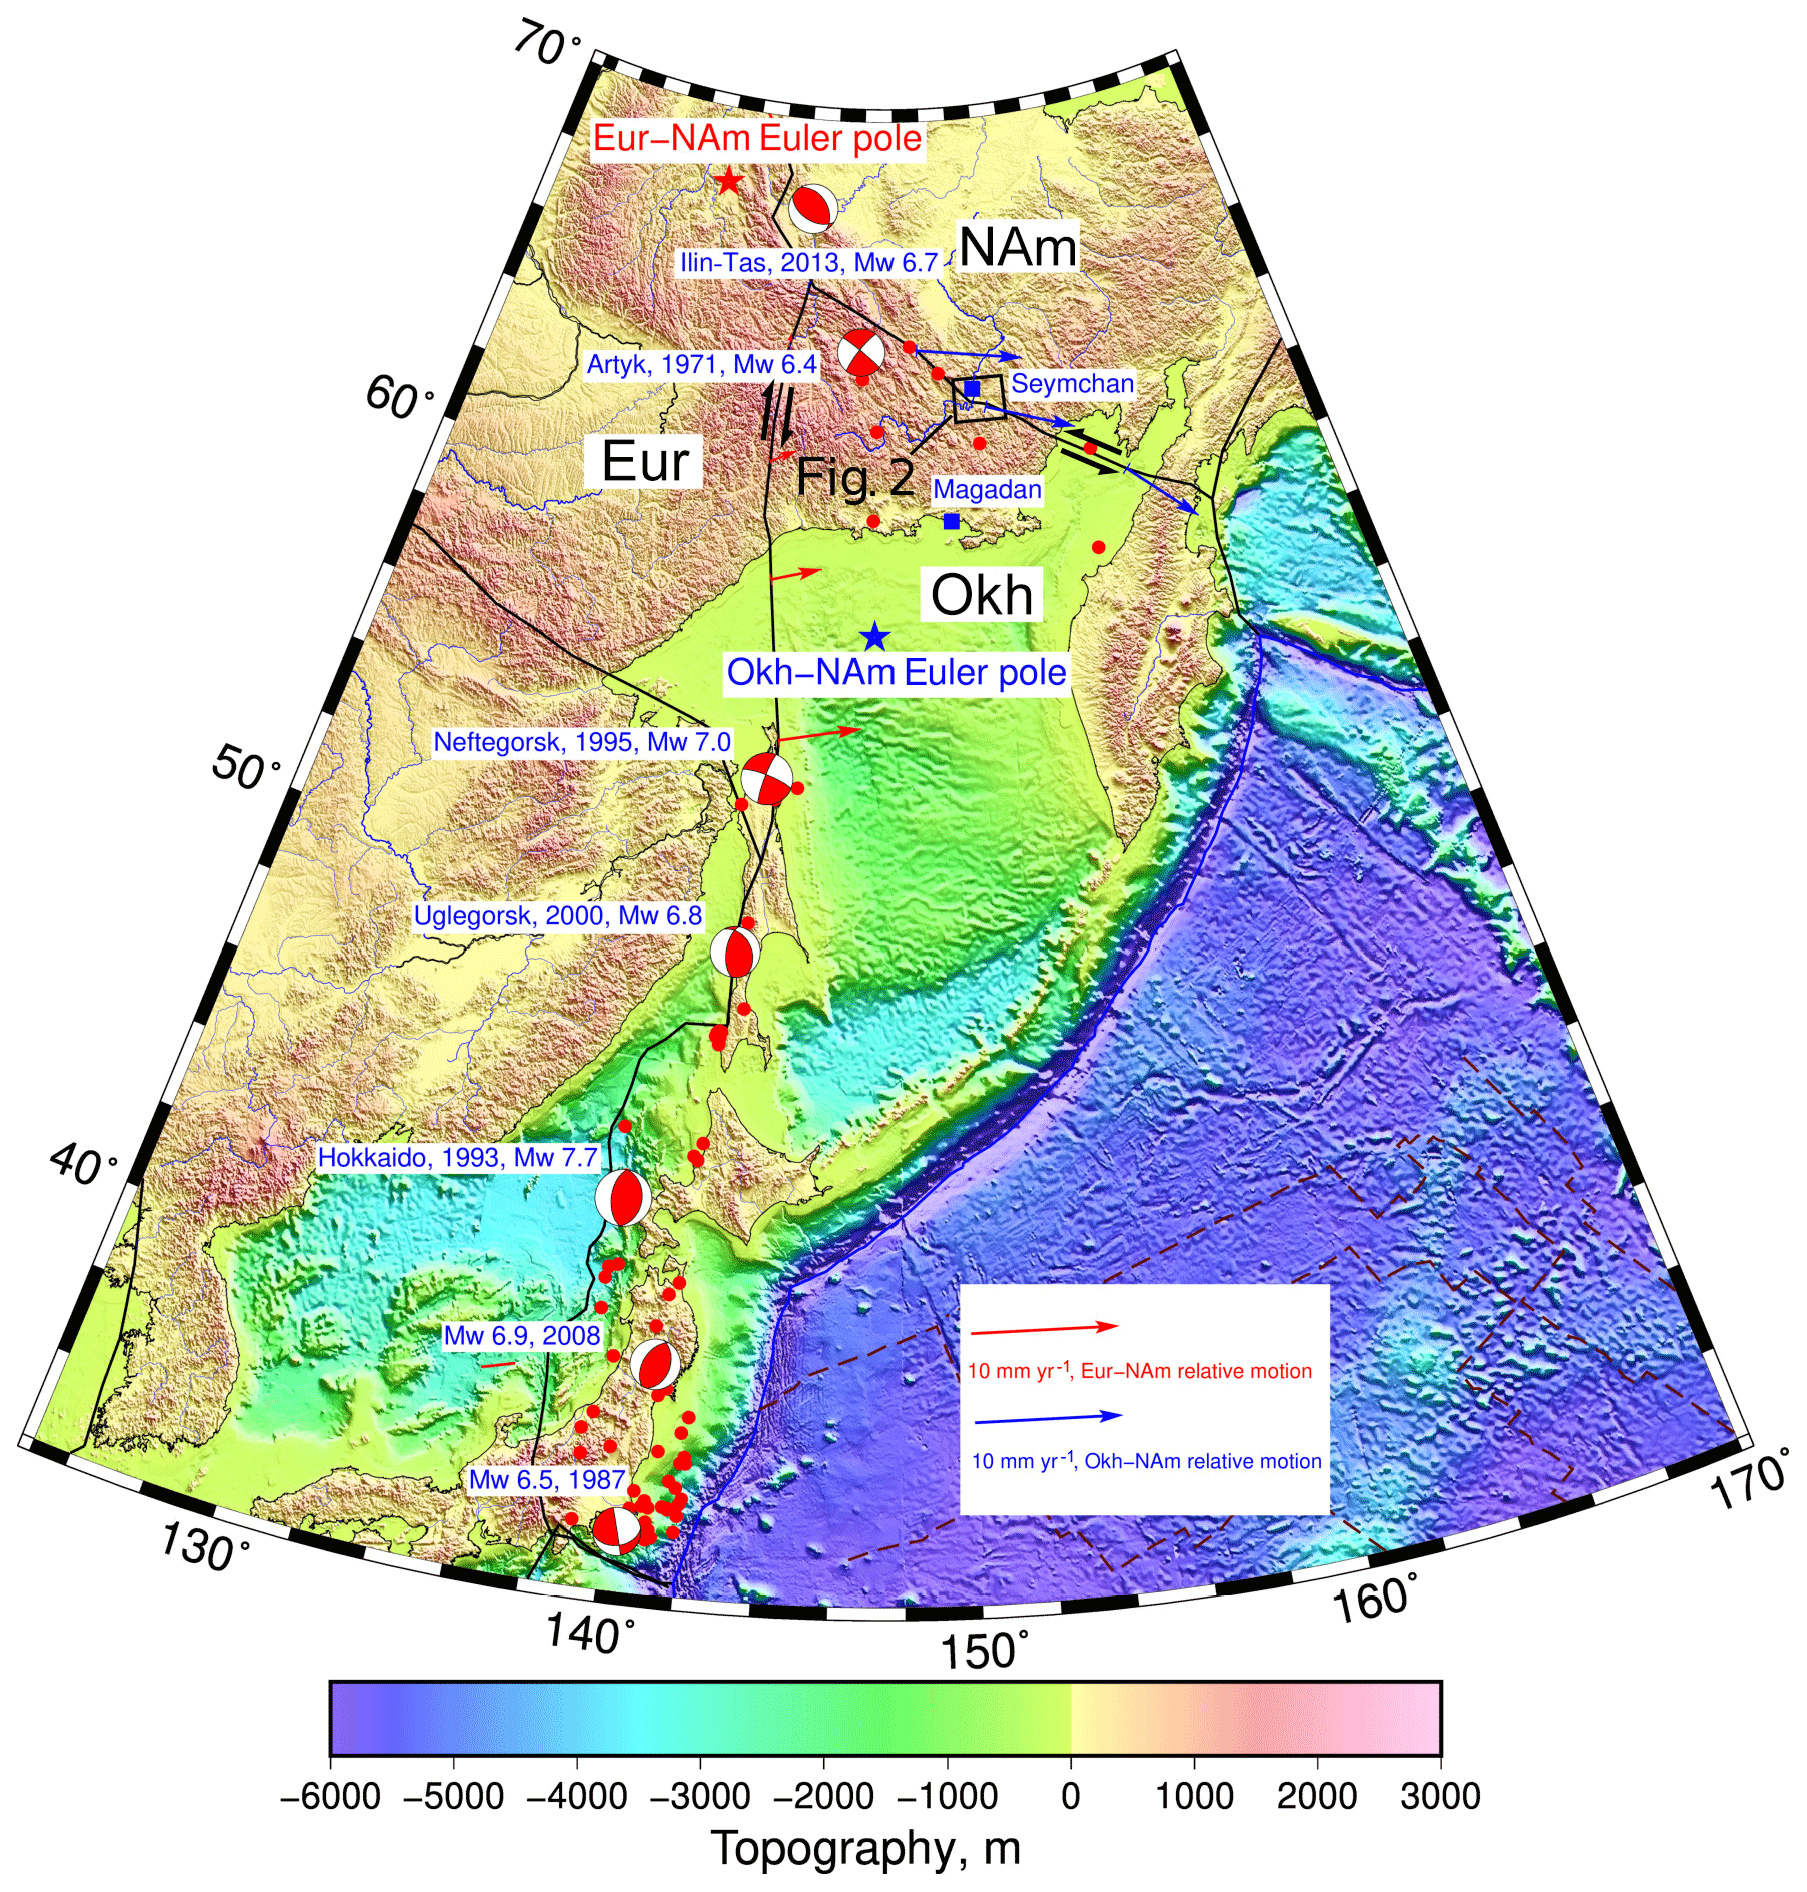
Figure 1Tectonics of the Okhotsk plate and surroundings. Earthquakes >Mw 5.0 are shown by red dots. Earthquakes >Mw 6.0 are shown with focal mechanisms. Locations of Eur–NAm and Okh–NAm poles used to calculate relative motion vectors (blue arrows: Okh–NAm; red arrows: Eur–NAm) shown by blue and red stars. The black box shows the location of Fig. 2 and of the study area, and the town of Seymchan. The region is principally considered a part of the Eurasia–North American plate boundary zone, and as such has increasingly been recognised to consist of a number of smaller plates or micro-plates, which can be proven to provide statistically better fits to global plate-tectonic data. Nevertheless, there is a considerable amount of intraplate seismicity in the region, especially northwestern Okh.
The Eur–Okh boundary is considered to run north from Sakhalin Island, where it is well defined by the Mw 7.0 Neftegorsk earthquake and aftershock sequences (Arefiev et al., 2000), and to continue into generally north trending, fault systems on land (Hindle and Mackey, 2011; Imaev et al., 1994). The NAm–Okh boundary is believed to correspond to the locally named Ulakhan fault system, which is traceable over distances of ∼800 km and trends approximately northwest (Hindle and Mackey, 2011). Whilst the large earthquake on the Eur–NAm boundary (the largest non-subduction-related earthquake in the region) gives strong evidence for an active plate boundary event within the modern seismic record, it is noticeable that no such observations have been made for the Ulakhan fault. Instead, the largest recorded earthquake in this region is apparently “intraplate”, and a small number of ∼M 5.0 earthquakes are all that have been associated with the trace of the Ulakhan fault and hence the assumed Okh–NAm boundary itself. This seems somewhat surprising, until one considers that the estimated displacement rates on this boundary are of the order of ∼5 mm yr−1, over a fault system >1000 km in total length. Hindle and Mackey (2011) thus argued that under various assumptions about how the northern portion of the Okhotsk plate moves relative to Eur and NAm, recurrence times for large earthquakes due to interplate motions could easily be >1000 years for any particular segment of the fault, but that events of Mw 8.0 were possible.
Certain tectonic features along the suggested Okh–NAm plate boundary have long been recognised as possible evidence of active tectonics. The most remarkable of these is the Seymchan basin (also known as the Seymchan–Buyunda basin), a northwest–southeast-trending depression, which forms a natural point of confluence for the Kolyma and Buyunda rivers (Fig. 2). Geological and geomorphological evidence, including Oligo-Miocene age, fluvio-lacustrine deposits and several apparent depocentres with >1000 m of fill and ongoing sedimentation through the Quaternary (Kuznetsov, 1989), suggests this basin has existed since some time in the mid-Tertiary to early Tertiary (late Paleogene–early Neogene). As such, it forms part of a series of sporadically distributed basins across the northern Okhotsk region, including offshore regions, which initially formed in a generally extensional–transtensional late Paleogene–early Neogene tectonic regime (Worrall et al., 1996; Nokleberg, 2005; Drabkun et al., 1970).
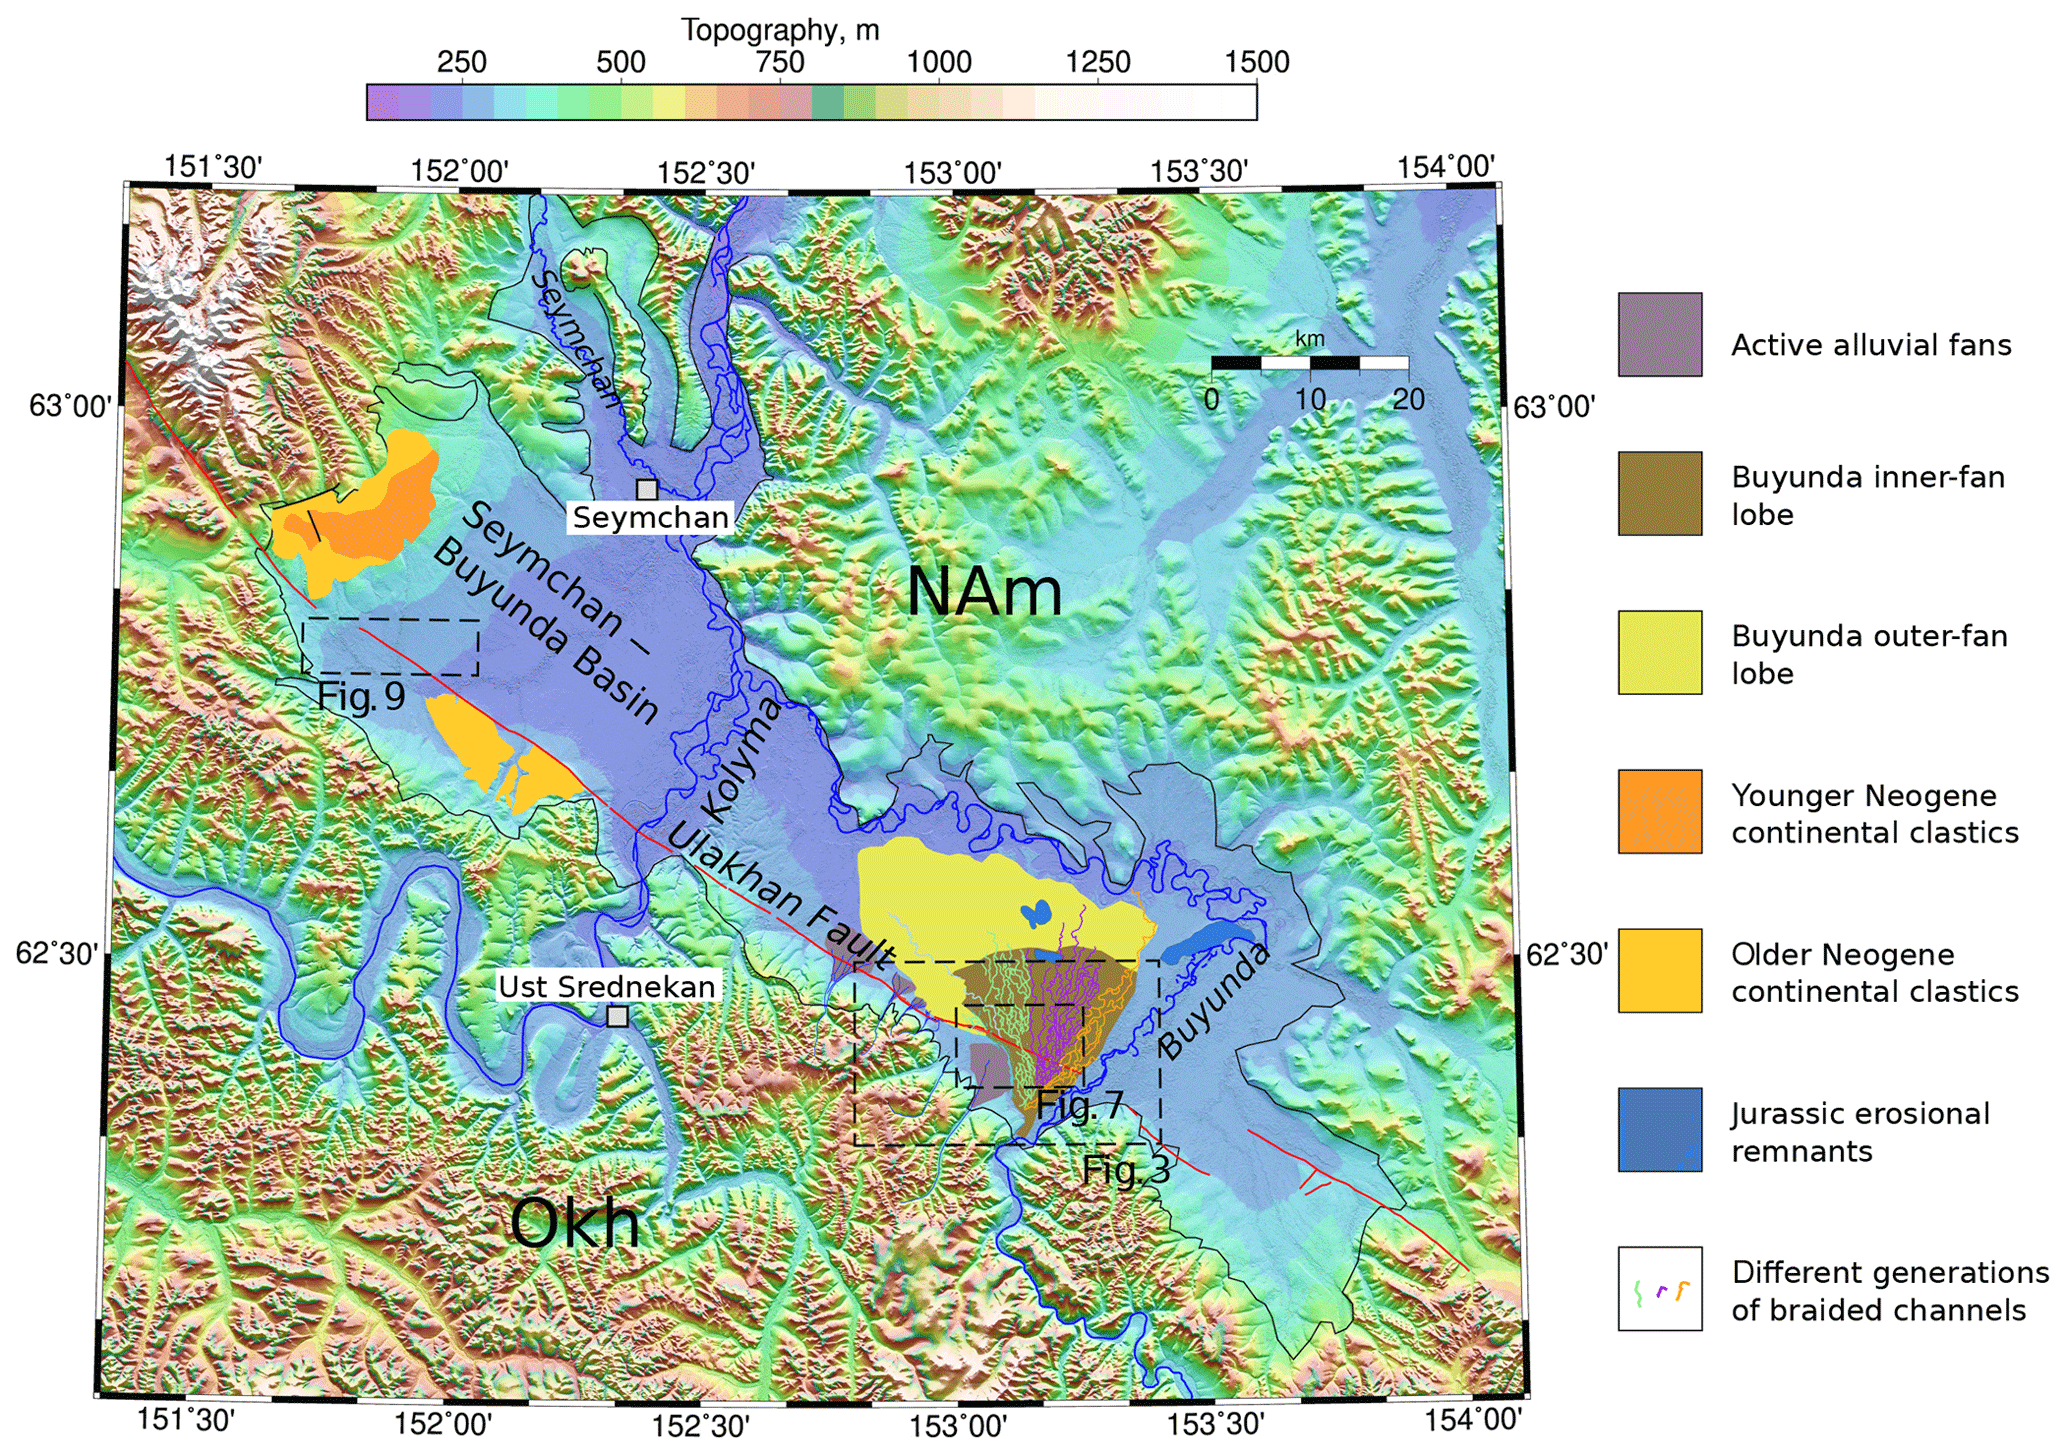
Figure 2Morphology and drainage of the Seymchan–Buyunda basin, showing Buyunda fan structure, palaeodrainage networks on fan surface, subsidiary fans along southern basin edge, Neogene sedimentary outcrops and the trace of the fault segment across the Seymchan Basin, identified from aerial photographs, satellite imagery and the TANDEM-X 0.4 arcsec DEM.
Today, the Kolyma and Buyunda rivers flow into the southern side of the basin and cross the trace of the Ulakhan fault. Further downstream, on the northern edge of the basin, the Buyunda river flows into the Kolyma. Whilst the Kolyma is currently incising into the basin floor, the Buyunda has, at least until very recently, been in a depositional regime and has built a large alluvial fan on the basin margin.
There are a number of smaller alluvial fans crossing the southern margin of the basin and the Ulakhan fault, between the Buyunda and Kolyma rivers over a distance of about 50 km. In general, little was known about the intersection between the Seymchan basin fill, characterised by the preserved alluvial fans and associated alluvial basin deposits, and the Ulakhan fault. In the rest of this paper, we describe the evidence for recent large earthquakes affecting the Seymchan Basin segment of the Ulakhan fault, as well as speculating on longer-term slip rates derived from new age determinations.
In 2011 and 2012 we visited and surveyed segments of a pronounced scarp that crosses the Buyunda alluvial fan, where it enters the Seymchan Basin. We also took samples of alluvial material for age determinations. We subsequently obtained an archive of aerial photographs along the trace of the scarp, and the TANDEM-X 0.4 arcsec (∼12 m) resolution DEM (digital elevation model) for the region (Fig. 3a). We have georeferenced the aerial photographs using satellite data or the DEM as ground control points and compiled an aerial photo mosaic which can be manipulated using standard GIS software (Fig. 3b). We now present the results of our analysis of these data.
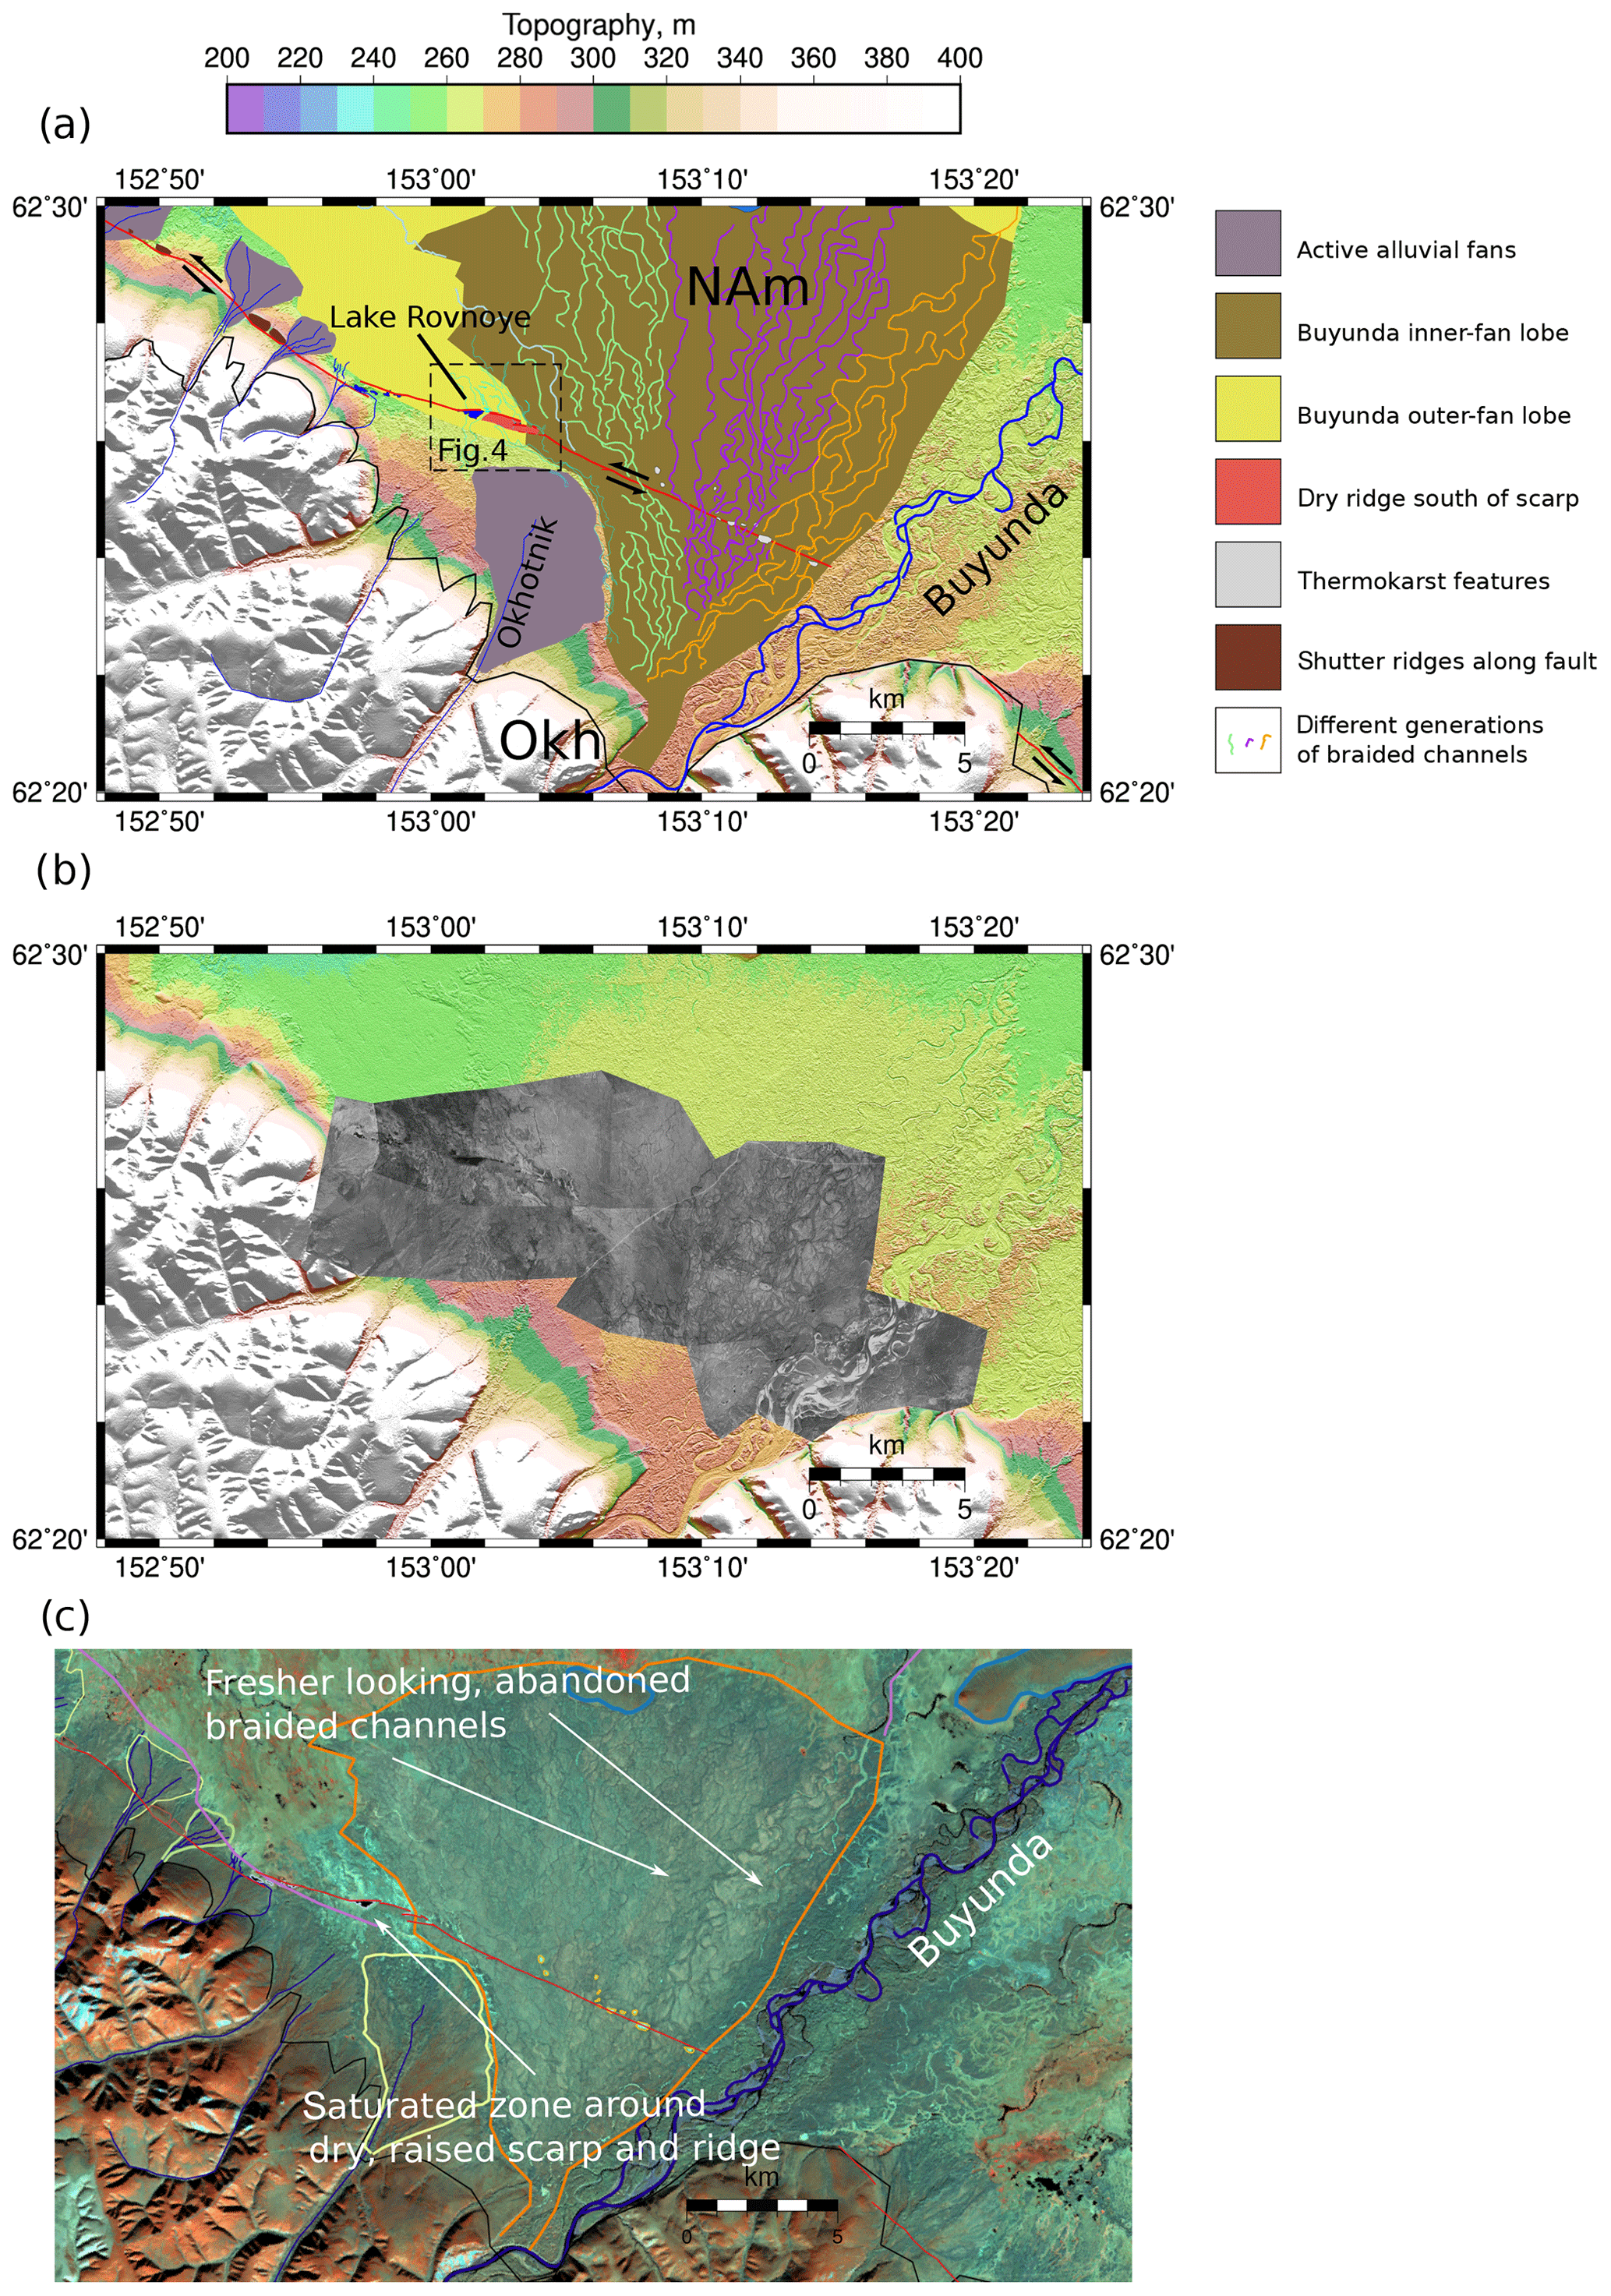
Figure 3Study area. (a) Detail of the Buyunda fan and the fault trace across it, showing lakes, scarp and ridge, thermokarst, shutter ridges, and subsidiary alluvial fans. (b) Detail of georeferenced aerial photo mosaic used for interpretation. Red dots show sample site locations. (c) Landsat false colour image (567 infrared bands) of same area. Saturated zone at the toe of Okhotnik fan shows up as lighter colours. Scarp and ridge is noticeably “drier” in this region. Older fan-top channels (previous course of Buyunda) appear “fresher” or more clearly defined and sharper the further east they are, suggesting fan surface may be progressively younger in this direction.
2.1 Tectonic geomorphology of the Ulakhan fault across the Buyunda fan
The Buyunda alluvial fan builds two distinct lobes where it enters the Seymchan Basin at its southeastern end (Figs. 2 and 3). The inner lobe surface is steeper and preserves a dense network of braided-fan distributary systems, some of which may have been active until recently. The outer lobe has gentler gradients and is fed today by input from several smaller fans along its southern edge (Fig. 2). The lobes together occupy ∼20 % of the modern-day basin floor: the inner lobe measures ∼190 000 km2, the outer lobe (including the inner lobe) ∼480 000 km2. The fan is asymmetric and has a long axis oriented towards the northwest (Fig. 2).
The Buyunda river, which enters the basin through a narrow north-trending gorge, flows along the eastern side of the alluvial fan and bypasses its earlier apex. The Buyunda river forms a braided channel, ∼1 km wide, which trends almost linearly northeast, parallel to the fan edge, before looping around an isolated remnant of the Jurassic basin floor and turning northwest, along the northern basin margin. A second braided channel system, which from its sharp definition in satellite imagery (Fig. 3c) seems very recently abandoned, runs almost exactly parallel to the present-day system, on its western side, at 2–5 km distance. This earlier course of the river flowed to the west of the Jurassic remnant. Several similar braided channel systems, representing earlier generations of the Buyunda river, occur across the fan surface but become progressively more difficult to distinguish from one another in a westerly direction (Fig. 2).
In 2012, we visited the western edge of the fan where it intercepts the fault, which is marked by a lake (Lake Rovnoye) (Figs. 3, 4, 5), approximately 1 km long and roughly triangular in shape. Immediately east of it, there is a pronounced 3–5 m high scarp, trending in a roughly ESE direction (105∘). Adjacent to the scarp to its north are a series of 10–50 m wide basins (Fig. 4). We were able to follow these basins and the scarp for ∼1.2 km to the ESE, before a noticeable break at the point where a second small lake is found, also visible on aerial imagery, where there are three right-stepping en échelon scarps for a distance of ∼900 m (Figs. 3 and 4). These have variable orientations, with the two, more southerly lying scarps trending close to E–W, whilst the isolated segment of the main scarp further north trends ∼125∘. There is also another small lake and basin at the tip of the most southerly of the three scarps in this region. At this point, the scarps merge again and continue as a single line. The scarps bound a wider (up to 500 m) uplifted portion of the fan to the south, also visible from DEM data.
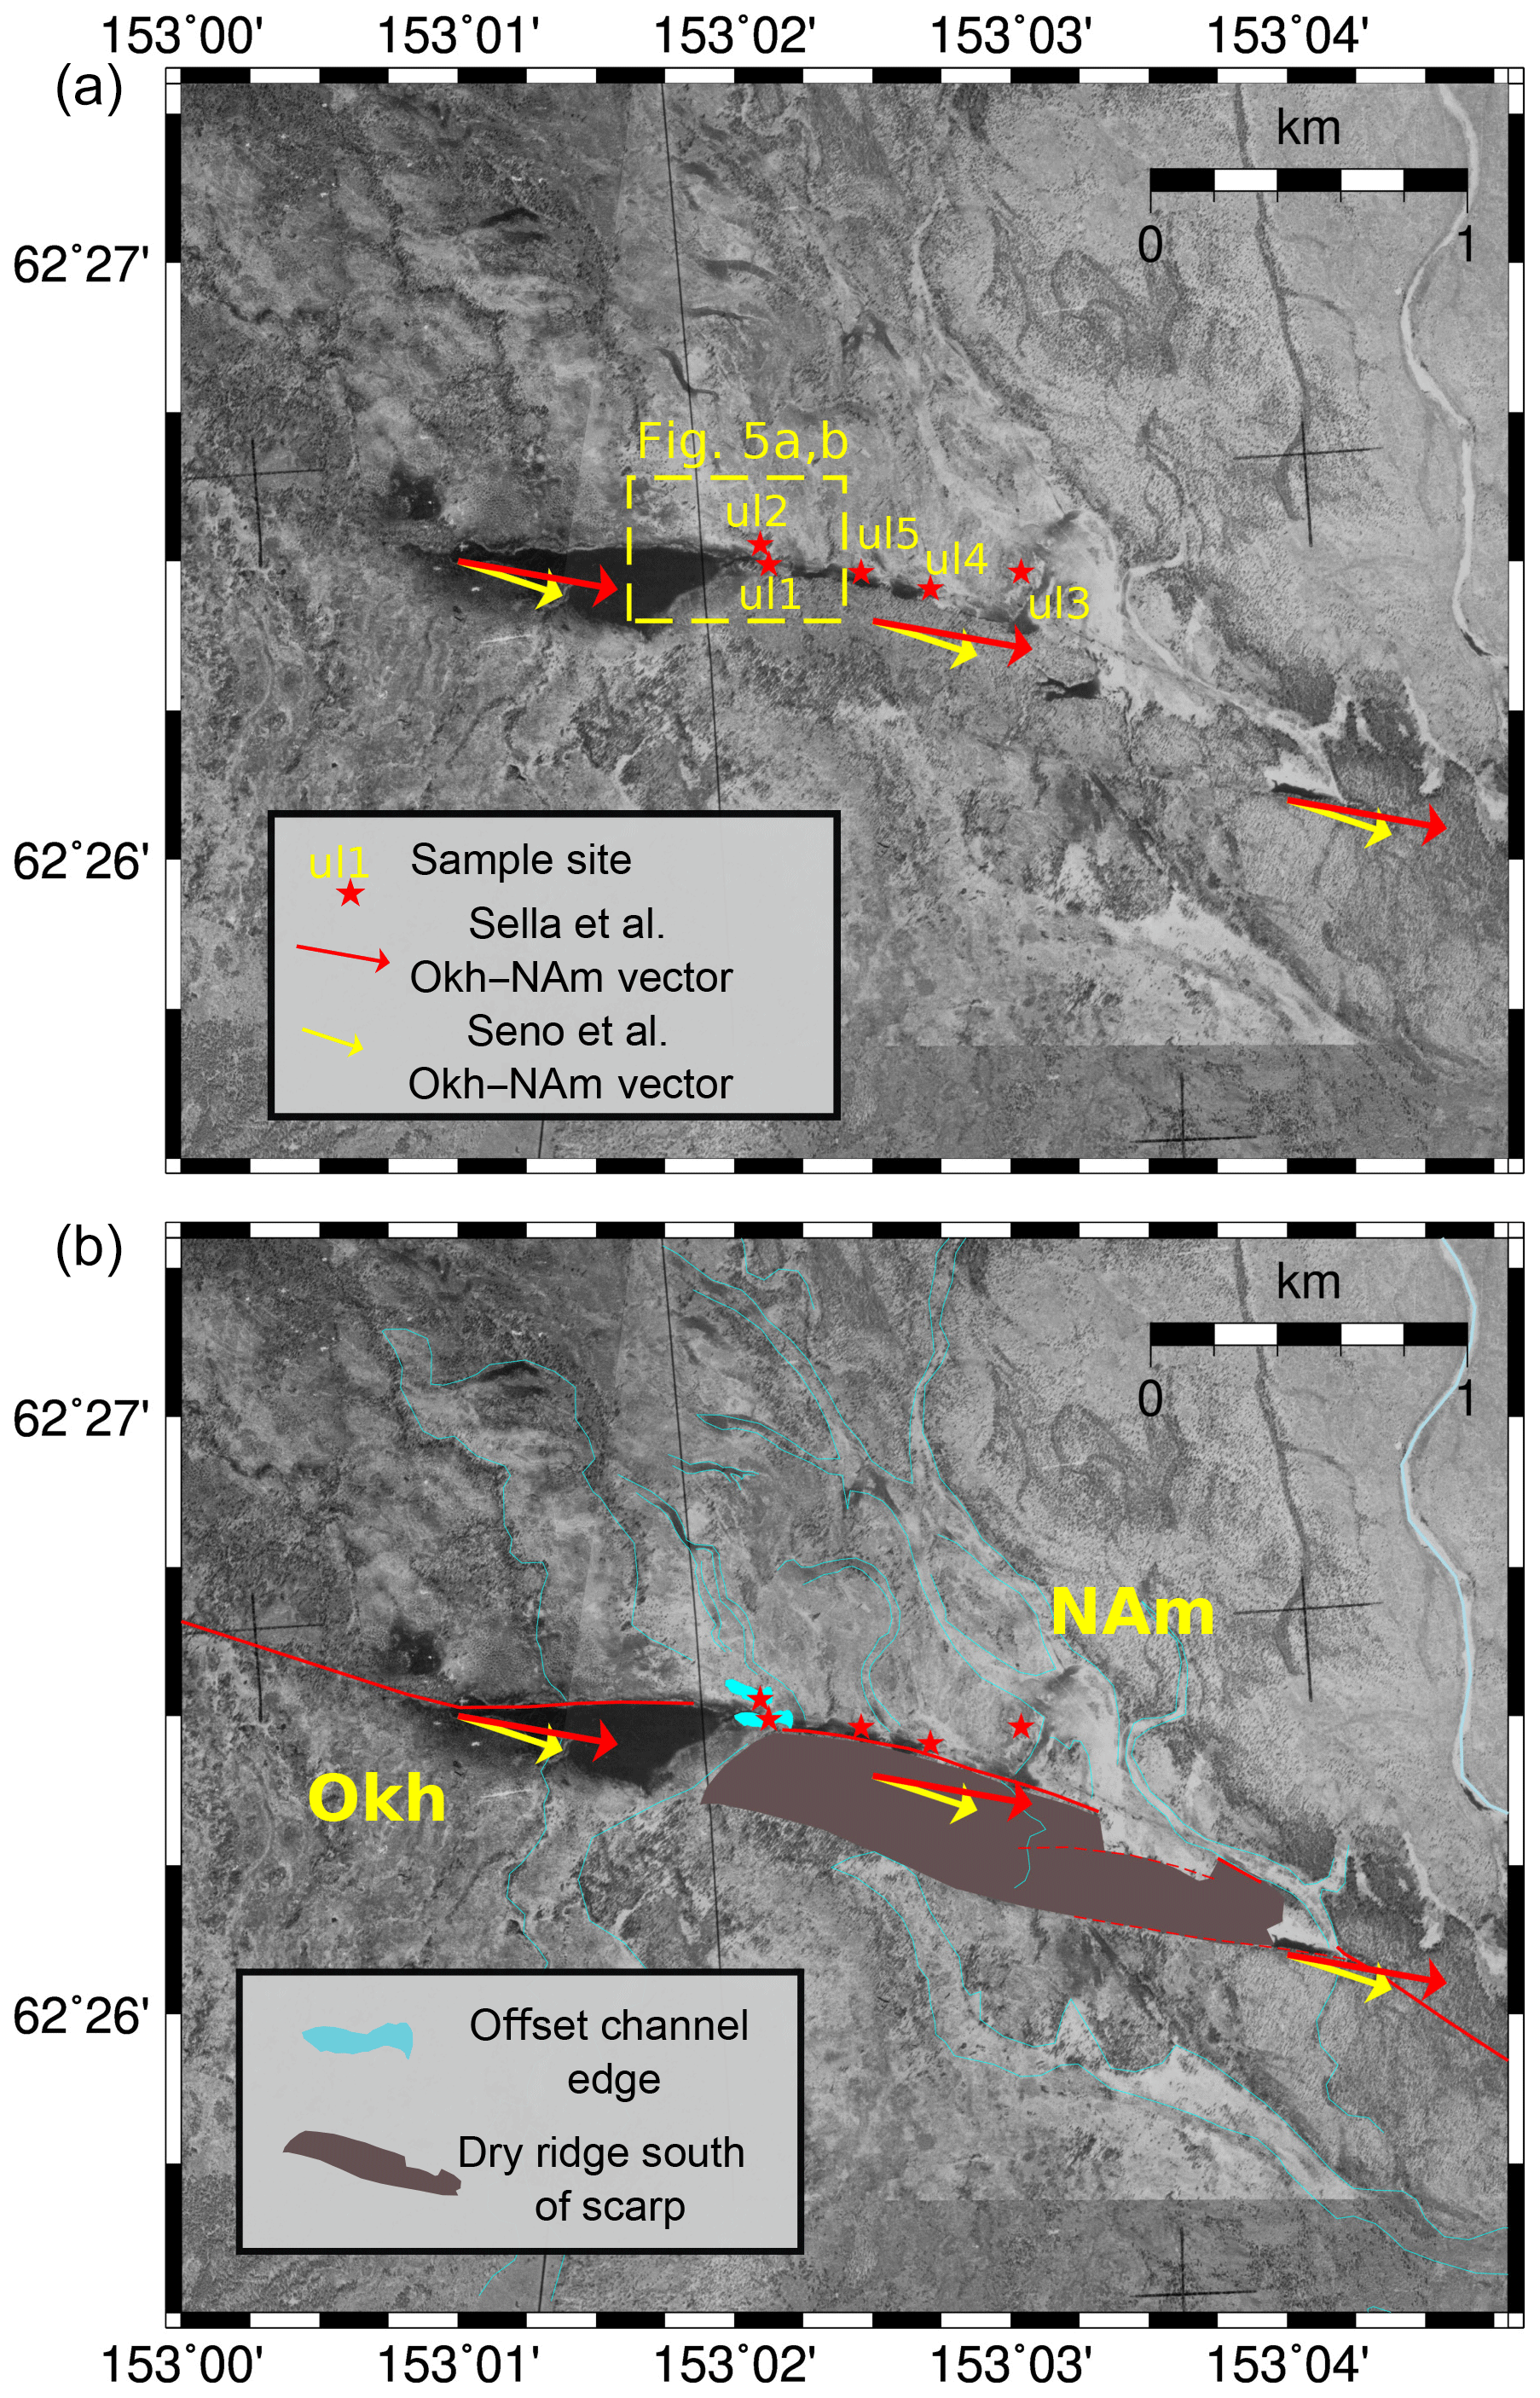
Figure 4(a) Un-interpreted aerial photo picture of ridge and scarp, showing sample localities (red stars) and names. Outline of Fig. 5 indicated. (b) Interpreted image showing ridge area south of scarp (dark shaded), fossil channel system (light blue outline) and offset channel bank feature (light blue solid shading). Also shown are linear velocity vectors based on Okh–NAm poles of Sella et al. (2002) and Seno et al. (1996).
The basins along the scarp showed signs of intermittent flooding and transport of some alluvial material, including occasional deposits of pebbles up to 5 cm diameter. Field reconnaissance, aerial photographs and satellite imagery suggest that present-day drainage runs west-northwest into Lake Rovnoye, and parallel to the scarp (Figs. 3, 5).
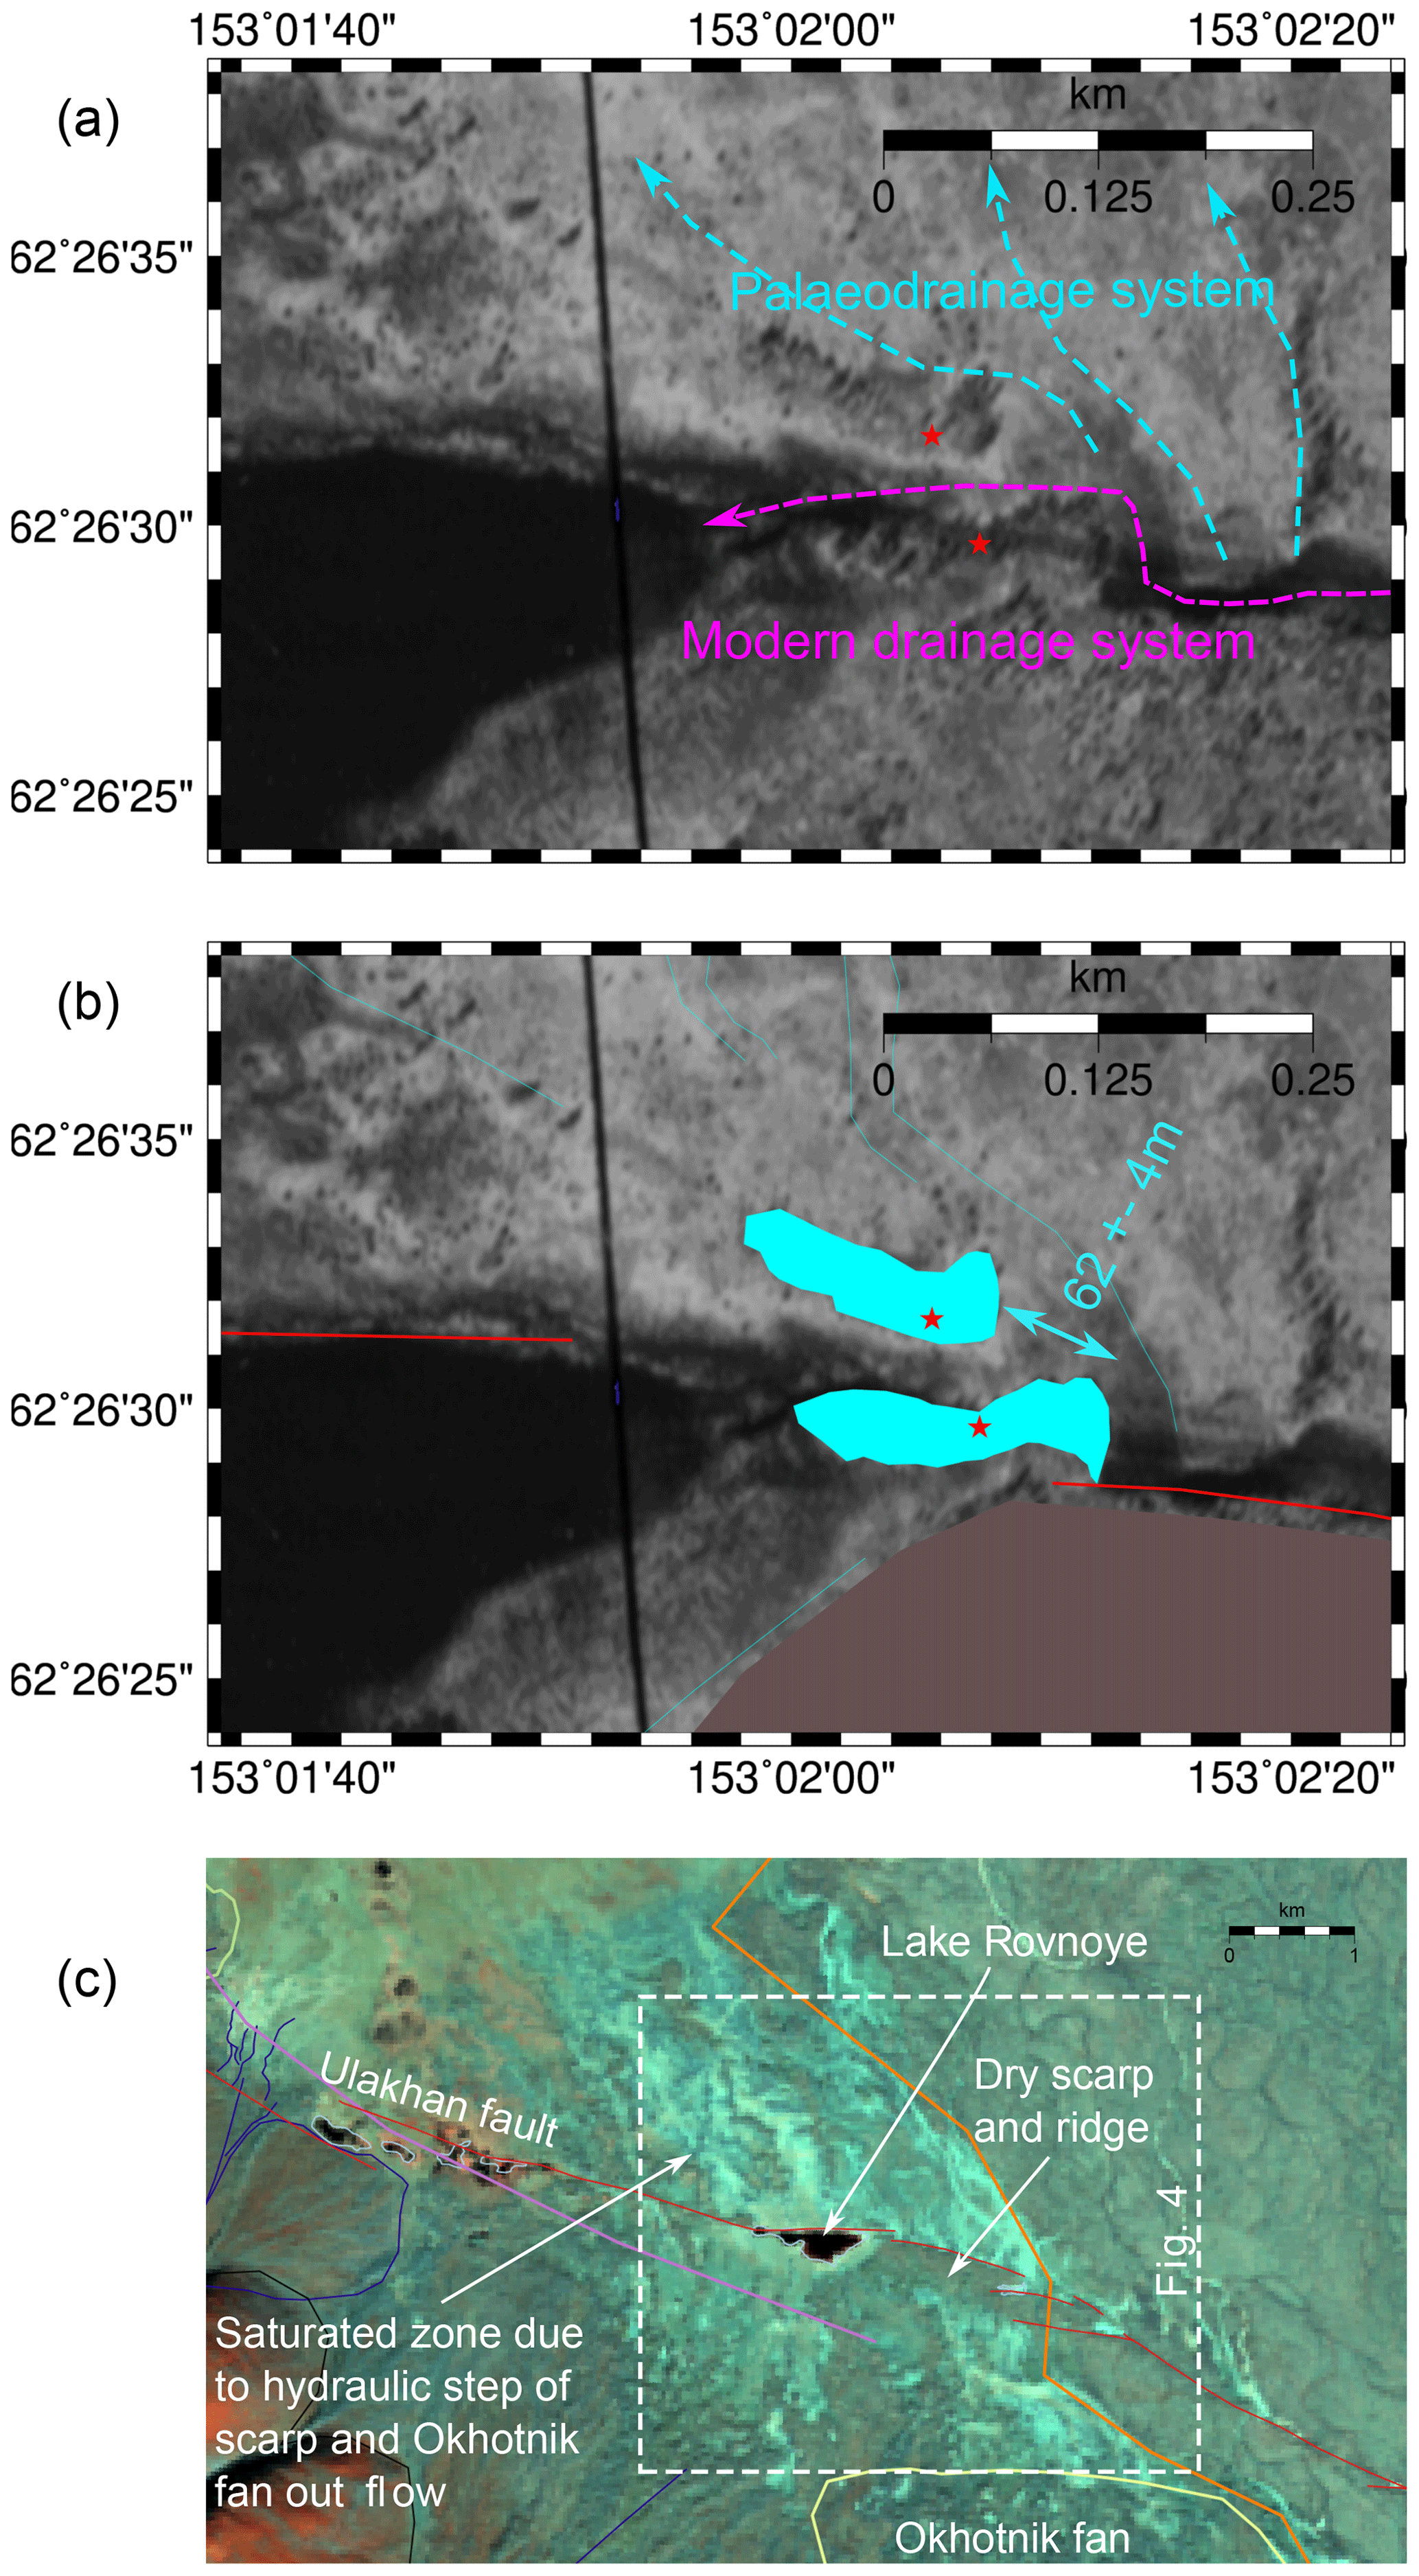
Figure 5(a) Magnification of aerial photo showing interpreted, northwest-oriented palaeodrainage and sample localities ul1 and ul2, interpreted to be offset as part of abandoned channel system. (b) Aerial photo with interpretation, showing offset palaeo-channel feature. (c) Landsat (567 band) detail, showing hydrology of scarp and ridge with a dry ridge (dark coloured area) bounded north and south by saturated zone (light coloured area). For explanation of hydrology, see text.
In 2011, we visited a region immediately ESE of the 2012 campaign, starting from the point where the main road on the Buyunda fan intersects the apparent trace of the fault. Here, we encountered a series of ∼100–200 m long, 10–20 m wide depressions, almost symmetric in profile, with a total relief of 5–8 m from the deepest point (Fig. 6). These basins follow a fairly continuous 110–120∘ trend to the point where they intersect with the 2012 field area.
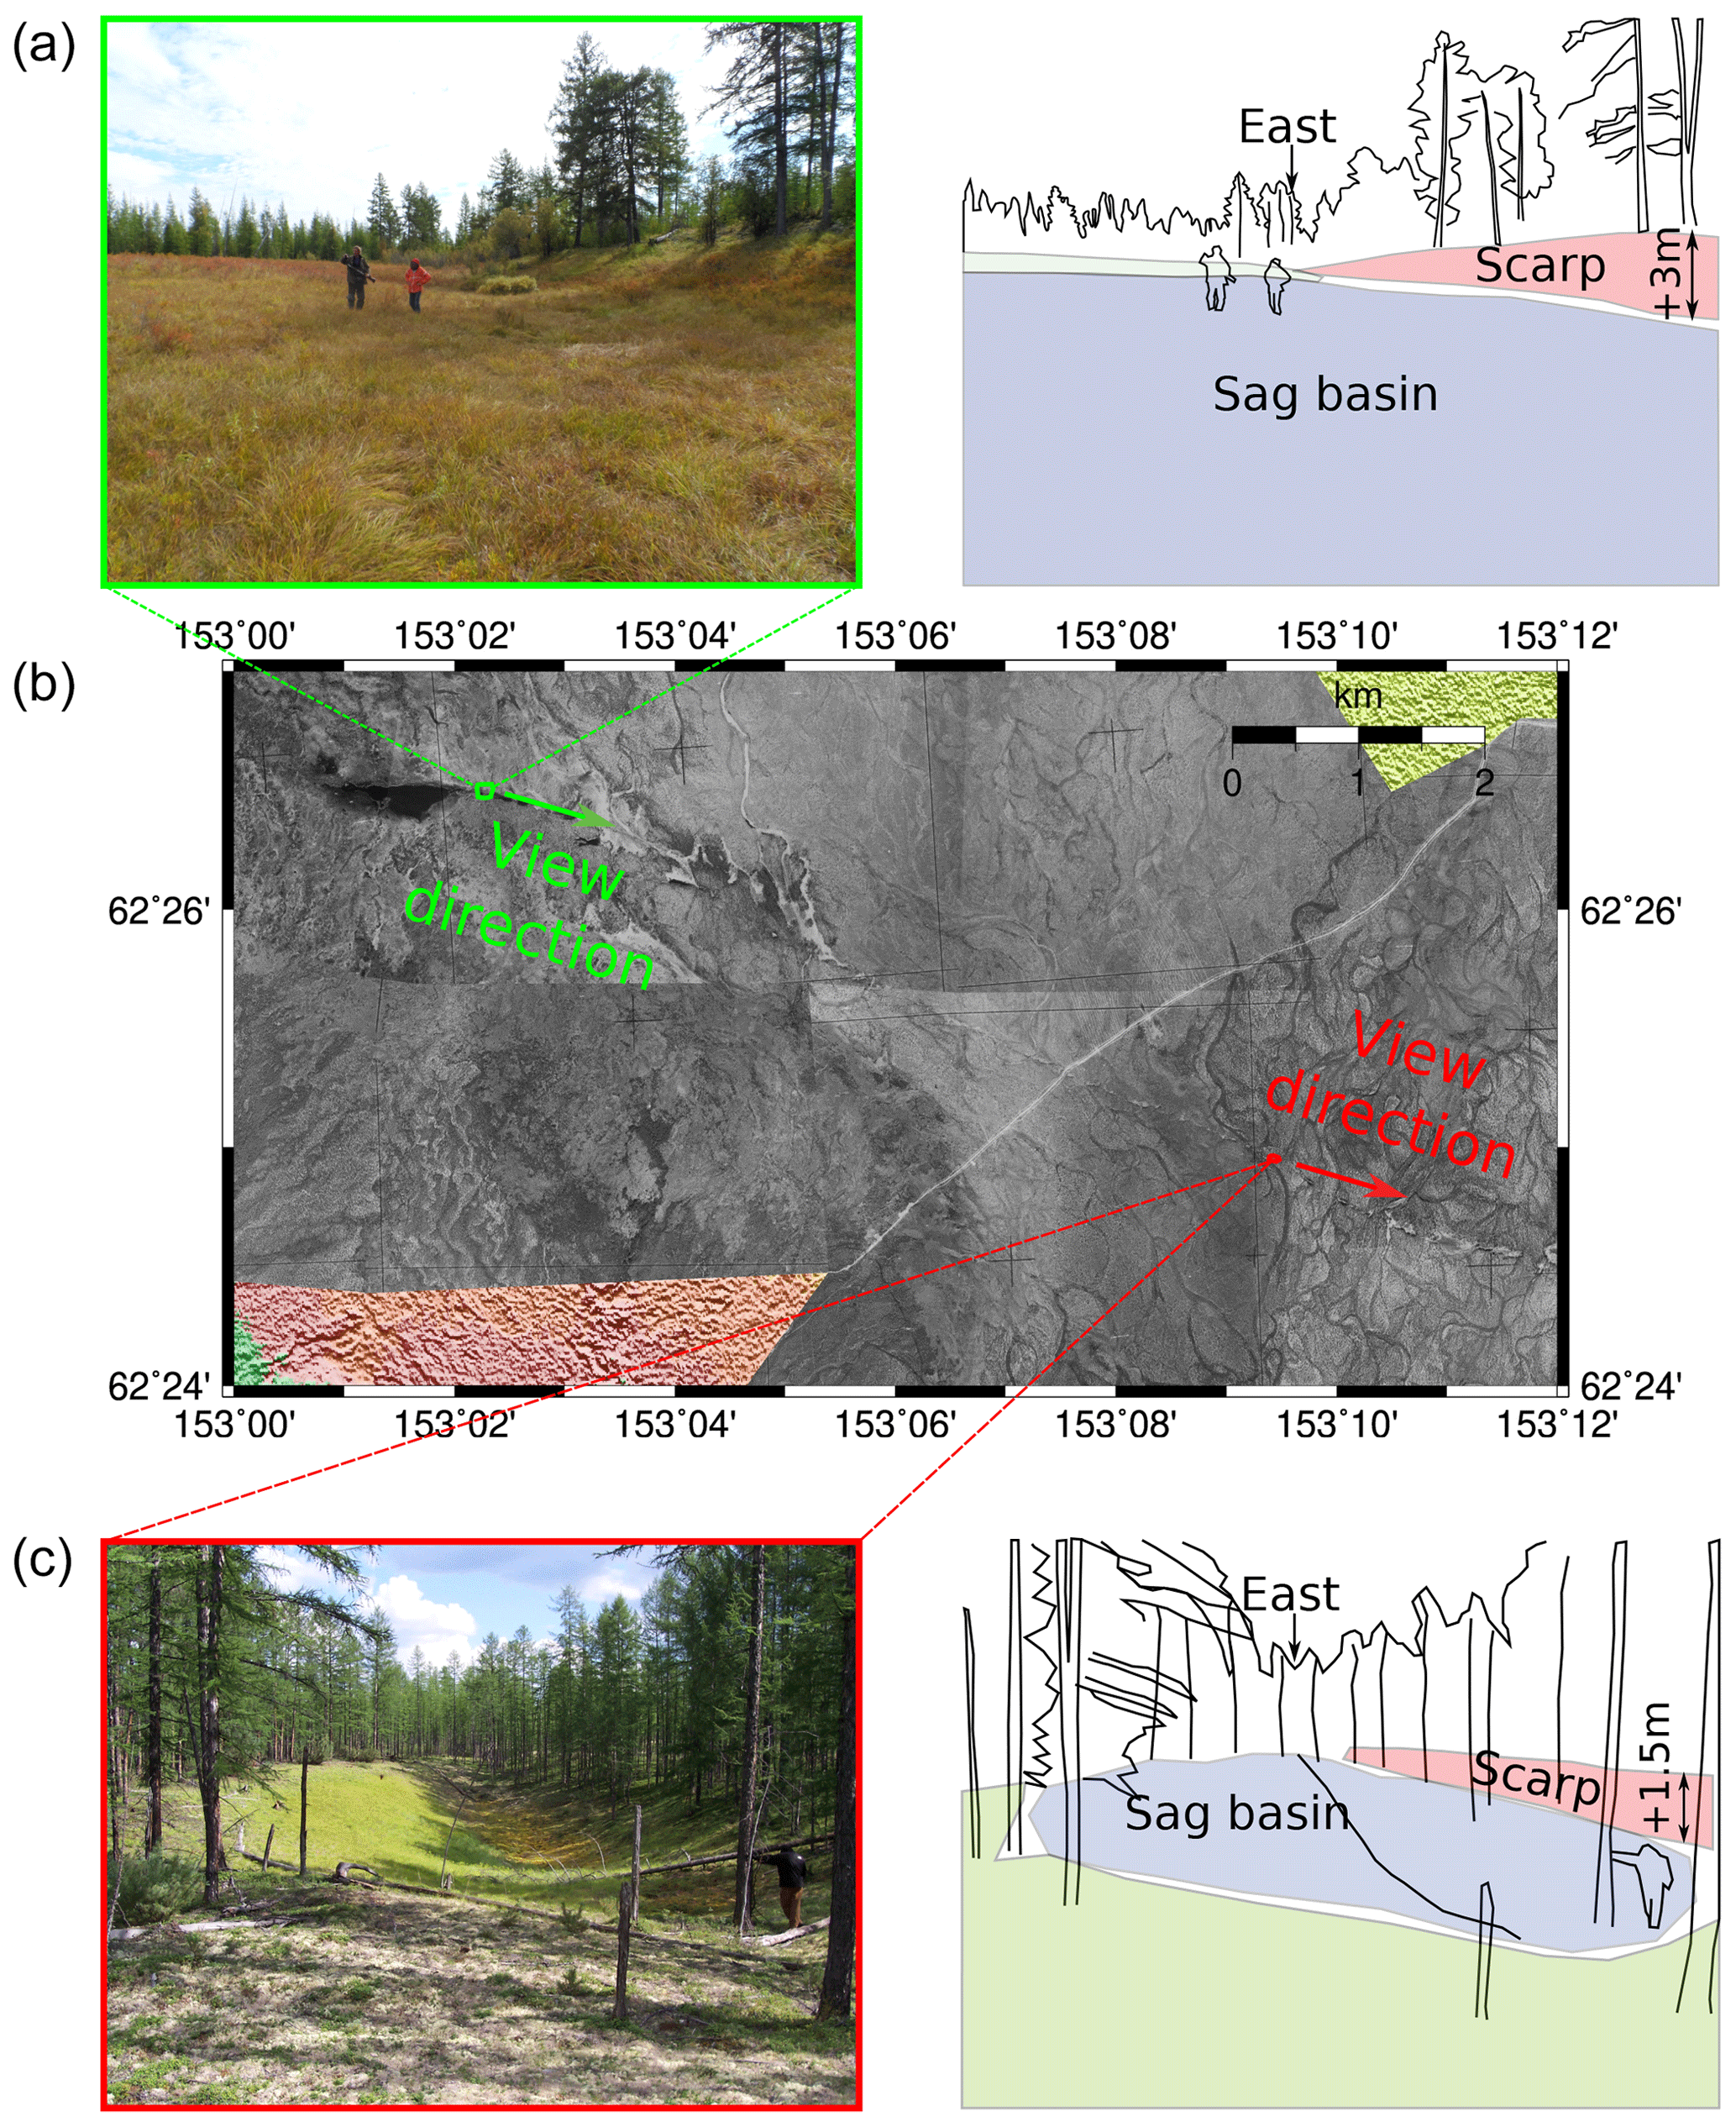
Figure 6Field photographs and interpretations of the main fault scarp near Lake Rovnoye (a) and a depression with a smaller scarp further east (c). An aerial photograph (b) shows approximate locations of the views and view orientations.
The aerial photographs and DEM show the wider fluvial and tectonic geomorphology of the Buyunda fan in the vicinity of the scarp (Figs. 3, 4). The pronounced scarp across the Buyunda fan, visited in 2012, can be traced over a distance of ∼3.5 km, starting immediately to the east of Lake Rovnoye. The scarp shows a consistent 1.5–5 m relief (southern side higher), as can be seen by both fault-normal topographic profiles and relief maps from the DEM (Fig. 7). It terminates into the series of narrow, elongated depressions encountered in 2011, which form a linear trend oriented 115∘, and extend for a further 2.5 km eastwards. There are approximately 10 of these depressions, with smaller vertical offsets than on the scarp, further west. Still further eastwards, the series of smaller depressions give way to three much larger (∼500 m ×100–200 m wide and 10 m deep) basins, aligned in the same 115∘ orientation and spread over a distance of ∼2.5 km. These may be dried-out thermokarst lakes (e.g. Bouchard et al., 2016). These also coincide with the apparently more recently active part of the fan surface, judging by the still fresh appearance of the preserved braided channel systems in satellite imagery. Similar depressions also occur in other places off-trend of the scarp.

Figure 7Topographic profiles, showing vertical offsets across the scarp on the Buyunda fan. Offsets are close to maximum near Lake Rovnoye (profiles 1 and 2) but diminish eastwards over a distance of ∼5 km. From Lake Rovnoye westwards there is also no vertical offset. Dashed lines are estimated average elevation of surface either side of fault for determining vertical offset.
The linear features we have identified are aligned close to parallel to various predicted Okh–NAm linear velocity vectors (Sella et al., 2002; Seno et al., 1996; Apel et al., 2006). There is an especially close match to the present-day GPS-based REVEL global Euler vector (Sella et al., 2002), with magnitude ∼6 mm yr−1. The best-fitting Euler vector based on spreading rates and earthquake focal mechanisms, and hence considered a longer-term estimate (up to 3.5 Myr) (Seno et al., 1996), is slightly more oblique to the trend and of lower magnitude (∼4 mm yr−1) (Fig. 4).
We can thus trace a linear feature across the inner fan surface made up from west to east of a distinct fault scarp, a series of narrow elongated depressions, and a series of possible dry, thermokarst lakes over a total distance of ∼10 km. The linear trend terminates in the modern-day Buyunda river channel. Given its linear nature, the sometimes pronounced scarp, and the fact that the trend of the feature fits closely with predicted Okh–NAm motion from global Euler vectors, we suggest that this is evidence of a recently active, mostly strike-slip fault with a left-lateral offset, likely to be the Okh–NAm plate boundary. We now present arguments for potentially large earthquakes and ruptures along it.
2.2 Buyunda fan surface and hydrology
Although today the Buyunda river is in a braided channel to the east of the Buyunda fan and is actively incising its earlier fan deposits, the fan surface is composed of several generations of earlier braided channel systems representing earlier courses of the Buyunda river. These have complicated, discordant relationships to one another, but in general they become less distinct and presumably older in a westerly direction (Fig. 3).
One of the most commonly used means to establish fault slip rates in strike-slip regimes are offset markers, such as alluvial channels, terraces or other stable land forms where they cross a fault (e.g. Grapes and Wellman, 1988; Hubert-Ferrari et al., 2002; Hetzel et al., 2002; Rodgers and Little, 2006). It is often hypothesised that some channels may be offset by a single earthquake and simultaneously abandoned by the stream that flows into them. Under these circumstances, a channel will become a passive marker for the current and all subsequent earthquake offsets. However, there are a number of potential problems with this idea. Firstly, the channel may have already been inactive for other reasons, prior to an offsetting earthquake, and associated ages of channel deposits would therefore not be synchronised with the start of offset motion. This is probably only relevant for cases where single earthquake offsets are being measured. In cases where multiple offsets have occurred, the significance of a time delay between abandonment and the beginning of offsets will become less as more earthquakes occur. Secondly, channels may re-establish flow between offset segments in a phenomenon known as dog-legging (Rodgers and Little, 2006), and hence depositional ages within channels will be younger than the timing of offsetting motion. Dog-legging may also occur where a new channel exploits an existing fault scarp along part of its length, causing a deflection in its course which is unrelated to seismic events. The best tectonic offset markers are generally linear features such as edges of incised terraces (Hetzel et al., 2002) or straight segments of a channel. However, in many cases, associating age determinations of sedimentary features with their offsets is problematic. The Buyunda fan inner lobe surface is crossed by many channels which are intersected by the fault scarp. In general, these form abandoned, braided systems of similar character to the present-day Buyunda river (Fig. 3). Braiding leads to continuously curved features, which makes identifying tectonic offsets more difficult. The eastern end of the fan in the area of the larger thermokarst features nevertheless contains a number of channels with straight segments that cross the fault, often almost perpendicular to it, and none of which appear to be offset. We suggest that this region is the youngest portion of the fan surface and was active after the last major earthquake on this fault segment, which obliterates traces of the active scarp. This system is bounded on its western edge by a channel which turns fault-parallel for a distance of ∼350 m, which could be interpreted as a fault offset but actually appears to mark the edge of this particular generation of deposits (Fig. 3).
Further westwards towards the region of the pronounced fault scarp, the braided channels are less distinct in aerial and satellite imagery (Fig. 4). The fault scarp builds a ridge which cuts through drainage. To the south and north of the ridge, aerial and multispectral LANDSAT imagery shows saturated zones and fossil drainage, suggested by the light colours of the satellite image (Fig. 5). This was also confirmed in the field, where we found substantial areas of persistent surface water. Between them, the scarp builds a “dry” zone (Fig. 4), with dryness implied by the dark colours of the satellite image and also confirmed in the field. The hydrology of this region is dominated by outflow from the adjacent Okhotnik river and fan system, and the fault scarp which forms a step in the regional water table. The area directly north of the scarp is a topographic low on the edge of the inner lobe of the Buyunda fan. Water presumably percolates into the scarp area, fed from the Okhotnik river. The step due to the scarp offsets the hydraulic gradient within the fan deposits, leaving the scarp dry and the areas to its north and south saturated. The saturated zones highlight a fossil channel system which formed a pre-scarp drainage system. The channels with higher permeability sediments are distinctly light coloured in satellite imagery (Fig. 5). The fossil channel system drained to the northwest.
At the westernmost end of the scarp and ridge, directly adjacent to lake Rovnoye, there are two small areas of raised topography, visible on the aerial photographs and the DEM (Fig. 5). The southernmost of these forms the main fault scarp at this point as can be seen from fault-normal topographic profiles (Fig. 7). The fault thus passes between the two topographic highs, before terminating and resuming a few metres south along the main scarp. The topographic features both have straight, eastern edges, trending to the north. They also appear as two darker spots on LANDSAT imagery (Fig. 5c), again suggesting an apparent offset. These features are interpreted as channel banks of an earlier north-draining system, the fossil remnants of which can be seen ∼500 m further north (Fig. 4b). The channel banks are cut by the trace of the fault and offset by 62±4 m in a fault-parallel direction, which we interpret to be a measure of fault offset in this location. We suggest abandonment of the channel may have occurred due to the fault scarp and ridge that were formed during earthquakes, blocking and shutting down the existing drainage. Subsequently, new drainage developed parallel to the scarp and began to flow into lake Rovnoye at the scarp's western end (Fig. 5a).
2.3 Buyunda fan age determinations and offset rate estimates
We collected sediment samples from four sites along the scarp for age determinations using both optically and infrared stimulated luminescence of quartz and feldspars (OSL and IRSL) using the SAR (single aliquot regenerative dose) protocol according to Murray and Wintle (2000), as well as organic material for 14C from one further site (see Appendices A and B for details of the method, sampling and laboratory procedures). Samples came from the region directly adjacent to and north of the scarp from five pits (Fig. 4), although from one pit (sample 5) we only recovered organic material. Samples 1 and 2 are on both sides of the offset channel feature we have identified, at the westernmost edge of the scarp. Samples 3, 4 and 5 are from the broad zone of channel deposits that we can identify from aerial photographs. Samples 1–4 were analysed with both OSL and IRSL. Sample 5 was 14C only. Sample pits encountered fine–coarse grained, sandy material, with occasional evidence of graded and cross bedding. Small pebbles sometimes formed the base of cross beds. We believe we sampled a mixture of channel or possibly overbank deposits of a fossilised fan-top channel system, probably part of an old course of the palaeo-Buyunda river when it flowed generally to the northwest, in a direct line to its confluence with the Kolyma river. Sample collection and processing procedures are described in the Appendix. As part of the sampling procedure, we also recovered two samples from different faces of several pits, which are referred to as (a) and (b) samples in this paper.
Samples were generally classified as being either well bleached where quartz (OSL) and feldspar (IRSL) ages are consistent, or partially bleached where quartz and feldspar ages differ significantly. In general, feldspar ages are only considered indicative of true ages of channel deposits when they closely match quartz ages (see Appendix for explanation of methodology and data tables). If feldspar ages do not match quartz ages for an individual sample, only the quartz ages are taken to be representative of the true age of the deposit. From the reliable data there is a range of ages (8.85–14.3 kyr) from samples 1–4, with a mean age of 11.6±2.7 kyr (Table A1, Fig. 8). The ages suggest an early Holocene abandonment of this part of the fan and by extension may date the first uplift of the scarp and ridge structure that we suggest reorganised the drainage in this region. These are probably the first genuinely physical age determinations of Quaternary sediments carried out in this region (Patyk-Kara and Postolenko, 2004), and certainly the first employing OSL. Combining the mean age with the associated 62±4 m offset gives a slip rate of 5.3±1.3 mm yr−1, which agrees with the modern-day plate-tectonic estimate of Okh–NAm motion at this point (Sella et al., 2002).
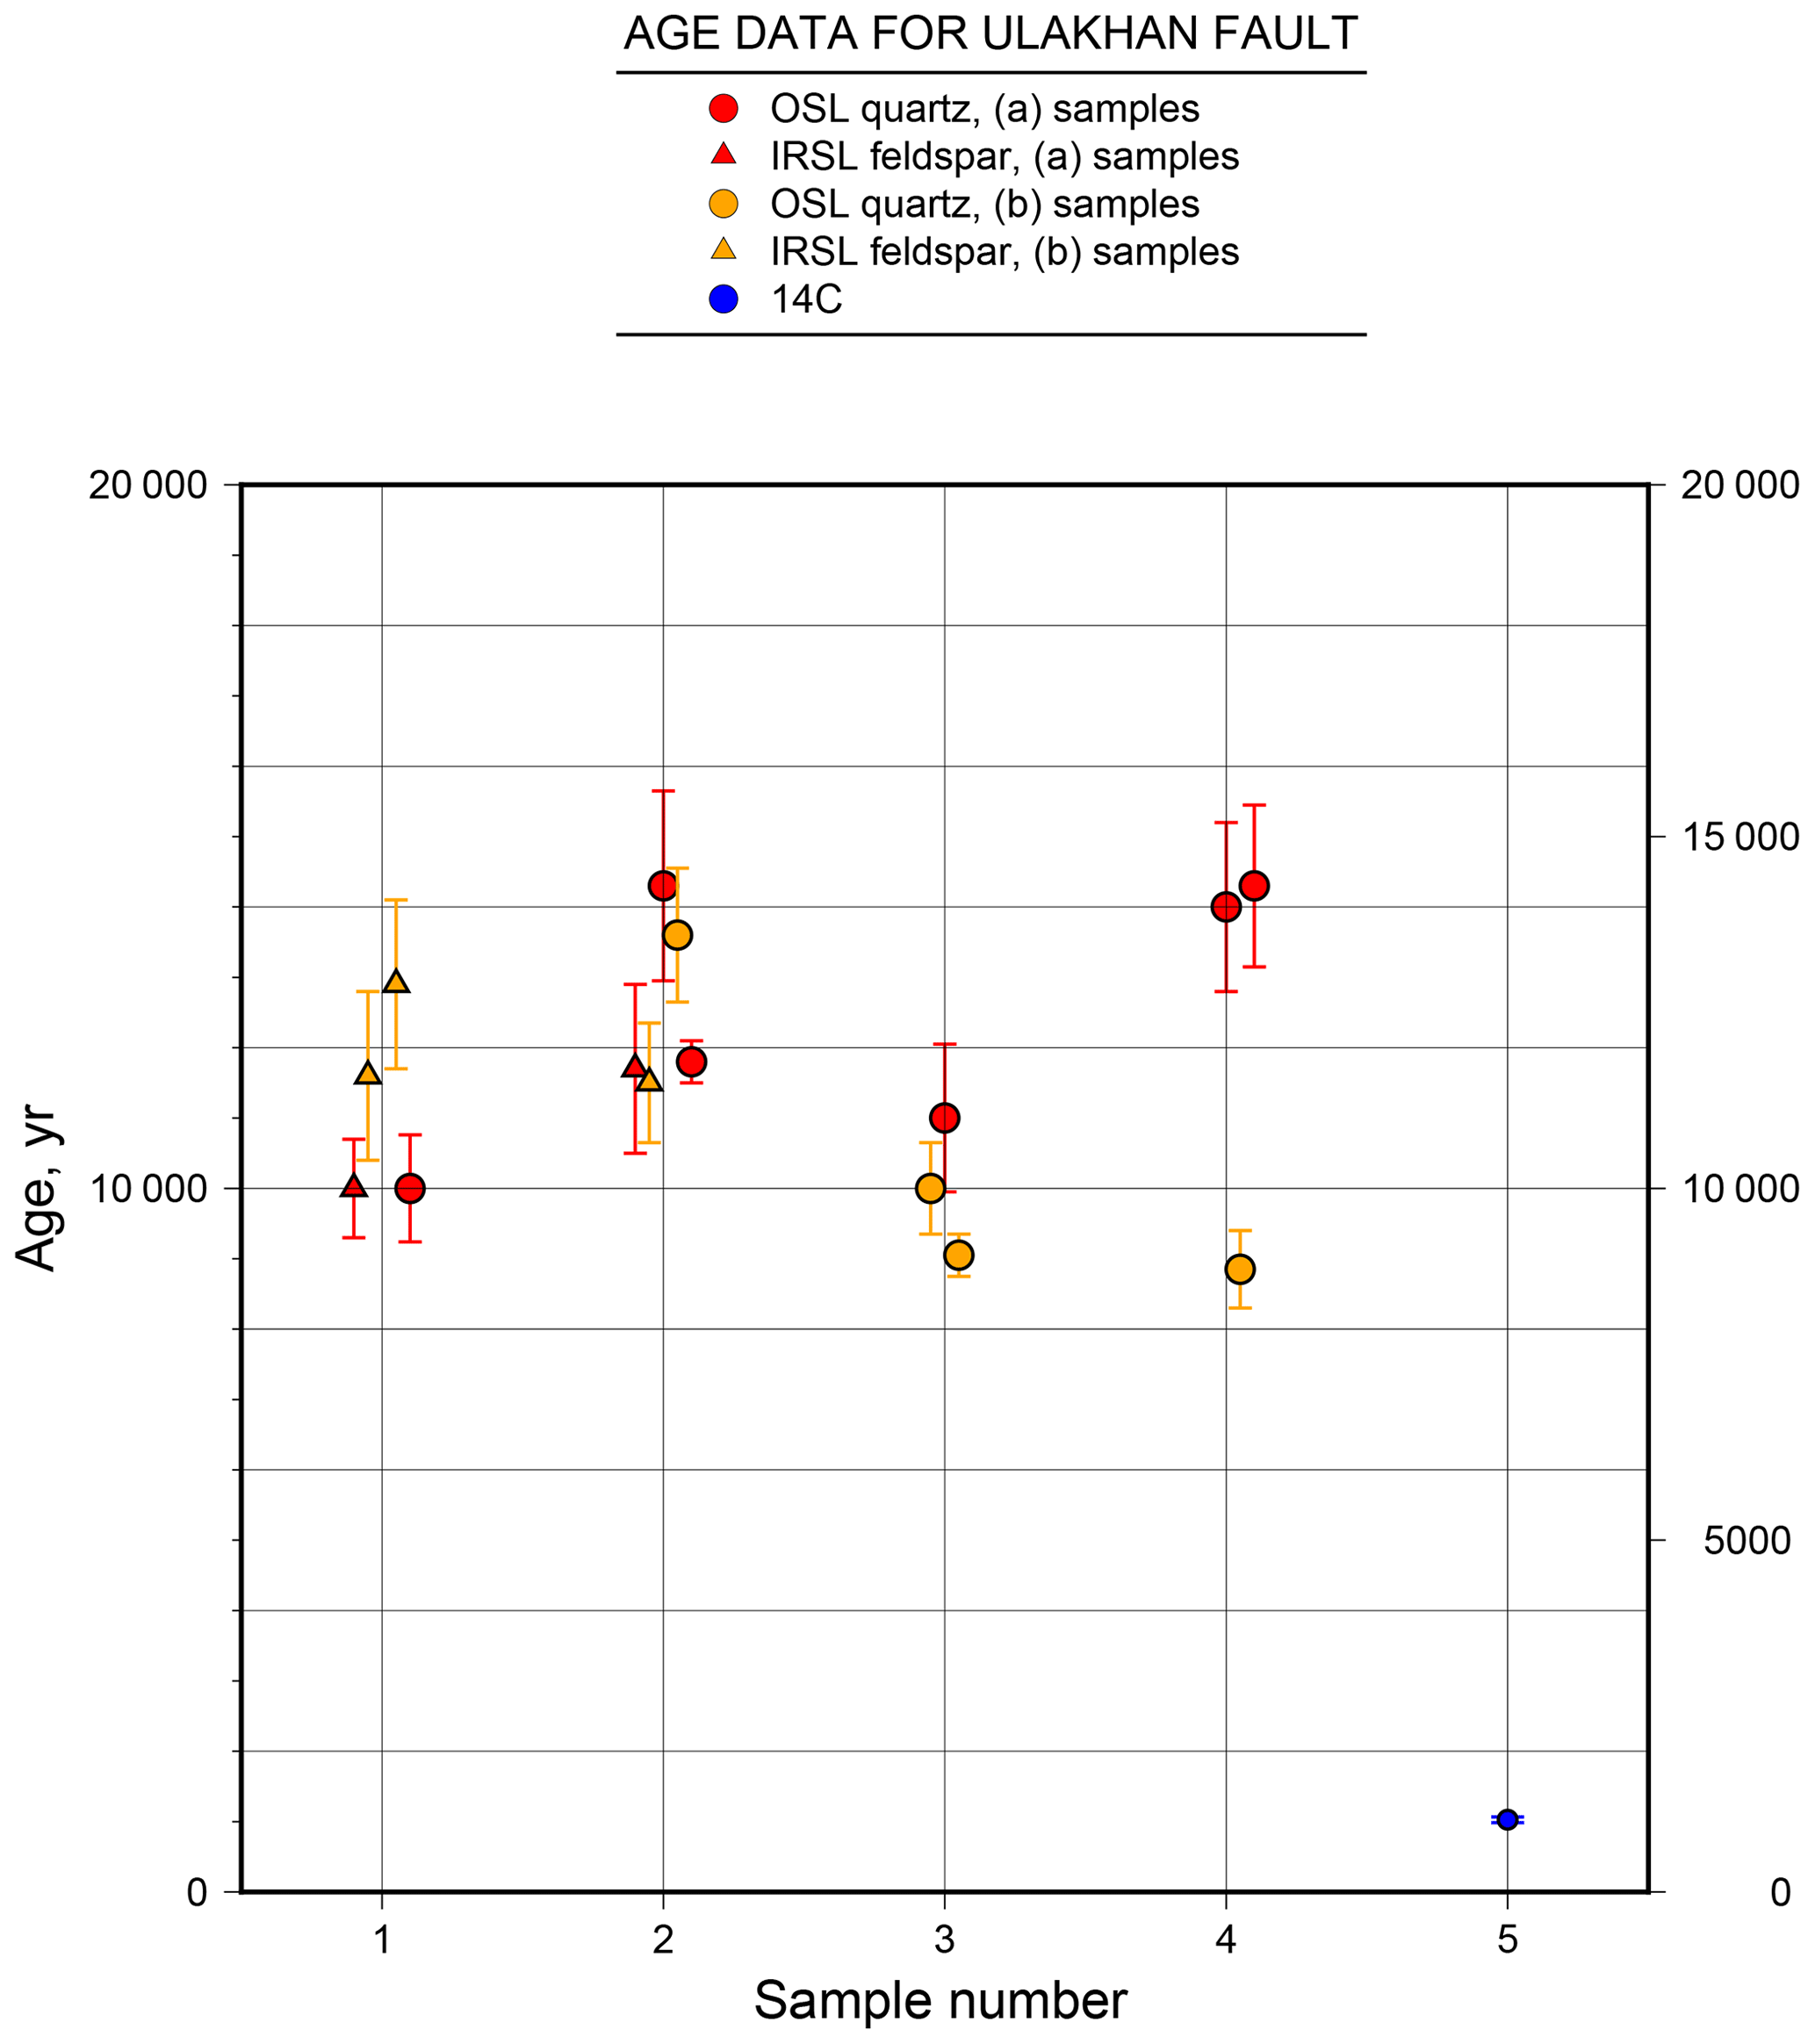
Figure 8Usable luminescence and 14C age data from the five sample sites along the Ulakhan fault scarp (for locations see Fig. 4). Raw data, including from partially bleached IRSL samples not considered in age determinations, can be found in the Tables A1, A2 and B1. Data are separated into (a) and (b) samples, which refer to separate samples from different sides of the same pit.
The poorly bleached feldspar samples have a wide range of ages (12.3–45.6 kyr) (Table A2). Poor bleaching reflects the fact that feldspar luminescence has not been reset during the latest transport and depositional episode (see Appendix). It is quite likely that the Buyunda fan sediments have been reworked from other deposits in the Buyunda river system, and it may be that the ages reflect earlier episodes of transport and deposition in other parts of the drainage basin from which the sediments have been reworked, but there is no method available for quantifying this possibility.
14C dating of sample 5 gives a far younger age than the neighbouring OSL sites. This is not particularly surprising, given the possible ways of introducing organic material into the subsurface long after deposition has occurred. We suggest that the consistency of the OSL results, probably reflecting time since channel abandonment, make it likely that the 14C age is post-depositional.
2.4 Basin-wide fault and scarp features
The scarp we encountered in 2011 and 2012 is linked to a fault that can be followed across most of the Seymchan–Buyunda basin. Using remote sensing data, we can trace the fault westwards from the alluvial fan (Fig. 3). Aerial photo coverage also overlaps with parts of this region. The fault extends ∼90 km in total to the northwestern edge of the basin where it may also offset Neogene continental clastic deposits. Immediately west of Lake Rovnoye, aerial photographs show several small lakes which may sit between an overlapping en échelon portion of the fault (Fig. 3). A linear trace then runs to the eastern edge of the incised Kolyma river, marked in places by shutter ridges (Fig. 3). Several smaller rivers cross this part of the fault and have built fans across it. Some of the fan edges suggest left-lateral offsets, but this is not consistently obvious. Linking of offset distributary channels (i.e. identifying consistent, left-lateral offsets) from one side of the fault to the other is also difficult, although this is often the case in strike-slip fault systems (e.g. Hubert-Ferrari et al., 2002; Rodgers and Little, 2006).
Where the Kolyma river enters the Seymchan Basin, it emerges from a deeply incised gorge in Jurassic and Triassic bedrock to the south and has incised a delta-shaped region into the basin infill (Fig. 2). The fault is thus not discernable in this region. West of the Kolyma, however, the fault segment re-emerges, approximately in line with the end of the trace to the east of the river and forming the northern boundary of Neogene outcrops on the south side of the basin. The segment finally terminates in what is apparently a second scarp but with the opposite uplift polarity to that on the Buyunda fan (Fig. 9). This second scarp appears to be somewhat enhanced by erosion along the fault trace, but the offset of the basin floor is clear from the fault-normal topographic profiles (Fig. 9). The northern side of the fault is uplifted by up to 3–5 m, just as the southern side is uplifted by a similar amount at the eastern termination of the fault segment on the Buyunda fan. As we discuss in the next section, these two linked scarps and peak uplifts can be related to elastic dislocation models of earthquakes on strike-slip fault segments.

Figure 9Topographic profiles, showing vertical offsets across presumed scarp at the western end of the Seymchan Basin, assumed to mark the termination of the 90 km Ulakhan fault segment. Offsets reach a similar maximum value to the scarp on the Buyunda fan and diminish rapidly to the west, but more gradually, over a distance of ∼5 km, to the east. Sense of offset is reversed relative to the Buyunda scarp (Fig. 7).
Elastic displacement theory has long been applied to analysis of co-seismic slip in earthquakes. Although there are many degrees of sophistication in these models today (e.g. Okada, 1992), the simplest case of a vertical strike-slip fault which reaches the surface and was the basis of Chinnery's (1961) first application of the method to earthquake slip problems is adequate for our purposes. The method calculates the displacement components around a Volterra dislocation in an elastic half-space, by solving the equations of elasticity for boundary conditions of stress-free bounding surfaces, using a Green's function method (Steketee, 1958a, b). As such, a Volterra discontinuity is a surface with constant offset or displacement across it. This is a reasonable first approximation to a fault that has undergone an earthquake displacement. The parameters in the model are fault half-length, L; fault depth from the surface, D (in the case where the fault intercepts the surface); and fault slip, U. The results are given as the three displacement components, parallel to x, y and z axes, in the volume surrounding the fault, with x and z chosen to contain the fault plane in the case of a vertical strike-slip fault. For our analysis, we only use the vertical displacements since these pertain most directly to scarp formation.
Theoretical predictions of slip on a left-lateral strike-slip fault have two interesting properties. The first is that the vertical motions on both sides of the fault reach their maximums at the tips of the propagating zone of fault slip. Hence, the largest vertical offset corresponding to a scarp would be expected at the two ends of a single rupture (Fig. 10). The Seymchan Basin fault shows two such pronounced scarps linked by a continuous fault.
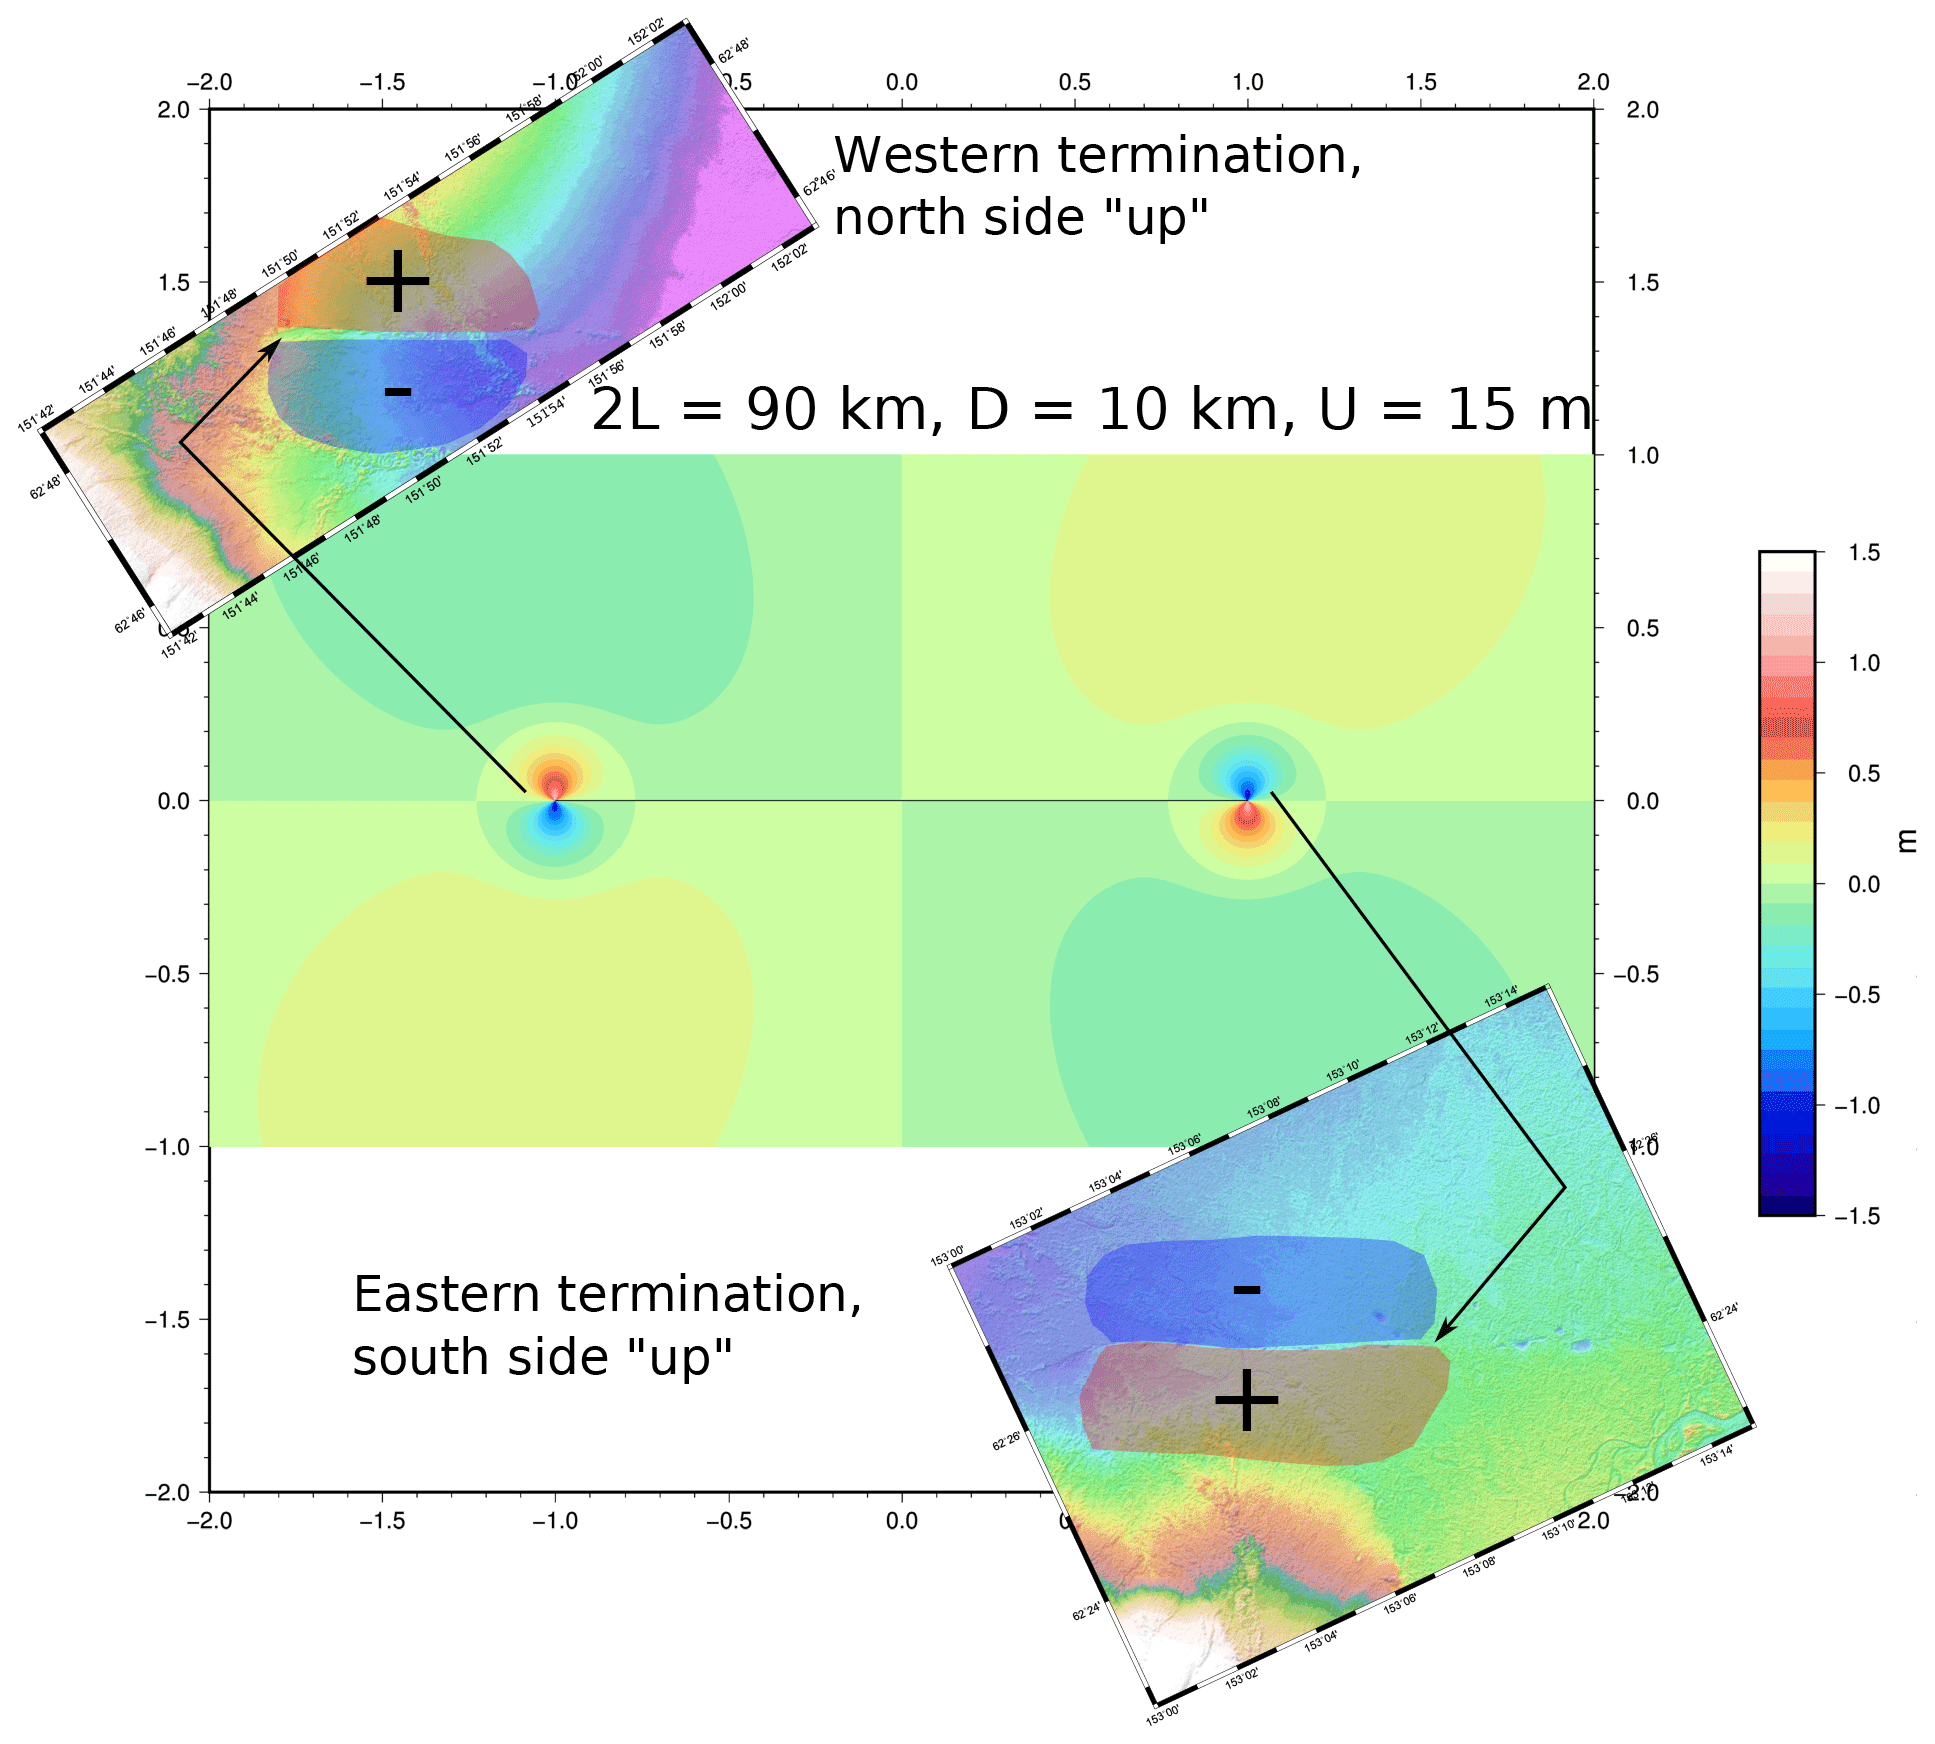
Figure 10Elastic dislocation model for a 90 km fault segment (half-length, L=45 km), 10 km deep, reaching the surface, with 15 m average slip. Contours show vertical displacements (co-seismic) for such a slip event. Fault is vertical. Also shown is the topography around the two scarps at the terminations of the 90 km fault segment.
The second property of interest is the polarity of uplift at the two tips. The predictions of an elastic dislocation model fit the polarity found in the Seymchan Basin, with the “south” side up in the east and the “north” side up in the west. The simplest way to achieve this geomorphology on a fault is a rupture, or series of ruptures, along the entire length of the fault we have traced across the basin. In other words this 90 km fault segment fails, probably repeatedly, as a single entity.
Uplift amounts and scarp offsets can also be correlated with total slip, fault depth and fault length for single events from the model. Assuming there has been little modification of the average surface offset across the scarp by surface processes, we need to model ∼3–5 m of uplift. For example, a single 15 m slip event on a 90 km fault segment, 10 km deep, would produce ∼1.15 m maximum uplift giving a maximum total vertical offset 2.3 m (Fig. 10). We therefore think it is likely that the fault scarp has been produced by several (probably 3–5) separate earthquakes over time, which would fit well with our finding of a ∼11.5 kyr age for a 62±4 m offset across the fault, and the earlier results of Hindle and Mackey (2011) suggesting recurrence times of large earthquakes on segments of the Ulakhan fault to be ∼1–3 kyr.
4.1 Seismological and kinematic data
There have been no large earthquakes (>Mw 7.0) on the plate bounding faults of the northwestern portion of Okh within the instrumental seismic record. The most northerly large earthquake on the boundary of Okh (excluding those along the segment of the Pacific subduction zone) was the Neftegorsk event at the northern end of Sakhalin Island, on the Eur–Okh boundary. Otherwise, excepting the Mw 6.7 Illin-Tas earthquake in 2013, which occurred on the Eur–NAm boundary, north of the triple junction with Okh (Imaeva et al., 2015), the largest event in the region was the intraplate Mw 6.4 Artyk event in 1971, which lay within the Okhotsk plate. This lack of data led Hindle et al. (2009) and Hindle and Mackey (2011) to suggest that there were a number of ways to accommodate Eur–NAm convergence by internal and plate boundary strain within northwestern Okh (Fig. 11). These were an effectively rigid, plate-like “extrusion” of the northwestern corner of Okh from between converging Eur and NAm, with the majority of tectonic displacement occurring on the plate bounding faults; a northwestern corner of Okh consisting of a series of blocks, mostly elongated north–south, moving independently of one another by relatively even amounts over many earthquake cycles, and thus no single clear plate-bounding fault. Although some internal deformation is occurring within Okh as shown by the 1971 intraplate earthquake, it is 1 order of magnitude smaller than that expected for full release of plate-tectonic strain according to Hindle and Mackey (2011). GPS data from northwestern Okh are sparse and have been interpreted in a variety of ways (Steblov et al., 2003; Apel et al., 2006). Our field observations on the Ulakhan fault give a first insight into the palaeo-seismology of the region and add important data in this context.
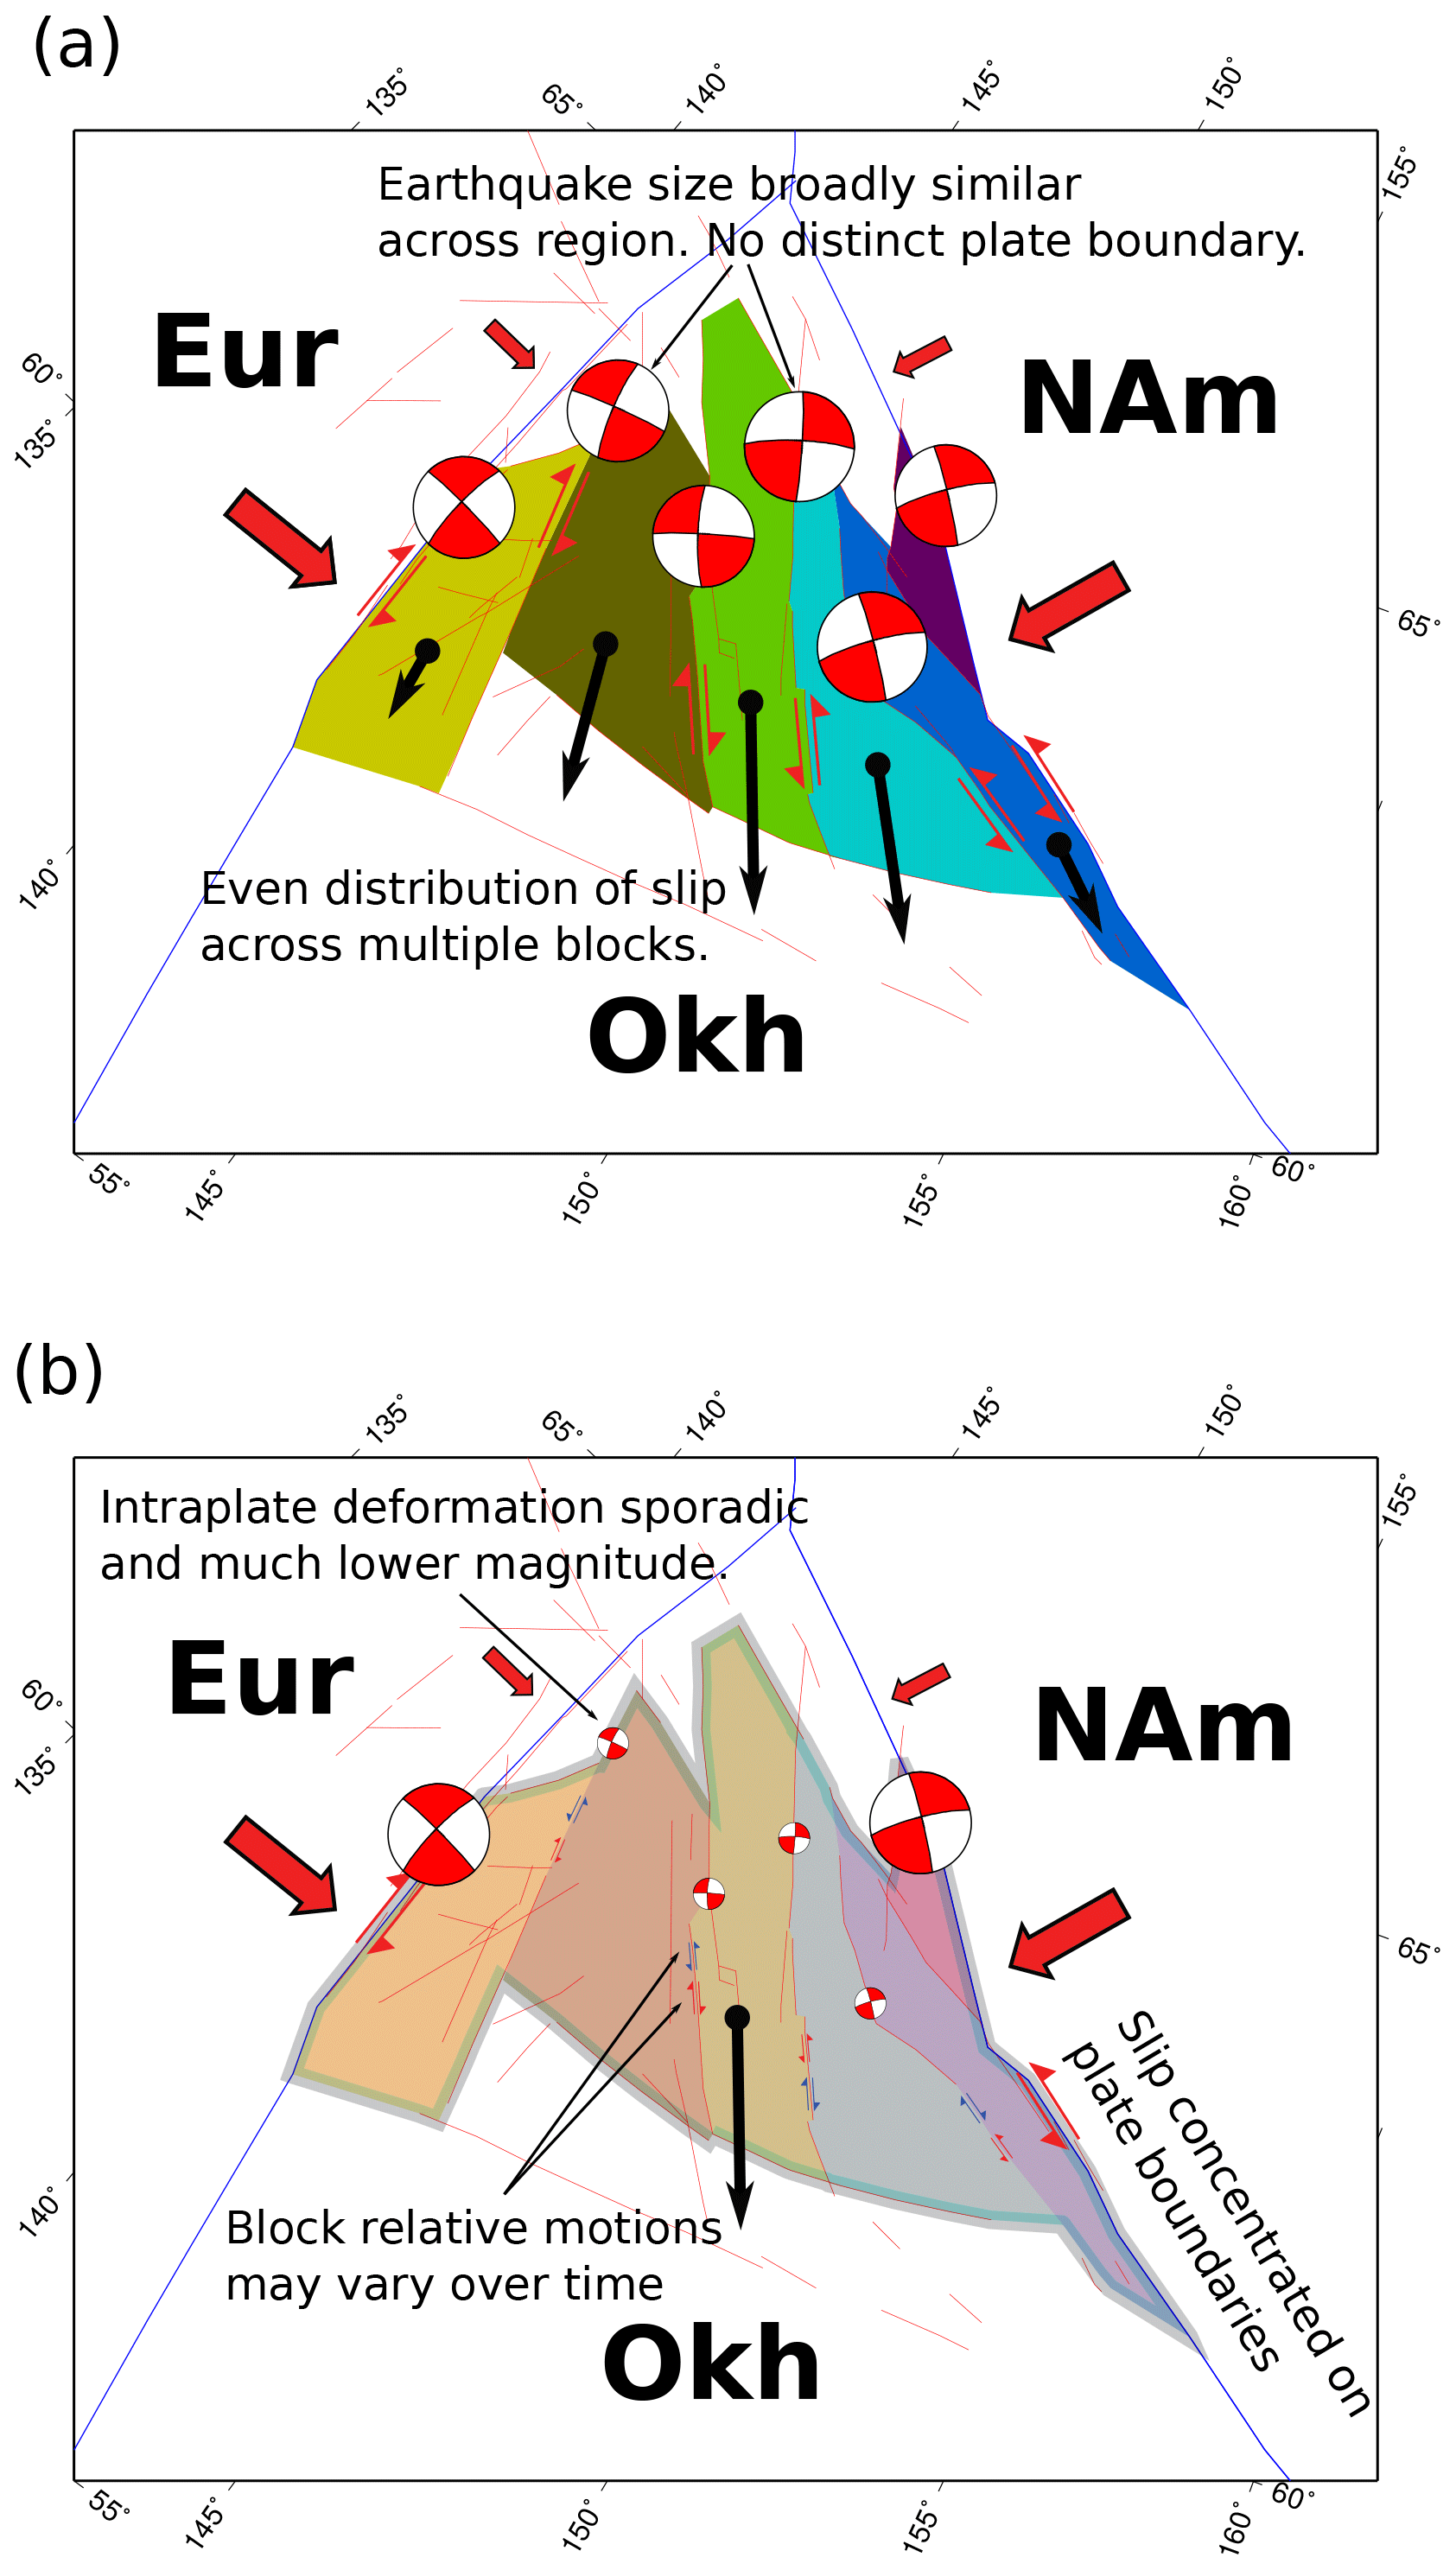
Figure 11Graphic showing two hypothesised modes of tectonic strain release in the northwestern corner of Okhotsk. (a) Region composed of independent blocks acting as independent micro-plates, with average relative slip across them fairly even. This means there is no distinct Okhotsk–North America or Okhotsk–Eurasia plate boundary. (b) Region composed of blocks that, although they can slip relative to one another, are mostly “stuck together” by compressive force of converging Eurasia–North America. In this case, the behaviour of northwest Okhotsk is plate-like, even if there is some intraplate deformation.
4.2 Palaeo-seismology, earthquake recurrence and seismic hazard
The fault scarp we encountered requires a recent earthquake or series of earthquakes of large magnitude and also forms part of a single 90 km fault segment that we can trace across the Seymchan–Buyunda basin. The opposite uplift polarities at the likely tips of this segment are a morpho-tectonic signature probably uniquely explained by rupture or repeated ruptures on a single fault segment, as suggested by elastic dislocation modelling. The magnitude of uplift implied by the Ulakhan fault scarp over ∼11.5 kyr also matches well with that predicted for the combination of a 90 km fault segment and the slip magnitude available due to plate-tectonic strain accumulation in this time period (Hindle and Mackey, 2011).
Our interpretation of the field observations has several implications. It confirms a potentially significant seismic hazard in the region, with a likelihood of ≥Mw 7.5 earthquakes occurring within the Seymchan Basin (the 90 km length 10 km deep 15 m slip event modelled in this paper is equivalent to an Mw 7.7 earthquake), and hence affecting both populated areas and large infrastructure, in particular the Kolyma hydro-electric dam located at Ust Srednekan (Fig. 2). It firmly constrains the location of the plate boundary to follow the trace of the Ulakhan fault, and suggests the slip and strain partitioning due to plate-tectonic motions is concentrated (–6 mm yr−1) on the plate boundaries. This in turn implies that the internal strain of the northwestern Okhotsk plate is confined to the release of small amounts (probably <0.5 mm yr−1) of accumulated slip. This may mean that the largest possible intraplate earthquakes are no bigger than the Mw 6.4 Artyk earthquake of 1971, although ultimately this will also depend on their frequency.
The wider question of recurrence times of large earthquakes on individual fault segments can also be partly addressed by our new results. Hindle and Mackey (2011) considered two possible scenarios for strain release along the plate boundaries of Okh, whilst assuming that rigid, plate-like extrusion occurred. In the first, strain was only seismically released along the Okh–NAm boundary (∼1150 km total length). This was considered a possibility due to the absence of any seismicity, or indeed any clearly defined structure for the plate boundary, along Eur–Okh, which would creep aseismically instead. In this case, the average recurrence times for large earthquakes on any segment of the Okh–NAm boundary were estimated to lie between ∼0.7 and 1.2 kyr. The second scenario had seismic strain release occurring along both Okh–NAm and the adjacent portion of Okh–Eur (total fault length ∼2500 km). In this case, recurrence times were estimated at ∼3.0–4.9 kyr. The lower estimate was based on average earthquake sizes Mw 7.6–7.8. The 3 kyr recurrence interval, with 62±4 m total slip and a suggested age for the offset channel of ∼11.5 kyr for the Seymchan segment of the Ulakhan fault, would give four earthquakes of average slip ∼15 m. Assuming a 15 km rupture depth and a 90 km length gives Mw 7.7 per event.
4.3 Earthquake size and fault dimensions
One of the key questions in earthquake seismology is the nature of any relationship between rupture length and average fault slip. Wells and Coppersmith (1994) analysed a large number of earthquakes from around the globe, and according to their empirical formulae, a single earthquake on a 90 km long fault segment should yield an average ∼1.9–2.8 m slip. Our estimate of ∼15 m slip in a single event on the Ulakhan fault seems large in this context. However, the natural example of the 1855 Mw 8.1 Wairarapa earthquake in New Zealand, which has a relatively well-constrained rupture length of ∼145 km and average slip ∼12–16 m, shows that much higher displacement–length ratios for strike-slip faults are possible (Rodgers and Little, 2006; Grapes, 1999). The Wairarapa fault is interesting as an analogue for the Ulakhan fault in several other ways. Studies have shown it has a Holocene slip rate of ∼6–12 mm yr−1, broadly comparable to that suspected for the Ulakhan, and is mostly undergoing strike-slip displacement (Wellman, 1972; Grapes, 1999). There have also been a sequence of large earthquakes (∼11) on this segment of the Wairarapa through the Holocene, demonstrated by differential uplift of a series of river and beach terraces adjacent to the fault (Grapes, 1999). In general, the Wairarapa fault provides a well-constrained example of the behaviour we hypothesise for the Ulakhan.
A comparison with the Wairarapa fault scarp, with a known source age, relatively well-constrained magnitude and similar kinematics, is also interesting for our study. The Wairarapa fault has multiple offset terrace levels, giving a high-resolution earthquake “stratigraphy” in the landscape and confirming the repeated Holocene ruptures on the segment. These terraces are due to a longer-wavelength landscape uplift pattern around the fault of up to 5 m per earthquake over a wide area (maximum terrace uplift today ∼40 m). This broader uplift pattern is the main driver of terrace formation and abandonment. The scarp from the 1855 earthquake shows a 1–2 m vertical offset and remains visible in many places today (Rodgers and Little, 2006; Grapes, 1999). Elastic modelling of the Wairarapa earthquake (Darby and Beanland, 1992) has suggested a listric fault geometry, partly to account for the broader uplift field. The Ulakhan fault may also be creating uplifted fluvial terraces in a similar way. However, it is difficult to separate tectonic from glacio-eustatic and other base-level-related signals. More generally, the Holocene behaviour of the Seymchan–Buyunda segment of the Ulakhan fault seems to be quite well modelled by a simple vertical strike-slip fault. However, further analysis is probably required in this context.
4.4 Large-scale tectonics
An interesting aspect of the northwestern corner of Okh is its tectonic situation, as a narrow sliver of a small plate caught in compression between much larger converging ones (Eur and NAm) (Fig. 11). Despite the convergent motion of Eur and NAm, the resultant motion along the boundaries of Okh is generally believed to be strike-slip with northwestern Okh moving towards the south, perpendicular to convergence (Cook et al., 1986; Hindle et al., 2006). Due to the proximity of the Eur–NAm Euler pole to the region, the rates of convergence, and hence overall rates of slip on boundaries, are low (∼5 mm yr−1). There are few, if any, other places on earth directly comparable to this. In terms of deformation rates, northern China is broadly similar (Liu et al., 2011). However, northern China is a zone of intraplate deformation. It is also the place with the longest historical record of seismicity in existence, which has allowed unique insights into the nature of slowly deforming regions, faulting and seismicity (Liu et al., 2011). It appears that northern China is composed of a system of linked faults across the plate interior, and these move to some degree in coordinated fashion (Liu et al., 2011). It is only possible to establish this due to the 2000-year record of earthquakes there. By contrast, our work suggests that northwestern Okhotsk is more plate-like with slip concentrated on discrete plate bounding faults, even if there may be relatively large intraplate earthquakes occurring too. It is thus interesting that plate-like behaviour can apparently persist into the realm of very low deformation rates (<5 mm yr−1). At the same time, the Ulakhan fault system may exhibit similar long-term behaviour to much faster slipping strike-slip faults. The North Anatolian Fault (NAF) slips at 23 mm yr−1 and has a length of ∼1000 km (Stein et al., 1997), a length broadly similar to the Ulakhan system. The NAF is also segmented, and sequential earthquake migration over longer time periods on different segments has been observed within historical records (Stein et al., 1997), in a similar fashion to that now postulated at much slower rates along the Ulakhan fault.
We have documented a fault scarp on the Buyunda alluvial fan, at the eastern end of a ∼90 km segment of the Ulakhan fault in the Seymchan Basin in northeastern Russia. We suggest the scarp is indicative of a series of large earthquakes affecting the segment. At the western end of this segment, which we can trace almost continuously in the landscape from remote sensing data, we find a probable scarp of opposite uplift polarity to that in the east. We suggest these two scarps mark the ends of a fault segment that ruptures repeatedly as a single entity. The good fit of the uplift pattern we have found in the field to that generated by simple elastic dislocation models of left-lateral strike-slip faults of the appropriate magnitude and slip also tends to confirm the idea of a single fault segment.
Age dating of a fluvial system that seems to have become abandoned due to formation of the scarp on the western edge of the Buyunda alluvial fan suggests the sequence of earthquakes causing abandonment began ∼11.5 ka. This age may also be associated with a 62±4 m left-lateral offset of an ∼11.5 ka fluvial feature.
In general, our field data suggest that the Okhotsk–North America plate boundary in this region slips at 5.3±1.3 mm yr−1, thereby releasing almost all the available tectonic strain due to Eur–NAm plate convergence (Hindle et al., 2006, 2009; Hindle and Mackey, 2011). This slip rate is also in agreement with local predictions from the Okh–NAm Euler vector.
The earthquake recurrence analysis in previous work (Hindle and Mackey, 2011) and comparison with the new field data suggests infrequent earthquakes of relatively large magnitude (>Mw 7.5, every ∼3 kyr) are most likely responsible for the Holocene tectonic geomorphology of the basin. Given that strain accumulation must be continuing to the present day, the seismic hazard in the local area needs careful assessment. Perhaps the most critical question now is when exactly did the last large earthquake occur on this segment of the fault? Given sufficient resources, it may be possible to determine this by trenching across the fault scarp.
The FORTRAN code written for the purpose of georeferencing the aerial photographs can be requested from the main author (David Hindle). It may also be the subject of a future publication.
A file of the x, y coordinates (longitude, latitude) of the mapped segments of the Ulakhan fault, based on the TANDEM-X DEM and aerial photo interpretation is available from the main author (David Hinde). A GeoTIFF file of the composite scene of aerial photographs in geographic coordinates may be requested for academic use only. These data are not to be redistributed. Anyone wishing to have them must request them for themselves directly from the main author (David Hindle).
Certain minerals like quartz and feldspar can store energy released by radioactive decay. In the case of sedimentary material, this radioactivity is derived to a major extent from isotopes of uranium (e.g. 238U) and thorium (e.g. 232Th) and their daughter nuclides, as well as potassium (40K), both in the sediments of interest and their surroundings. This stored energy can be released by heating the minerals or by exposure to light. The energy is released as light (luminescence) which can be measured using a photomultiplier or a CCD camera. The higher the level of radioactivity and the longer the duration of exposure, the more energy will have accumulated and the more light will be released. Hence, for sediments, it is assumed that provided their minerals are sufficiently exposed to sunlight during transport, prior to deposition, in order to reset the radioactive stored energy, the total amount of radioactive energy measured by luminescence (radioactive dose in grays, Gy) can be divided by the dose rate (rate of energy supplied to the minerals by radioactive decay within the sediments, measured in Grays per year, Gy yr−1) to give the luminescence age of the rock (Preusser et al., 2008). In sediments, this age should usually reflect the time since final deposition and burial.
A1 Sample collection
Sediment was collected from pits dug in abandoned channels of the fan-top drainage system of the Buyunda fan. The aim of the collection procedure was to collect sediments that were buried and cut off from light, and hence began accumulating radioactive energy derived only from the surrounding sediments and internal crystalline sources. As any fresh exposure to light will release this energy, sampling must be carried out in a light-proof way. Hence, we used a metal sampler with an internal removable light-proof plastic sleeve, to take samples from the pit wall, penetrating up to 20 cm. After removing the sampler from the pit wall, the ends of the plastic sleeve were sealed with light-proof tape immediately upon removal from the sampler, and then stored in a light-proof bag. Sample pits were generally ∼1 m deep (the depth at which permafrost was first encountered), and samples were taken at a depth of 80 cm within the pit (Fig. A1). An example of the localities for sample gathering is shown in Fig. A2. The sample pits showed thin soils (generally 20–30 cm with roots evident to up to 50 cm. From 40 cm and deeper, some sedimentary structure was visible, with faint cross-bedding discernible, sometimes marked by basal pebble conglomerate layers. This suggests channel-like flow, or possibly overbank sedimentation with flow.).
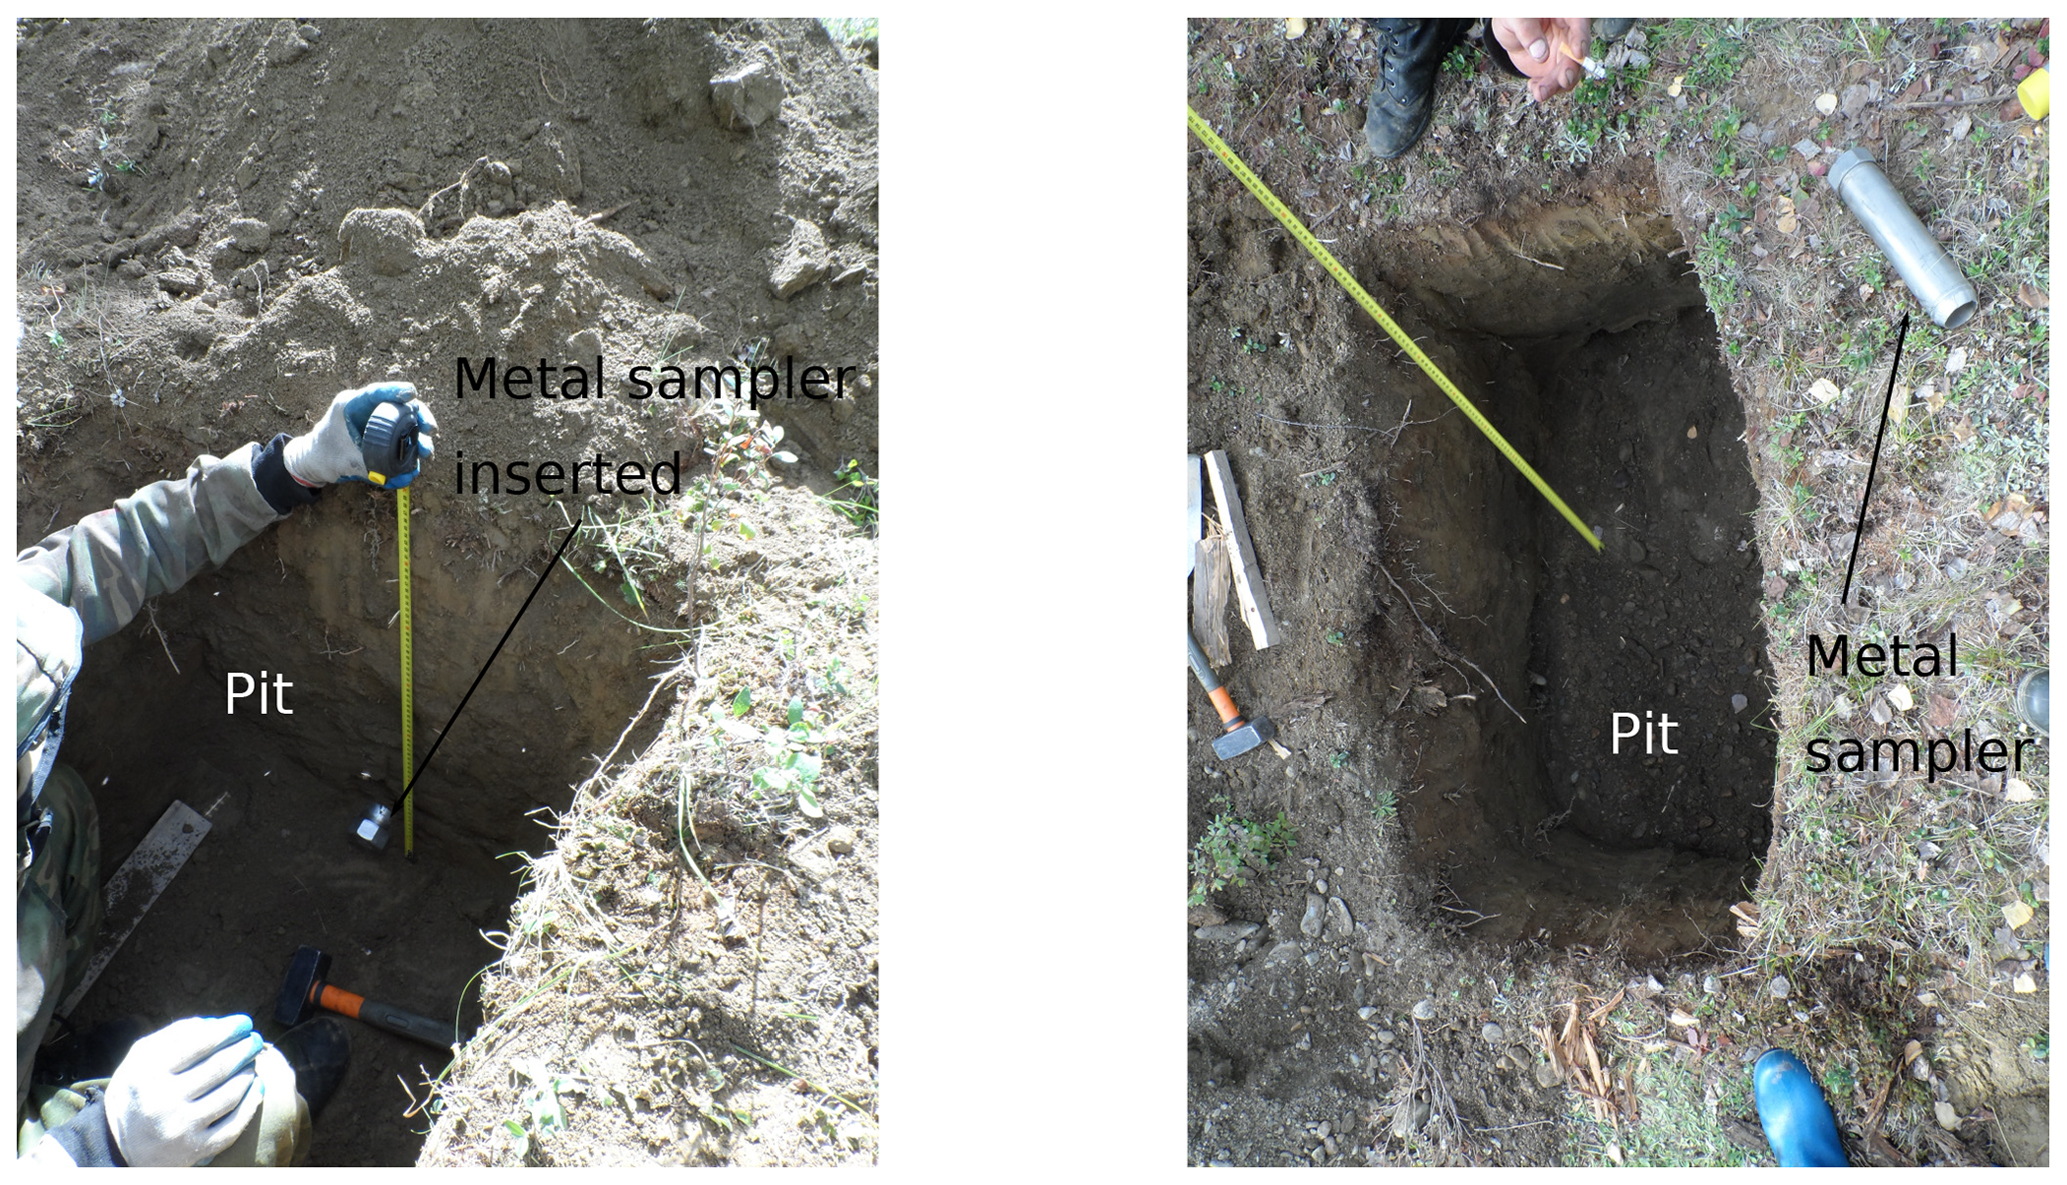
Figure A1Sample pits and sampler usage on the Ulakhan fault scarp. Sampler is inserted at the deepest part of the pit, usually by hammering, then extracted by hand.
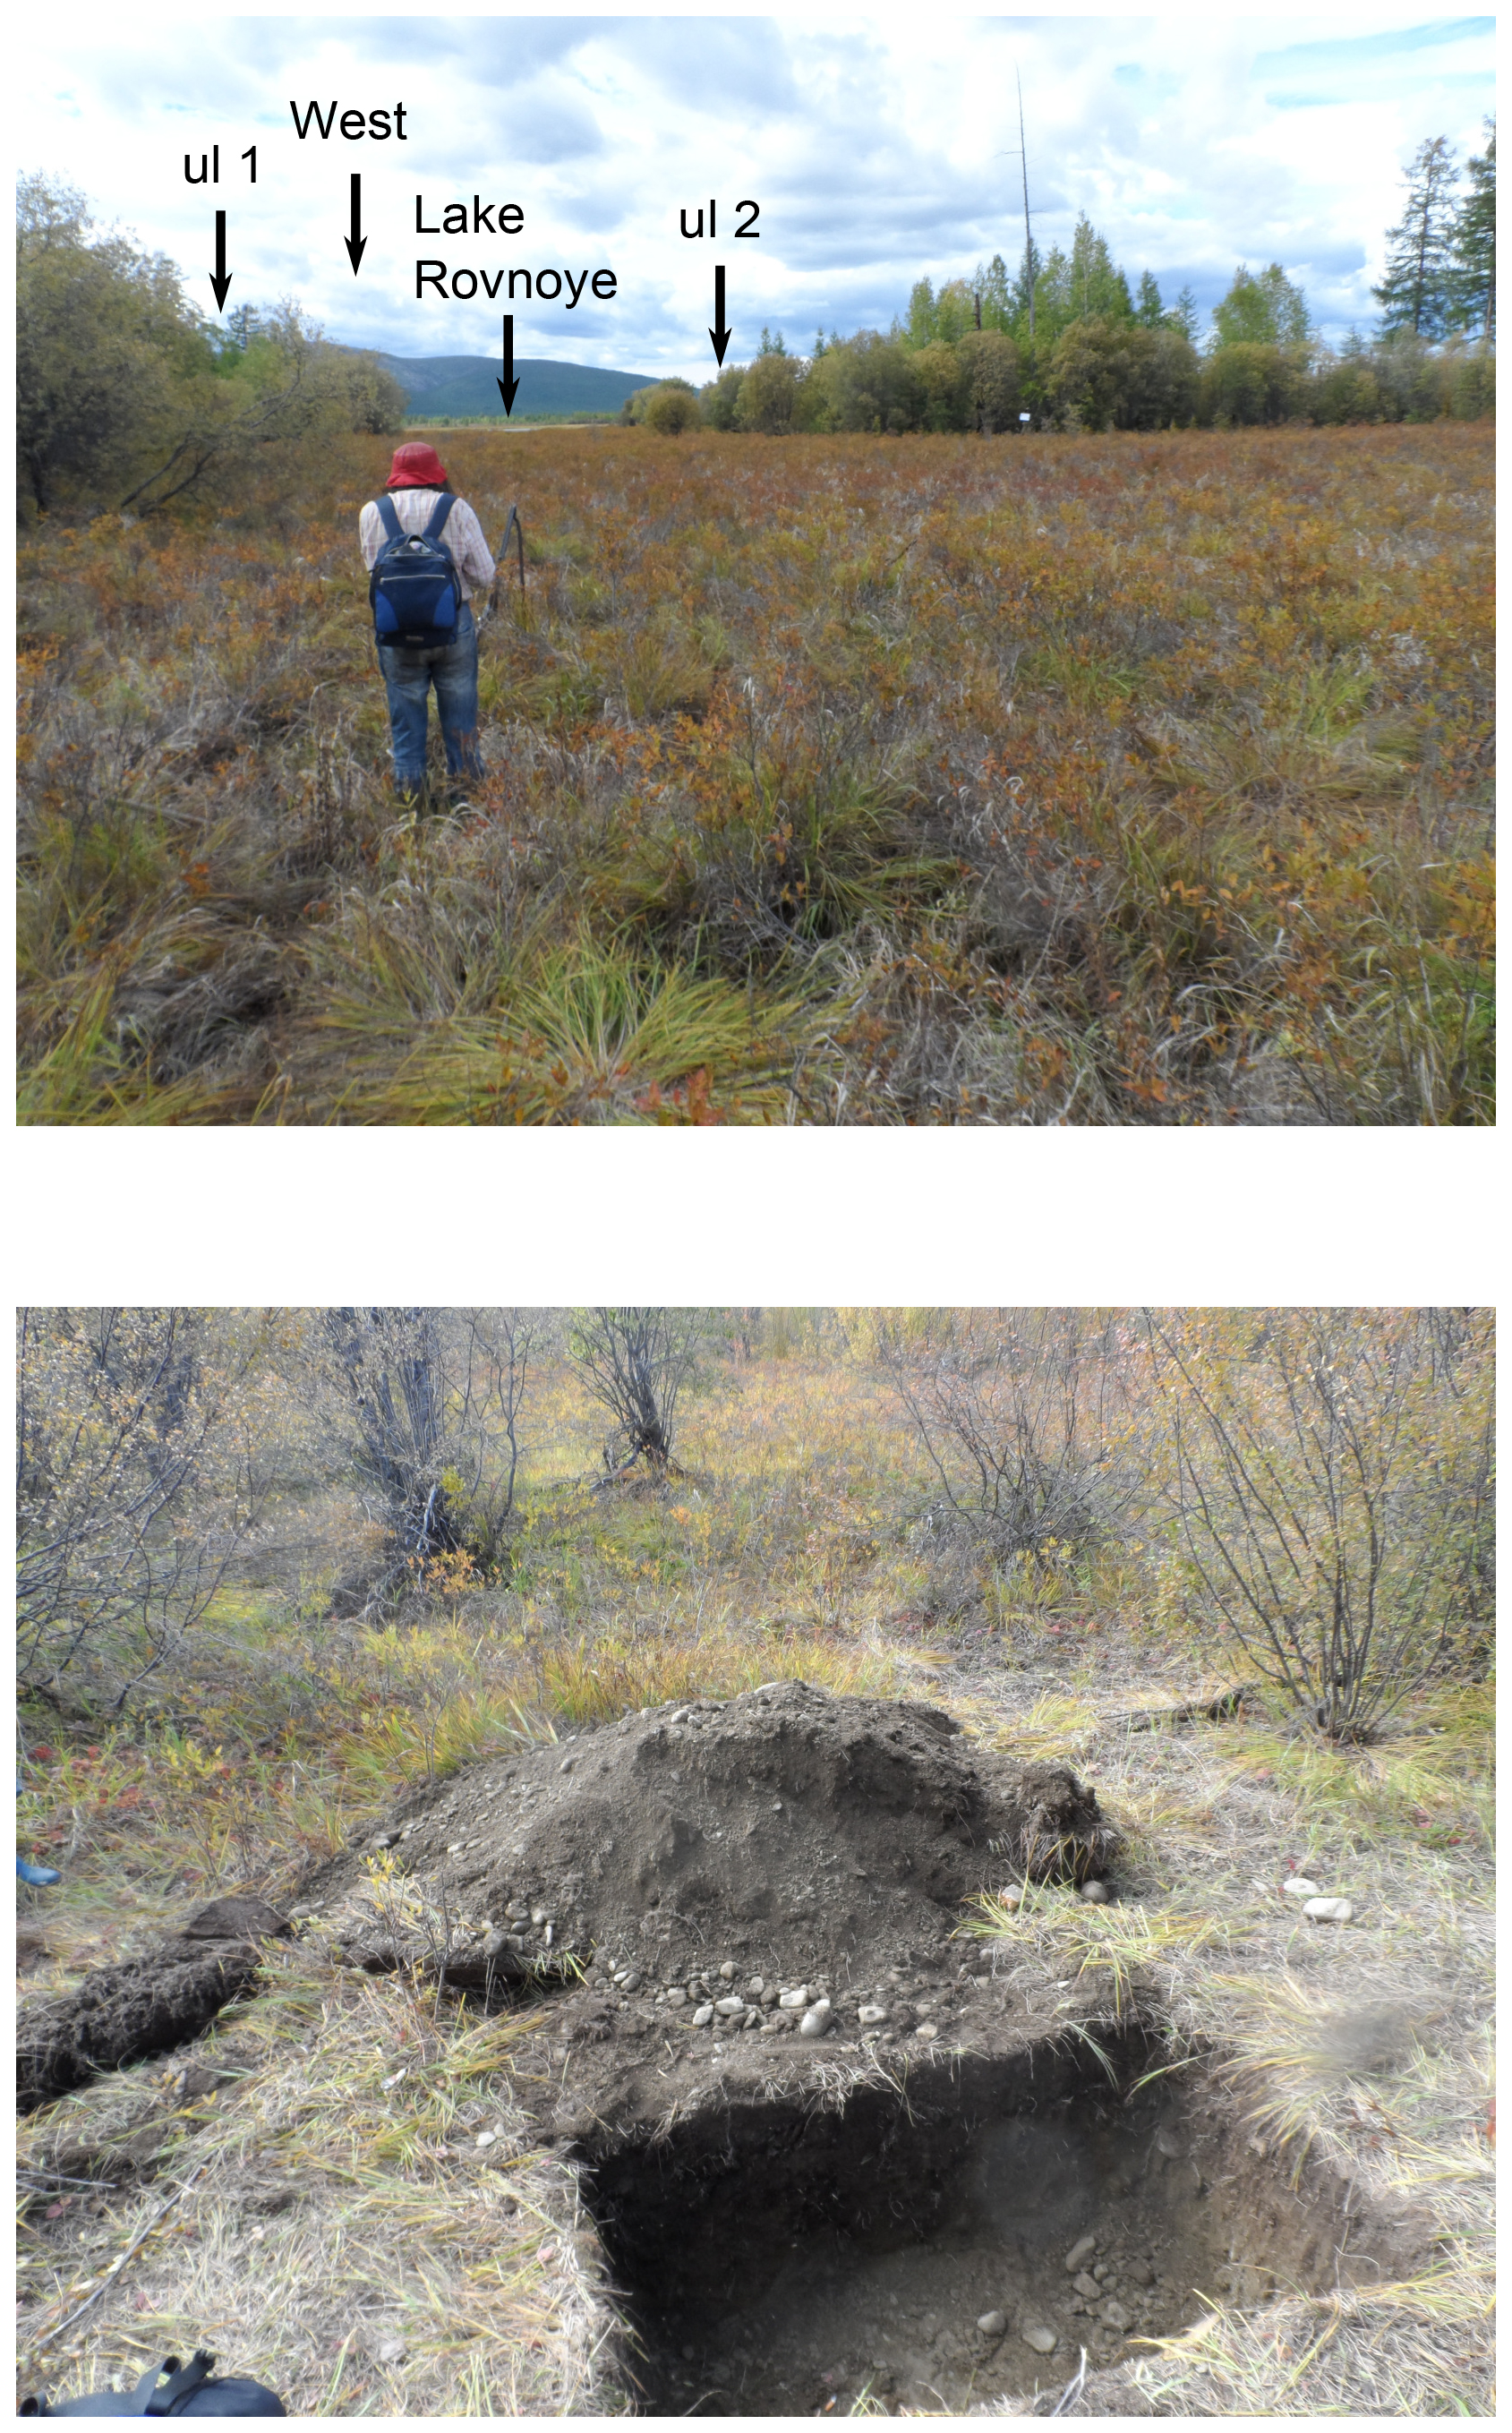
Figure A2Sample sites of UL1 and UL2, both areas of slightly raised topography, apparently offset by the Ulakhan fault, and an example of excavated material from hole. Note the pebbles, some of which were from near the surface, but most of which came from sample pit.
A2 Sample preparation and measurement
Age determinations were carried out at the Klaus-Tschira-Archäeometrie-Zentrum, in Mannheim. Sediments were sieved to separate grain sizes of 100–200 µm (coarse) and less than 100 µm (fine). Organic material was destroyed using Perdrogen (30 %). Acetic acid (30 %) was used to remove carbonates. The coarse-grain fraction was split into mineral fractions using heavy liquid separation (tungstate density 2.75 and 2.62 g cm−3) to extract quartz minerals. These were etched with 48 % hydrofluoric acid for 45 min to remove the outer 20 µm of the grain that are influenced by alpha radiation and the material below 100 µm was removed by sieving. The fine-grain material was further refined to a 4–11 µm fraction by settling in acetone. The first step removes grains larger than 11 µm and a second step excludes grain sizes smaller than 4 µm (Lang et al., 1996). Both fractions, 100–200 and 4–11 µm, were then deposited onto steel discs for measurement.
We used a standard Risø TL-DA-20 reader equipped with a 90Sr∕90Y source for beta irradiation (strength 0.06 Gy s−1 for coarse grain, 0.08 Gy s−1 for fine grain) and an alpha source 241Am for fine grain (strength 0.116 Gy s−1). Coarse- and fine-grain quartz was stimulated with blue LEDs (470±20 nm) and the luminescence signal was detected using 7.5 µm Hoya U340 filters (280–370 nm), whereas fine-grain feldspar was measured by stimulation with infrared LEDs (870±40 nm) and detected in the blue range using filter BG3 and BG39 (3 mm each, ∼350–420 nm). For all coarse-grain quartz samples, preheat tests have been made at 180, 200, 220, 240 and 260 ∘C at 2 aliquots each to determine a stable preheat temperature. Each measurement cycle of the quartz samples included an infrared measurement to bleach feldspar contamination. In addition for some of the coarse-grain samples dose recovery tests have been performed on six aliquots each. The measurement followed the suggestions of Lopez and Rink (2007) and Murray and Wintle (2000).
Quartz was usually extracted from the fine-sand fraction between 100 and 200 µm. We also used polymineral fine-grain samples of grain sizes 4–11 µm to measure the feldspar signal. Quartz could also be measured in this fraction. Measuring both quartz and feldspar from the same grain size fraction enables us to interpret different aspects of sedimentation. Quartz bleaches (i.e. releases luminescence energy due to exposure to light) much faster than feldspar; hence, if ages of both minerals overlap within errors the sediment was well bleached and the sedimentation process was rather slow meaning grains were completely reset before deposition and burial. If the ages differ significantly and the quartz age is the younger of the two, it is likely that the sediment was accumulated abruptly and minerals were not properly bleached (radioactive energy reset). In this case only the quartz ages are significant as they reset their radioactive dose quickly. Samples in this condition are referred to as “partially bleached” and only the quartz ages (younger) from the sample are used.
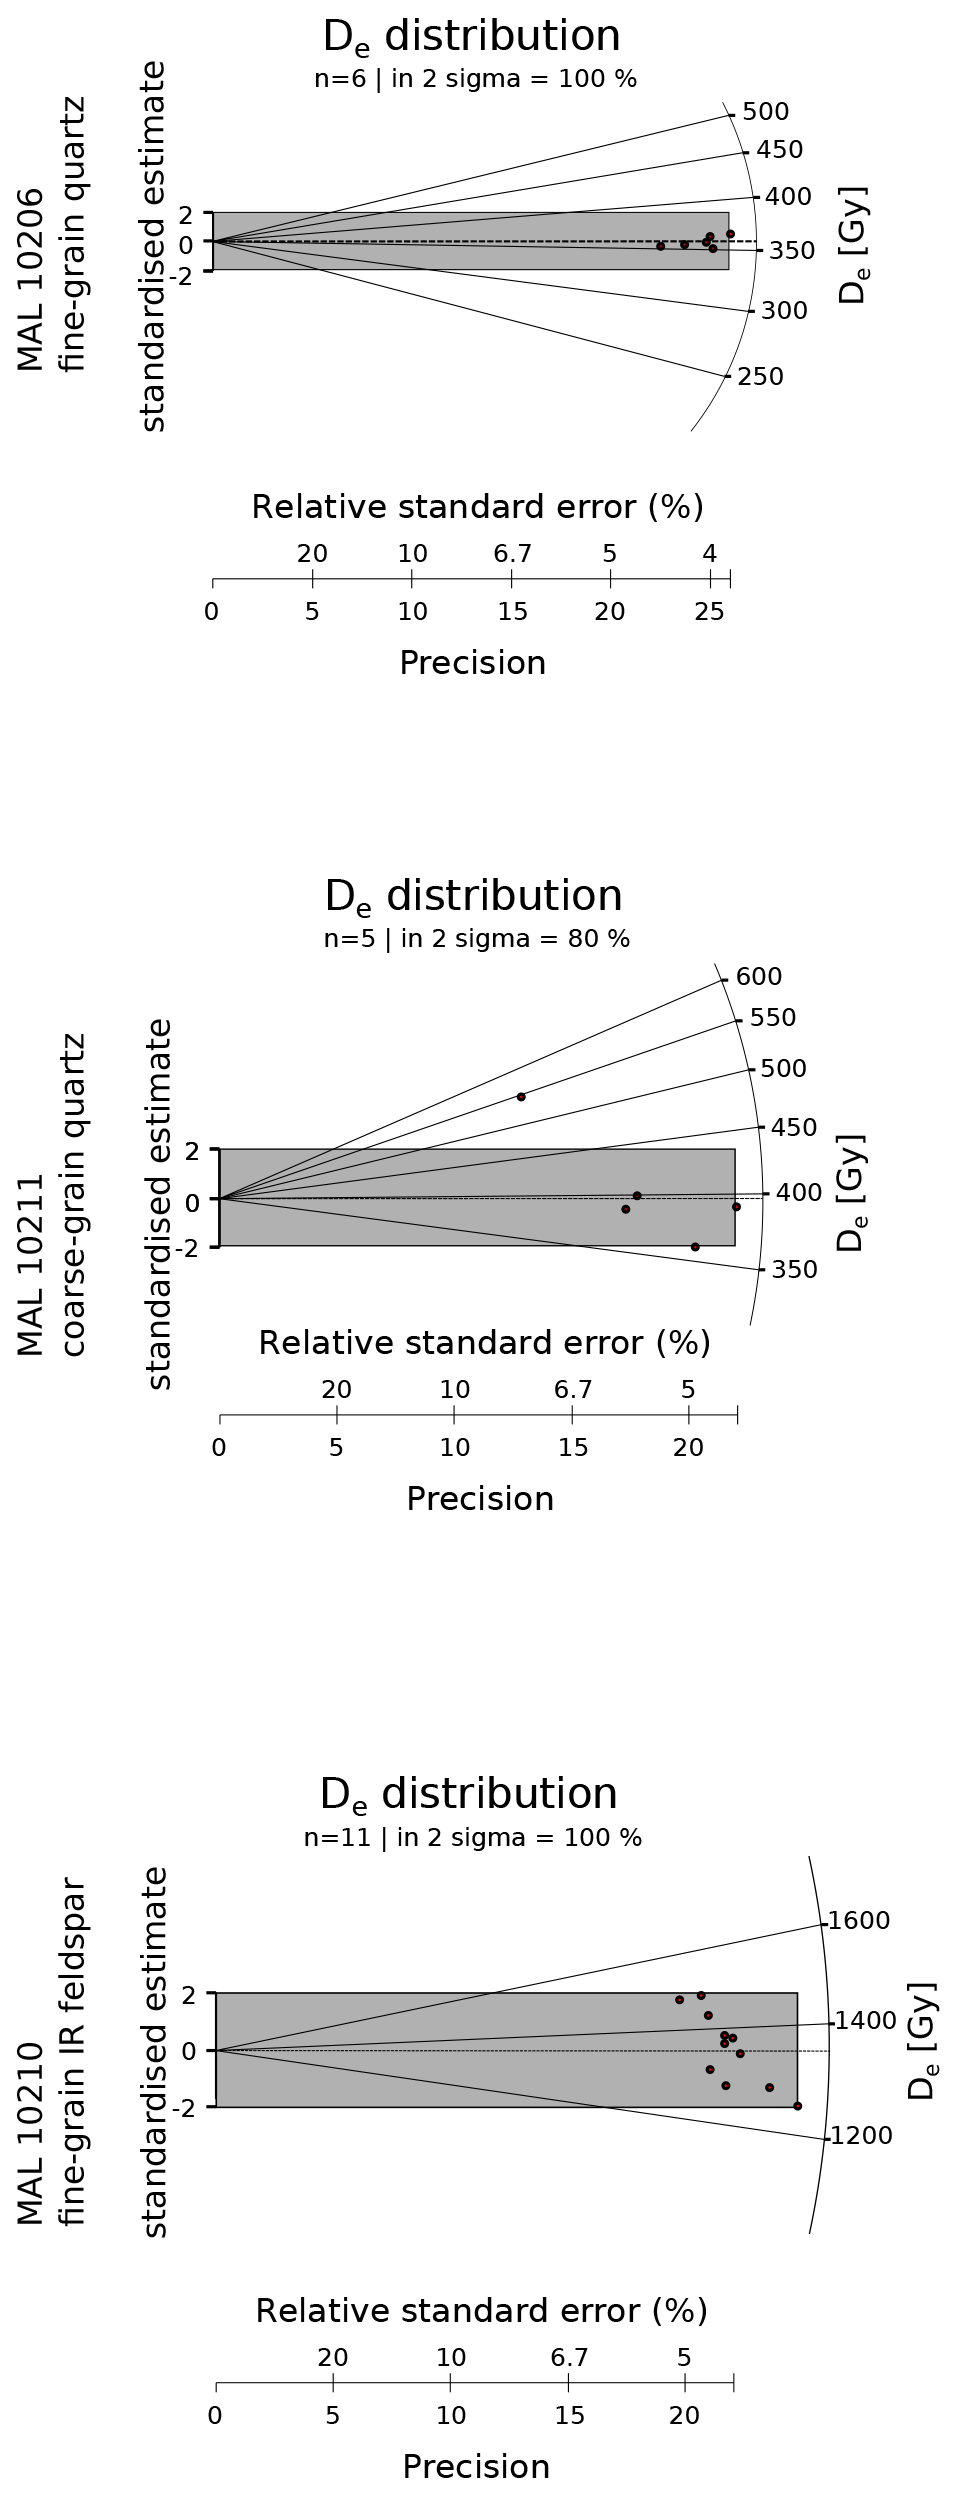
Table A1OSL and IRSL analysis: samples suitable for age determination either from quartz (OSL) or well bleached feldspar (IRSL). Wa.Co. stands for water content (i.e. humidity).
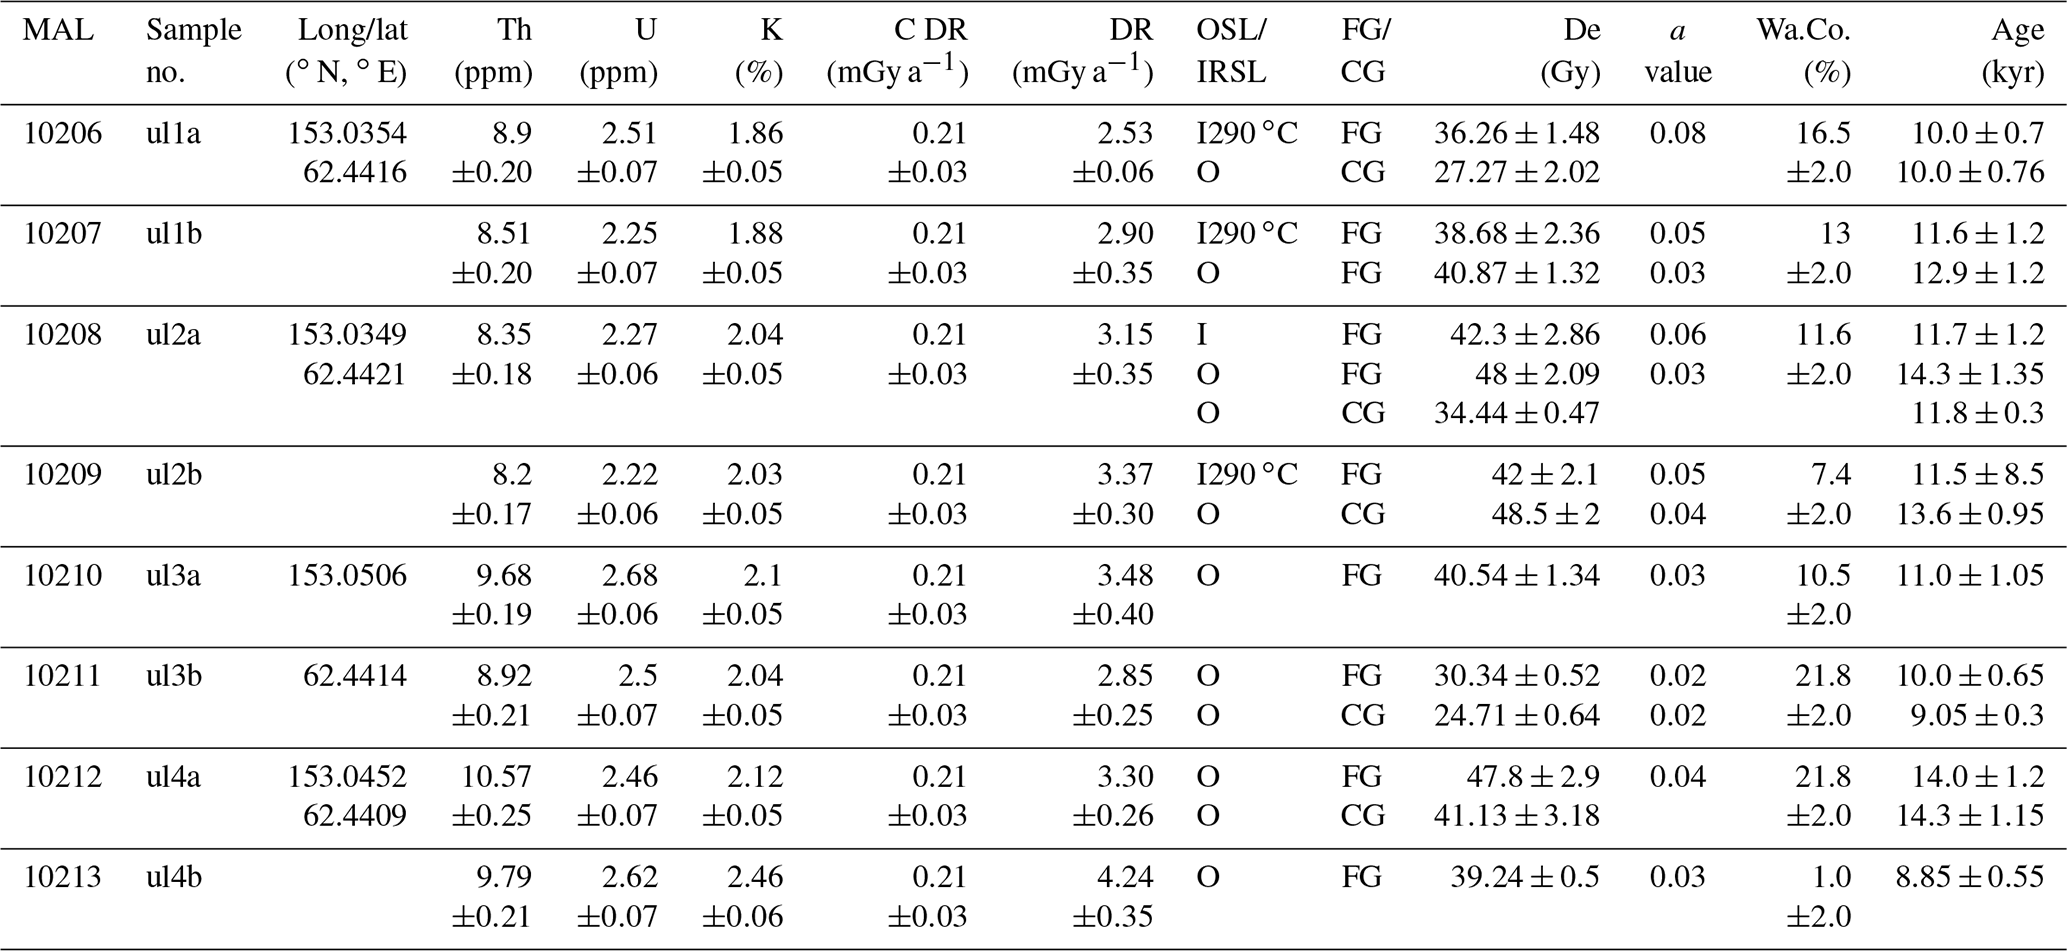
FG/CG: fine grain/coarse grain; Th, U, K: thorium, uranium, potassium content (required for calculating dose rate); a value: ratio of De determined by β irradiation and by α irradiation; C DR: cosmic dose rate, dependant on geographic coordinates; DR: dose rate from radionuclide contents; De: equivalent dose, dose determined through OSL/IRSL measurement; I290 ∘C: IR preheat 290 ∘C IRSL measurement (see Table A3).
Table A2IRSL data unsuitable for age determinations due to partial bleaching.

FG/CG: fine grain/coarse grain; Th, U, K: thorium, uranium, potassium content (required for calculating dose rate); a value: ratio of De determined by β irradiation and by α irradiation; C DR: cosmic dose rate, dependant on geographic coordinates; DR: dose rate from radionuclide contents; De: equivalent dose, dose determined through OSL/IRSL measurement; I290 ∘C: IR preheat 290 ∘C IRSL measurement (see Table A3); I 50 ∘C, 125 ∘C, 290 ∘C: post–post-IR IRSL measurement at elevated temperatures (see Table A3).
For feldspar a post-IR IR procedure was used, where an initial low-temperature IR bleach is carried out and then a series of measurements of the remaining IRSL signal are made at elevated temperatures (Buylaert et al., 2009) and IR 290 measurements were made according to a procedure outlined by Rieser and Kadereit (2012). The measurement steps for IRSL and also for quartz OSL are given in Table A3.
Examples of radial plots from OSL and IRSL measurements are shown in Fig. A3.
A3 Results
The results are shown in Tables A1 and A2.
Table A3Measurement steps used for IR 290, post-IR IR and OSL dating.
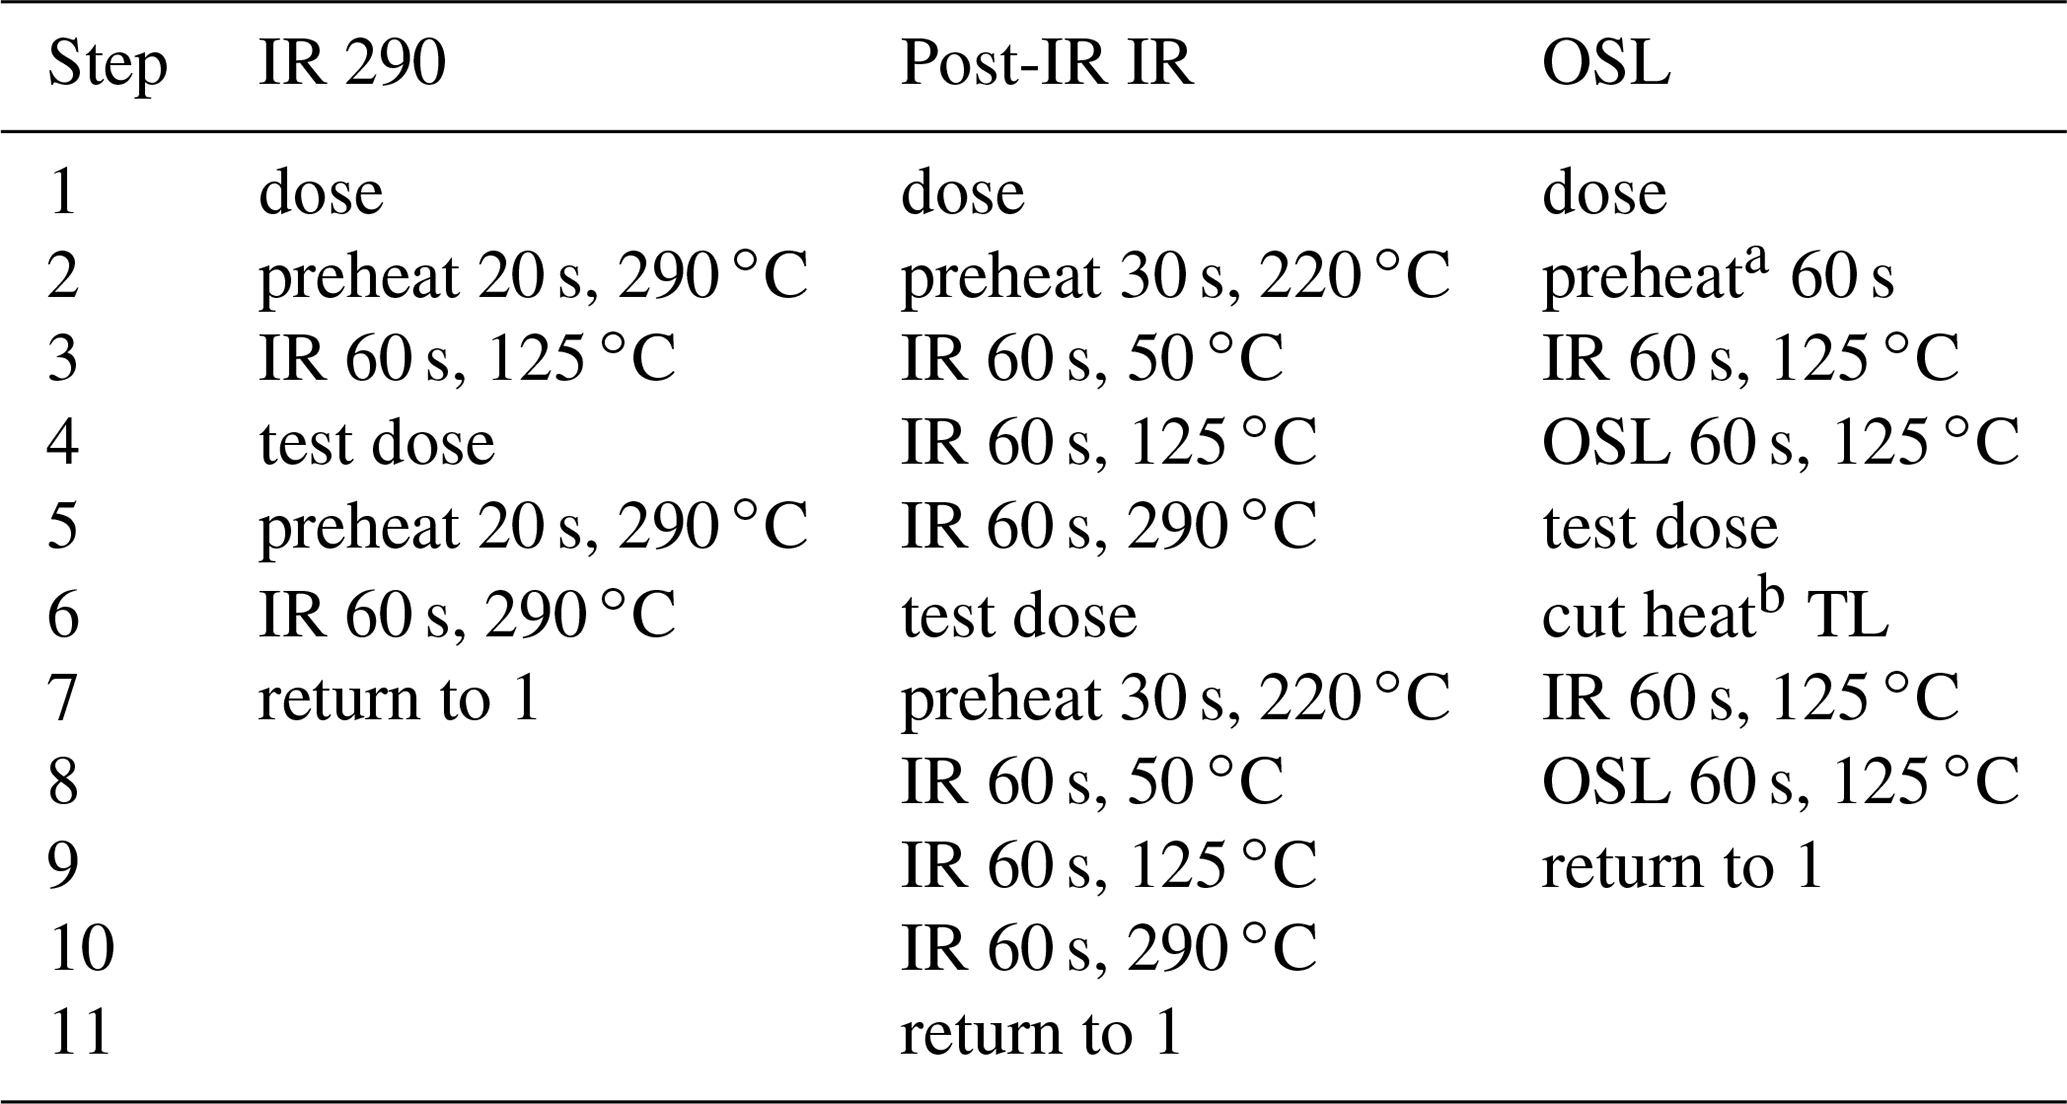
a As determined from preheat test. b 20 ∘C lower than preheat temperature.
The organic material for radiocarbon age dating was pretreated to remove carbonates and humic acids. It was then graphitised and measured with a MICADAS (Mini Carbon Dating System, IONPLUS) AMS system. The results were calibrated using Oxcal 4.2 and the IntCal13 dataset. Details of the measurement procedure can be found in Kromer et al. (2013). Results of the radiocarbon dating can be found in Table B1.

DH undertook the field campaign in 2012, organised sample collection and processing, and collated and interpreted the major part of the data used in this project. He was the recipient of DFG grant HI-1409/3-1 and project DEM_GEOL2124. BS accompanied the 2012 field work and provided support in obtaining data. SL processed all OSL samples and provided interpretations of the results. KM provided some data from a field visit in 2011.
The authors declare that they have no conflict of interest.
The work of David Hindle was supported by DFG grant no. HI-1409/3-1. Access
to TANDEM-X data was granted by DLR (Deutsches Zentrum für Luft- und
Raumfahrt/German Aerospace Centre) under project DEM_GEOL2124. David Hindle
also acknowledges the support of NEISRI, the Seismological Branch of the
Russian Geophysical Survey in Magadan, as well as their station in Seymchan,
and their help with logistics and permits. Lothar Laake (mechanical workshop, Geoscience Centre Göttingen) manufactured the OSL samplers. Most of the figures in this paper were
processed and prepared using GMT v5.4 (Wessel et al., 2013).
This open-access publication was funded
by the University of
Göttingen.
Edited by: Bernhard Grasemann
Reviewed by: Valery Imaev and one anonymous referee
Apel, E., Bürgmann, R., Steblov, G., Vasilenko, N., King, R., and Prytkov, A.: Independent active microplate tectonics of northeast Asia from GPS velocities and block modeling, Geophys. Res. Lett., 33, L11303, https://doi.org/10.1029/2006GL026077, 2006. a, b, c, d
Arefiev, S., Rogozhin, E., Tatevossian, R., Rivera, L., and Cisternas, A.: The Neftegorsk (Sakhalin Island) 1995 earthquake: a rare interplate event, Geophys. J. Int., 143, 595–607, https://doi.org/10.1046/j.1365-246X.2000.00234.x, 2000. a
Bouchard, F., MacDonald, L., Turner, K., Thienpont, J., Medeiros, A., Biskaborn, B., Korosi, J., Hall, R., Pienitz, R., and Wolfe, B.: Paleolimnology of thermokarst lakes: a window into permafrost landscape evolution, Arct. Sci., 1, 1–27, https://doi.org/10.1139/AS-2016-0022, 2016. a
Buylaert, J.-P., Murray, A., Thomsen, K., and Jain, M.: Testing the potential of an elevated temperature IRSL signal from K-feldspar, Radiat. Meas., 44, 560–565, https://doi.org/10.1016/j.radmeas.2009.02.007, 2009. a
Chinnery, M. A.: The deformation of the ground around surface faults, B. Seismol. Soc. Am., 51, 355–372, 1961. a
Cook, D. B., Fujita, K., and McMullen, C.: Present day plate interactions in NE Asia: North American, Eurasian and Okhotsk Plates, J. Geodyn., 6, 33–51, https://doi.org/10.1016/0264-3707(86)90031-1, 1986. a, b
Darby, D. J. and Beanland, S.: Possible source models for the 1855 Wairarapa earthquake, New Zealand, J. Geophys. Res., 97, 12375–12389, https://doi.org/10.1029/92JB00567, 1992. a
Drabkun, I. E., Anukeev, N. P., Polov, G. G., and Tutov, V. A.: Northeastern Soviet Union, geological description, in: Geology of the Soviet Union, edited by: Sidorenko, A., Soviet Ministry of Geology, Moscow, vol. XXX-I, 1970. a
Fujita, K., McLean, M., Mackey, K., and Kozmin, B.: The 1971 Artyk earthquake: Is the locus of motion changing in northeast Russia?, EOS T. Am. Geophys. Un., 83, F1247, 2002. a
Grapes, R.: Geomorphology of faulting: The Wairarapa Fault, New Zealand, Zeitschrift für Geomorphologie Supplement Volumes, 191–217, 1999. a, b, c, d
Grapes, R. H. and Wellman, H. W.: The Wairarapa Fault, Research School of Earth Sciences, Victoria University of Wellington, 1988. a
Hetzel, R., Niedermann, S., Tao, M., Kubik, P. W., Ivy-Ochs, S., Gao, B., and Strecker, M. R.: Low slip rates and long-term preservation of geomorphic features in Central Asia, Nature, 417, 428–432, https://doi.org/10.1038/417428a, 2002. a, b
Hindle, D. and Mackey, K.: Earthquake recurrence and magnitude and seismic deformation of the northwestern Okhotsk plate, northeast Russia, J. Geophys. Res., 116, B02301, https://doi.org/10.1029/2010JB007409, 2011. a, b, c, d, e, f, g, h, i, j
Hindle, D., Fujita, K., and Mackey, K.: Current deformation rates and extrusion of the northwestern Okhotsk plate, northeast Russia, Geophys. Res. Lett., 33, L02306, https://doi.org/10.1029/2005GL024814, 2006. a, b, c
Hindle, D., Fujita, K., and Mackey, K.: Deformation of the Northwestern Okhotsk Plate: How is it happening?, Stephan Mueller Spec. Publ. Ser., 4, 147–156, https://doi.org/10.5194/smsps-4-147-2009, 2009. a, b, c
Hubert-Ferrari, A., Armijo, R., King, G., Meyer, B., and Barka, A.: Morphology, displacement, and slip rates along the North Anatolian Fault, Turkey, J. Geophys. Res., 107, 2235, https://doi.org/10.1029/2001JB000393, 2002. a, b
Imaev, V., Imaeva, L., Koz'min, B., and Fujita, K.: Active faults and recent geodynamics of the Yakutian seismic belts, Geotectonics, 28, 146–158, 1994. a
Imaeva, L., Koz'min, B., Imaev, V. S., and Mackey, K.: Structural dynamic analysis of the epicentral zone of the Ilin-Tas earthquake (Feb 14, 2013, Ms=6.9), J. Seismol., 19, 341–353, https://doi.org/10.1007/s10950-014-9469-5, 2015. a
Kromer, B., Lindauer, S., Synal, H.-A., and Wacker, L.: MAMS – a new AMS facility at the Curt-Engelhorn-Centre for Achaeometry, Mannheim, Germany, Nucl. Instrum. Meth. B, 294, 11–13, 2013. a
Kuznetsov, V. M.: Sheet P-56-XVI explanatory booklet, National Geological Map of the USSR, Ministry of Geology, Moscow, 1989. a
Lang, A., Lindauer, S., Kuhn, R., and Wagner, G. A.: Procedures used for optically and infrared stimulated luminescence dating of sediments in Heidelberg, Ancient TL, 14, 7–11, 1996. a
Liu, M., Stein, S., and Wang, H.: 2000 years of migrating earthquakes in North China: How earthquakes in midcontinents differ from those at plate boundaries, Lithosphere, 3, 128–132, 2011. a, b, c
Lopez, G. I. and Rink, W. J.: Characteristics of the burial environment related to quartz SAR-OSL dating at St. Vincent Island, NW Florida, USA, Quat. Geochronol., 2, 65–70, https://doi.org/10.1016/j.quageo.2006.05.035, 2007. a
McLean, M.: Tectonic Implications of the May 18, 1971 ArtykEarthquake, Northeast Russia, Master's thesis, Michigan State University, East Lansing, 122 pp., 2009. a
McLean, M. S., Fujita, K., Mackey, K. G., and Koz'min, B. M.: The 1971 Artyk earthquake sequence, Northeast Russia, AGU Fall Meeting Abstracts, T33B-1911, 2009. a
Morgan, W. J.: Rises, trenches, great faults and crustal blocks, J. Geophys. Res., 73, 1959–1982, https://doi.org/10.1029/JB073i006p01959, 1968. a
Murray, A. S. and Wintle, A. G.: Luminescence dating of quartz using an improved single-aliquot regenerative-dose protocol, Radiat. Meas., 32, 57–73, https://doi.org/10.1016/S1350-4487(99)00253-X, 2000. a, b
Nokleberg, W. J.: Metallogenesis and tectonics of the Russian Far East, Alaska, and the Canadian Cordillera, U.S. Dept. of the Interior, U.S. Geological Survey, U.S. Geological Survey professional paper no. 1697, available at: https://pubs.usgs.gov/pp/1765/index.html (last access: 19 April 2019), 2005. a
Okada, Y.: Internal deformation due to shear and tensile faults in a half-space, B. Seismol. Soc. Am., 82, 1018–1040, 1992. a
Patyk-Kara, N. and Postolenko, G.: Structure and Cenozoic evolution of the Kolyma river valley, eastern Siberia, from its upper reaches to the continental shelf, P. Geologist. Assoc., 115, 325–338, https://doi.org/10.1016/S0016-7878(04)80012-9, 2004. a
Preusser, F., Degering, D., Fuchs, M., Hilgers, A., Kadereit, A., Klasen, N., Krbetschek, M., Richter, D., and Spencer, J.: Luminescence dating: basics, methods and applications, Eiszeitalter und Gegenwart Quaternary Science Journal, 57, 95–149, 2008. a
Rieser, U. and Kadereit, A.: Anomales Fading: Alte Weisheiten, neue Experimente und die Renaissance der Spektrometrie, Das DEutsche Treffen zur Lumineszenz – und ESR – Datierung, available at: http://www.cez-archaeometrie.de/?p=319#more-319 (last access: 19 April 2019), 2012. a
Rodgers, D. and Little, T.: World's largest coseismic strike-slip offset: The 1855 rupture of the Wairarapa Fault, New Zealand, and implications for displacement/length scaling of continental earthquakes, J. Geophys. Res., 111, B12408, https://doi.org/10.1029/2005JB004065, 2006. a, b, c, d, e
Sella, G., Dixon, T., and Mao, A.: REVEL: A model for Recent plate velocities from space geodesy, J. Geophys. Res., 107, ETG 11-1–ETG 11-30, https://doi.org/10.1029/2000JB000033, 2002. a, b, c, d, e
Seno, T., Sakurai, T., and Stein, S.: Can the Okhotsk plate be discriminated from the North American plate?, J. Geophys. Res., 101, 11305–11315, https://doi.org/10.1029/96JB00532, 1996. a, b, c, d
Steblov, G., Kogan, M., King, R., Scholz, C., Bürgmann, R., and Frolov, D.: Imprint of the North American plate in Siberia revealed by GPS, Geophys. Res. Lett., 30, 1924, https://doi.org/10.1029/2003GL017805, 2003. a
Stein, R. S., Barka, A. A., and Dieterich, J. H.: Progressive failure on the North Anatolian fault since 1939 by earthquake stress triggering, Geophys. J. Int., 128, 594–604, 1997. a, b
Steketee, J.: Some geophysical applications of the elasticity theory of dislocations, Can. J. Phys., 36, 1168–1198, https://doi.org/10.1139/p58-123, 1958a. a
Steketee, J.: On Volterra's dislocations in a semi-infinite elastic medium, Can. J. Phys., 36, 192–205, https://doi.org/10.1139/p58-024, 1958b. a
Wellman, H.: Rate of horizontal fault displacement in New Zealand, Nature, 237, 275, https://doi.org/10.1038/237275b0, 1972. a
Wells, D. L. and Coppersmith, K. J.: New empirical relationships among magnitude, rupture length, rupture width, rupture area, and surface displacement, B. Seismol. Soc. Am., 84, 974–1002, 1994. a
Wessel, P., Smith, W. H., Scharroo, R., Luis, J., and Wobbe, F.: Generic mapping tools: improved version released, EOS T. Am. Geophys. Un., 94, 409–410, https://doi.org/10.1002/2013EO450001, 2013. a
Worrall, D., Kruglyak, V., Kunst, F., and Kuznetsov, V.: Tertiary tectonics of the Sea of Okhotsk, Russia: Far-field effects of the India-Eurasia collision, Tectonics, 15, 813–826, 1996. a
- Abstract
- Introduction
- Field work and remote sensing data
- Elastic displacement modelling and scarp polarity
- Discussion
- Conclusions
- Code availability
- Data availability
- Appendix A: OSL dating and results
- Appendix B: Radiocarbon dating
- Author contributions
- Competing interests
- Acknowledgements
- References