the Creative Commons Attribution 4.0 License.
the Creative Commons Attribution 4.0 License.
 | 23 May 2019
Joint analysis of the magnetic field and total gradient intensity in central Europe
Maurizio Fedi
J. Derek Fairhead
In the European region, the magnetic field at satellite altitudes (∼350 km) is mainly defined by a long-wavelength magnetic low, called the Central European Magnetic Low (CEML) here, located to the southwest of the Trans-European Suture Zone (TESZ).
We studied this area through a joint analysis of magnetic and total gradient (∇T) anomaly maps for a range of different altitudes of 5, 100 and 350 km. Tests on synthetic models showed the usefulness of the joint analysis at various altitudes to identify reverse dipolar anomalies and to characterize areas in which magnetization is weak. This way we identified areas where either reversely or normally magnetized sources are locally dominant. At a European scale these anomalies are sparse, with a low degree of coalescence effect. The ∇T map indeed presents generally small values within the CEML area, indicating that the Paleozoic Platform is weakly magnetized.
At 350 km of altitude, the TESZ effect is largely dominant: with intense ∇T highs above the East European Craton (EEC) and very small values above the Paleozoic Platform, this again denotes a weakly magnetized crust. Small coalescence effects are masked by the trend of the TESZ.
Although we identified sparsely located reversely magnetized sources in the Paleozoic Platform of the CEML, the joint analysis does not support a model of a generally reversely magnetized crust. Instead, our analysis strongly favors the hypothesis that the CEML anomaly is mainly caused by a sharp contrast between the magnetic properties of the EEC and Paleozoic Platform.
- Article
(29696 KB) - Full-text XML
-
Supplement
(599 KB) - BibTeX
- EndNote


In the last decades, potential field satellite observations have become fundamental in studying the large-scale component of the gravity and magnetic field originating in the Earth's lithosphere. Since the first satellite-derived maps of the European magnetic field were constructed in the 1980s, many researchers have tried to give a reasonable explanation for the extended magnetic low covering most of central Europe (e.g., Ravat et al., 1993; Taylor and Ravat, 1995). This crustal magnetic anomaly is clearly visible on satellite map MF7 (Maus, 2010) (Fig. 1) based on crustal magnetic field measurements at 350 km of altitude collected from the CHAMP satellite mission. At first sight (Fig. 1) the Central European Magnetic Low (CEML) seems to be part of a very large reverse-polarity magnetic anomaly, with its positive located to the northeast of the Trans-European Suture Zone (TESZ) and the weaker low-amplitude negative CEML to the southwest. Previous geological interpretations of the CEML were carried out combining petrologic and geological studies with satellite magnetic field modeling (e.g., Ravat et al., 1993; Taylor and Ravat, 1995; Pucher and Wonik, 1998). They considered the observed magnetic anomaly as a coalescence effect occurring at satellite altitude due to the widespread concentration of magnetic sources with strong reverse magnetization in the upper crust of central Europe. Based on the satellite data alone, the proposed reverse polarity of the TESZ magnetic anomaly is not totally resolved or explained. Recently, Milano et al. (2016) performed a multiscale analysis on a three-dimensional aeromagnetic dataset in central Europe and produced a model of the deep magnetic sources; they found that the origin of the high-altitude magnetic field in central Europe was mainly due to changes in crustal thickness and physical properties between western and eastern Europe. To resolve the situation we have both enhanced the spectral content of magnetic data and applied new analytical methods to the data. These are as follows.
- A.
The crustal satellite-derived magnetic field MF7 has a limited spectral content with λ>350 km. The spectral content has been significantly improved through access to terrestrial magnetic data from the European and Mediterranean Magnetic Project (EMMP; Fletcher et al., 2011) gridded at 1 km, with these allowing for the generation by upward continuation of datasets at 5 and 100 km. At 350 km of altitude, we used the MF7 satellite model dataset instead because of non-negligible edge effects in the 350 km altitude map of the EMMP data.
- B.
The total gradient (∇T) of the magnetic field is applied. Here, the dipolar shape of the magnetic anomalies is replaced by highs that tend to be placed directly over the source location (Nabighian, 1972). This provides a clearer image of the magnetic field over central Europe and better identifies the location of the magnetic sources. Such an analysis will help us to understand how the mechanism of coalescence is related to the CEML anomaly.
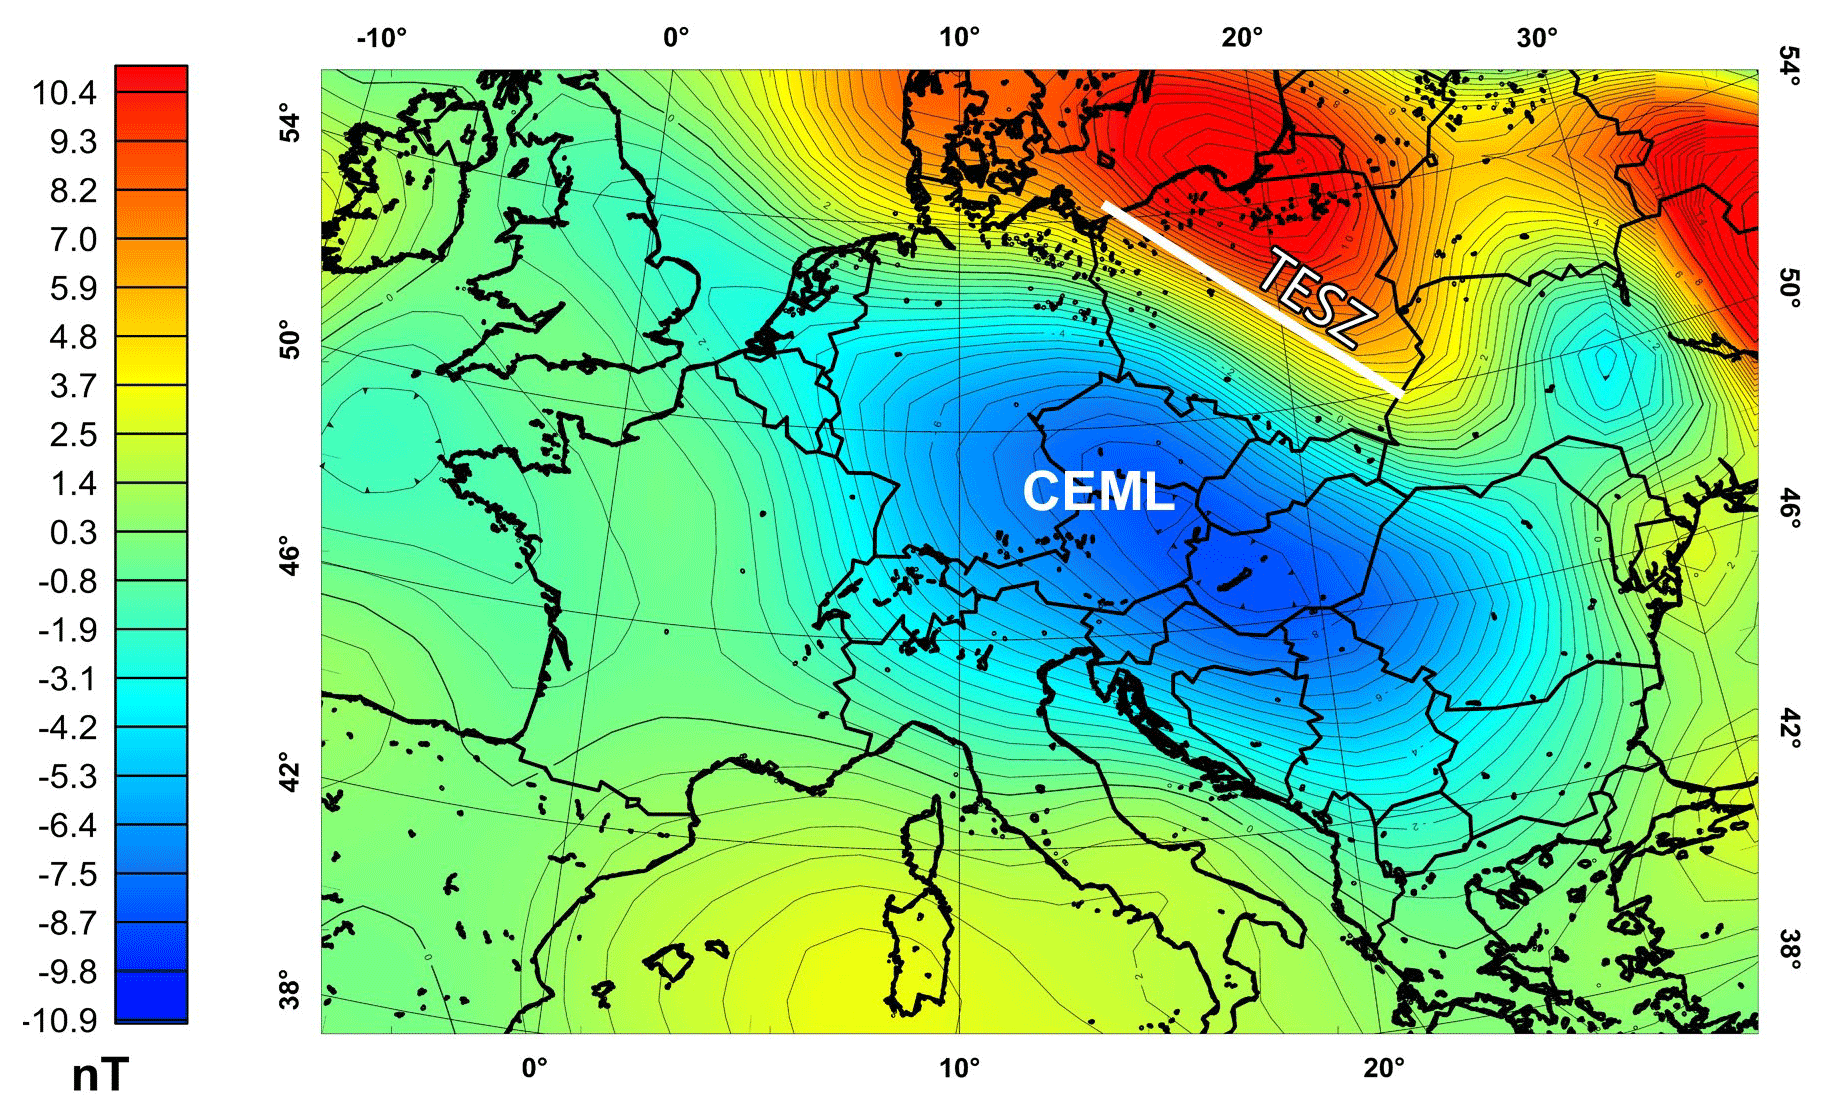
Figure 1MF7 magnetic field model at 350 km of altitude. (CEML: Central European Magnetic Low; TESZ: Trans-European Suture Zone).

Figure 2Tectonic setting of the European continent (redrawn after Blundell et al., 1992; Plant et al., 1998).
The structural framework of the European continent is the result of several geodynamic events that produced a complex “collage” of crustal blocks differing in geological and geophysical properties (Fig. 2). Central Europe formed while the supercontinent Rodinia dismantled from Neoproterozoic events (McCann, 2008), yielding the tectonic structures of the Alpine system, the Carpathians chain, the Pannonian Basin, the Bohemian Massif and the Trans-European Suture Zone (TESZ). The TESZ is the main crustal boundary in central Europe as a result of the movement and juxtaposition between the stable and older northeastern East European Craton (EEC), or Precambrian platform, and the younger southwestern Paleozoic Platform (PP) during the Caledonian and Variscan orogenic events (e.g., Pharaoh, 1999; Thybo, 2001; Banka et al., 2002). The TESZ includes two main structural segments: the Sorgenfrei–Tornquist Zone (STZ) in the northwestern part and the Teisseyre–Tornquist Zone (TTZ) in the southeastern part. It extends from the central North Sea via the Baltic Sea (northwest) to the Black Sea (southeast) (Pharaoh, 1999). In northeastern Europe, the Baltica paleocontinent evolved during several Precambrian episodes of crustal accretion and reworking. It comprises the Fennoscandian and Ukrainian shields and the East European Craton. The EEC extends from Denmark into Russia on the eastern side and includes the segments of Sarmatia, Volgo–Uralia and Fennoscandia, which differ in forming dynamics and lithological and tectonic features (Bogdanova et al., 2006). Generally, the EEC is characterized by a thick and cold crust composed mainly by Precambrian rocks evolved during Archean–Paleoproterozoic episodes of accretion and reworking (Gaàl and Gorbatschev, 1987) and covered by thin series of Phanerozoic rocks (Plant et al., 1998).
The structural setting of the European crust has been modeled thanks to large amounts of seismic and potential field data that allowed for an investigation of the lithosphere down to 60 km of depth (e.g., Guterch et al., 1999; Pharaoh, 1999; Mushayandebvu et al., 2001; Banka et al., 2002; Majorowicz and Wybraniec, 2011). Several seismic reflection surveys, such as BIRPS (UK), CROP (ltaly), DEKORP (Germany), ECORS (France), NFP 20 (Switzerland) and the European Geotraverse (EGT) project aimed at developing a three-dimensional representation of the geological structures and properties of the European lithosphere (Freeman and Mueller, 1990; Blundell et al., 1992; DEKORP Research Group, 1988). Further deep seismic studies were carried out in Europe such as POLONAISE'97, CELEBRATION 2000, ALP 2002 and SUDETES 2003 (Guterch et al., 1999, 2003; Grad et al., 2003; Brückl et al., 2003) in Poland, as well as the KTB deep-drilling surveys in Germany (Gebrande et al., 1989), revealing the strong contrast between the PP, the EEC and the structural features of the TESZ area. Seismic data interpretation revealed that the cratonic part of Europe is characterized by anomalous thickness, wherein the roots may reach a maximum depth of 55–60 km (Artemieva and Meissner, 2012), such as in the Ukrainian, Uralides and Baltic shields. The Variscan terranes in central Europe instead show a uniform crust thickness of around 28–32 km (e.g., EUROBRIDGE Seismic Working Group, 1999; Guterch and Grad, 2006). These variations in crustal thicknesses are shown in Fig. 3a using the Moho depth map of Europe produced by Grad et al. (2009). A clear depth variation is observed in the TESZ area, passing from the thin Paleozoic Platform to the EEC, with a 50 km increase in crustal thickness in southern Sweden, Denmark, the Baltic Sea, Poland and Slovakia (BABEL Working Group, 1993; Giese and Pavlenkova, 1988; Thybo, 1990, 2001; Korja and Heikkinen, 2005; Guterch and Grad, 2006).
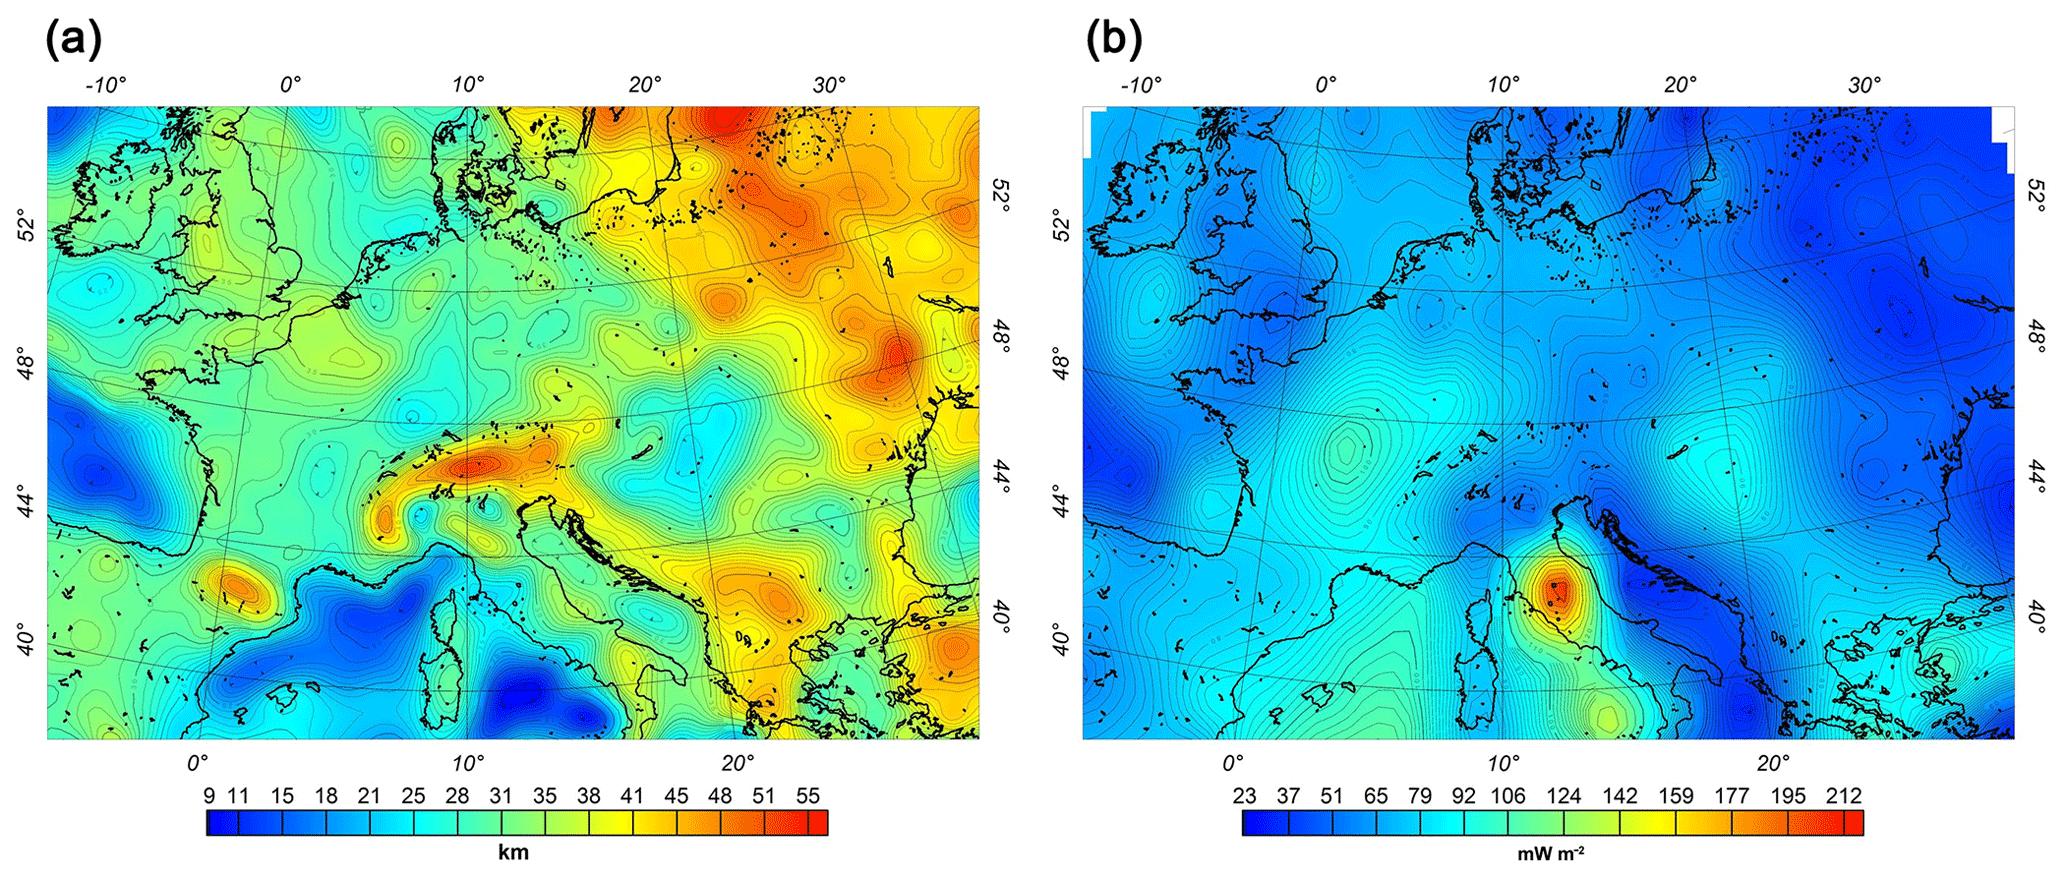
Figure 3(a) Depth to the Moho beneath the European continent (data from Grad et al., 2009). (b) Heat-flow map of Europe (data from Davies, 2013).
Deep-borehole temperature measurements also reveal a strong difference in geothermal properties between western and eastern Europe (e.g., Čermák et al., 1989; Hurting et al., 1992; Plewa, 1998; Królikowski, 2006) as illustrated by the heat-flow map (Fig. 3b). Low regional heat-flow values (30–40 mW m−2) were measured within the Baltic shield (Precambrian platform), which is typical of a thick lithosphere, whereas relatively high heat-flow values were observed in specific areas in depressions of the EEC basement (e.g., Čermák and Rybach, 1979). Central Europe is instead dominated mainly by extended high heat-flow zones trending from east to west (Chiozzi et al., 2005).
Reverse magnetization in central Europe is evidenced by petrological analysis of Permian quartz porphyries beneath the northern German sedimentary basin, containing pyrrhotite–metasedimentary rocks with susceptibility values up to cgs and a Koenigsberger ratio (Q) of about 100 (Henkel, 1994). Further studies of Paleozoic metamorphic rocks revealed reversely magnetized sources in western Germany (Pucher, 1994), and additional analysis of metasedimentary rocks showed a possible overprinting during the Permo-Carboniferous reverse superchron (Thominski et al., 1993).
A satellite magnetic field model (e.g., MF7) has been used successfully to define the crustal magnetic field for wavelengths λ>350 km; however, it is unable to resolve anomalies at shorter wavelengths due to the high altitude of satellite measurements. The CHAMP MF7 crustal field was the best available satellite-derived field at the time of the study (Maus, 2010). Due to the satellite's orbital height the wavelength resolution of this field was ∼150 km. To investigate the nature and cause of the anomaly field associated with the TESZ and CEML, terrestrial magnetic data are needed. This study used the European and Mediterranean Magnetic Project (EMMP) dataset from Getech (Fletcher et al., 2011). The EMMP compilation used all original flight-line data and ground data available from each county. So, the resolution of many surveys allowed an optimum grid to be generated down to 1 km. Technical data concerning these surveys also allowed the International Geomagnetic Reference Field (IGRF) correction to be applied. With any compilation, merging surveys with a range of spatial survey sizes, ages, instruments and processing methods can and did generate small differences, which will not necessarily average out over the compilation. Since the EMMP compilation generally lacked long-wavelength control (i.e., km) due to the limited size of surveys, the final processing step, after gridding at 1 km, was to drape it onto the CHAMP's MF7 crustal field.
As indicated in the Introduction, the CEML has been previously interpreted on the basis of satellite-altitude magnetic field data as the result of coalescence between small-scale magnetic anomalies, with mainly reverse polarization. We performed analyses at different altitudes (100–350 km) to identify the contributions of the various magnetic sources to the CEML at different scales. The maps at these altitudes were produced with the upward continuation technique, a standard procedure to transform field data measured at a given altitude to a higher level. The transformation consists of a convolution, which may be performed in the Fourier domain (Baranov, 1975; Fedi et al., 2012). We first filled small areas of no data with a maximum entropy interpolation (Gibert and Galdeano, 1985) and then performed a draped-to-level upward continuation to a 5 km altitude level using the wavelet-based algorithm by Ridsdill-Smith (2000) and the digital elevation model SRTM30 (Farr et al., 2007) (Fig. 4a). Then, we performed a level-to-level upward continuation using the classical convolution integral:
where is the potential field upward continued to the scale z, is the potential field at level z=0 and is the upward continuation operator. In Fig. 4b we show the map of the upward continuation magnetic field at 100 and 350 km of altitude. Note that, in principle, Eq. (1) is applicable to fields known continuously on the entire flat surface. Our data instead comprise discrete datasets containing equally spaced data distributed on a finite surface. However, as shown in Fedi et al. (2009), accurate upward continuation may be computed if the data are known on a surface larger than the area of interest and/or by extrapolating data beyond their borders with a suitable algorithm. Upward continuation of data may indeed produce a border (or edge) effect near the grid margins due to space-domain aliasing (Oppenheim and Schafer, 1975; Fedi et al., 2012; Mastellone et al., 2014). To reduce this effect, upward continuation has been performed by extrapolating the aeromagnetic dataset onto a larger area using a maximum entropy algorithm.
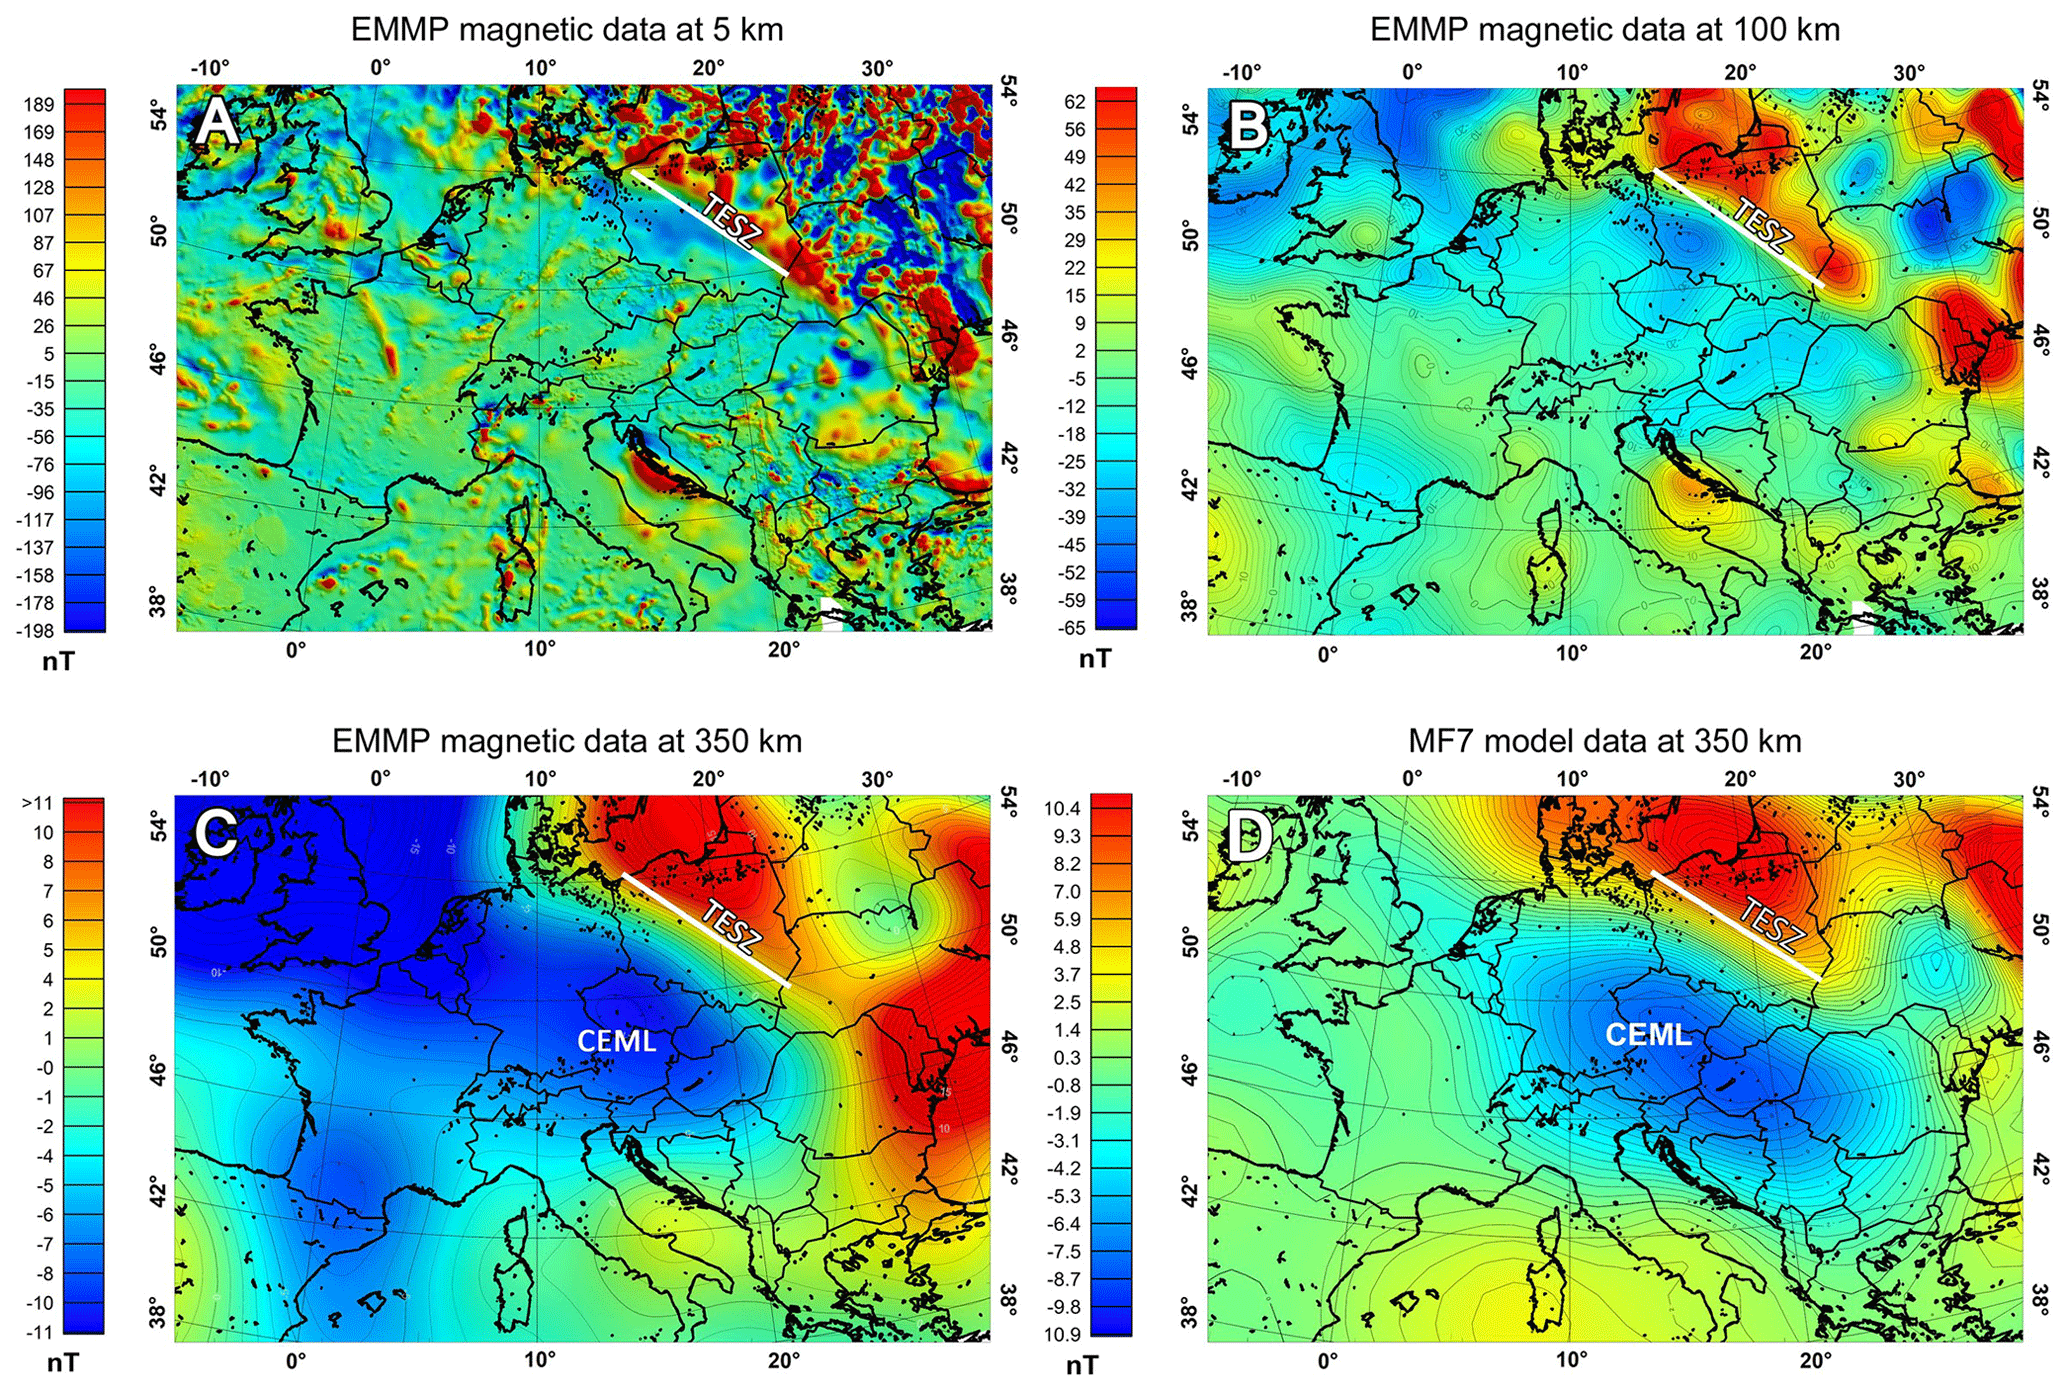
Figure 4Aeromagnetic field map of Europe at 5 km (a), 100 km (b) and 350 km of altitude (c); map of MF7 magnetic field model at 350 km of altitude (d).
Furthermore, it may be useful to calculate the extent ΔL of the upward continuation operator in order to estimate the portion of the map that may be mostly affected by the border effect. We may simply map the operator at different altitudes and evaluate ΔL from its half-width. We define ΔL as the distance occurring from the maximum to the point at which it is decreased by a factor 1∕e, with e being the Neper number. Thus, we estimated ΔL=96 km at 100 km of altitude, which means that, using ΔL, we may be rather confident in the upward-continued field computed at 100 km of altitude over most of the European continent, excluding a border defined by ΔL. At 350 km of altitude, the border effect is significantly greater with ΔL=347 km, as is the discrepancy with the MF7 model map (Fig. 4c). Therefore, the total gradient analysis at satellite altitude is performed on the map of the MF7 magnetic data at 350 km (Fig. 4d). The European magnetic field map at 5 km of altitude is mostly characterized by short-wavelength anomalies. The first and most important feature of the map is the visible contrast in the distribution and intensity of the anomalies located over the Paleozoic and EEC regions. As revealed by seismic modeling, the TESZ is a sharp geological–tectonic boundary here, which controls the main regional trend of the magnetic field. It suggests a very sharp change in the crust's magnetic properties in addition to geological, compositional and geothermal differences. The anomalies associated with the TESZ define the most important magnetic anomaly zone of central Europe and relate to sources involving the whole crust. The TESZ magnetic anomaly is especially visible in Poland and Romania, and it divides these countries into two opposite magnetic provinces: the southwestern area, almost covered by magnetic lows, and the northeastern region, characterized by numerous magnetic highs. Actually, this anomaly trend may be extended over the European continent, identifying the TESZ as the margin between these two opposite magnetic behaviors (Banka et al., 2002; Williamson et al., 2002; Fairhead, 2015). Such magnetic behavior is imaged even more clearly at 100 km of altitude, at which the map shows a considerably smoothed magnetic field when compared to that at 5 km. Here, the strong difference between the EEC and Paleozoic crusts is well appreciable by the development of an extended magnetic low in central Europe in contrast with an area of magnetic highs to the NE, anticipating the formation of the reverse dipolar anomaly above the TESZ structure and the CEML at 350 km of altitude (Fig. 4c). Following Ravat et al. (1993) the origin of the CEML could be associated with the considerable difference in crustal thickness and heat flow between the EEC and Paleozoic platforms. Taylor and Ravat (1995), however, carried out an alternative interpretation based on the predominance of remanent magnetization within the Paleozoic crust. Their sketched model consists of two prismatic blocks representing, respectively, the reversely magnetized Paleozoic Platform and the normally magnetized Precambrian crust. Therefore, the main origin of the CEML was assigned to a pattern of relatively small reversely magnetized sources in the upper–middle crust of the Paleozoic Platform, coalescing at satellite altitude and forming the extended long-wavelength magnetic low. Pucher and Wonik (1998) proposed a further interpretation based on reversely magnetized sources in the Paleozoic crust and on the magnetic properties of central Europe, while the EEC was not considered to contribute to CEML formation. The effect of coalescence between short-scale anomalies, shared by these magnetic models of central Europe, could be verified if we simultaneously compare the field map at small and large altitudes.
The dipolar shape of the magnetic field anomalies represents a troublesome limitation in the study and the identification of the magnetic sources due to the non-vertical direction of total magnetization and the inducing field. This issue may be overcome by employing methods able to remove the dipolar behavior of the field almost completely and provide maps of anomalies more directly related to the source position. One such method is the total gradient technique.
The total gradient modulus of the magnetic field T (|∇T|) is defined as
where , and are the partial derivatives of the total magnetic field (T) with respect to the directions x, y and z.
The total gradient anomalies have two important features:
-
they are located directly over the source bodies and may help localize the sources edges (e.g., Roest et al., 1992; MacLeod, 1993; Roest and Pilkington, 1993; Salem et al., 2002; Shearer and Li, 2004; Florio et al., 2011; Paoletti et al., 2016); and
-
they are positive anomalies, no matter whether the magnetization is direct or reverse. In fact, |∇T| is completely independent of the directions of both the inducing field and total magnetization in the 2-D case (Nabighian, 1972) and only weakly dependent on the directions of T in the 3-D case (Haney et al., 2003). Salem et al. (2002) pointed out that, in the 3-D case, a maximum shift for inclination (I) of 30∘ does not cause appreciable changes in the total gradient amplitudes.
In this paper we specifically perform a joint analysis of total gradient and magnetic field anomalies to identify the presence of sources with a strong remanent component of magnetization and to interpret whether large-scale magnetic anomalies can be produced by the coalescence effect. To clarify the problem, we consider a synthetic model composed of three magnetic sources with top depth at 1 km and bottom depth at 5 km: B1 and B2 have normal magnetization (∘, DF=3∘), while B3 is reversely magnetized with ∘ and D=230∘ (Fig. 5), where IF and DF indicate the direction of the inducing field, and I and D indicate those of the total magnetization. These parameters were chosen according to the results of the paleomagnetic analysis in central Europe carried out by Pucher (1994) and that were used to interpret the regional magnetic field over Europe by Pucher and Wonik (1998). The map of the magnetic field (T) at 10 km of altitude (Fig. 5a) shows two dipolar anomalies, B1 and B2, with their magnetic lows and highs located to the NE and SW, respectively. The source B3, in contrast, is not clearly identified, since its magnetic effect is covered by the anomalies produced by B1 and B2. The presence of an anomaly due to B3 could perhaps be identified by the slight prolongation of the magnetic high of B2 towards the location of B3 and a by weak increase in the intensity of the magnetic low of B1 to the SW. This example shows that the presence of a reversely magnetized source in a complex magnetic environment is hard to identify and isolate from the map of the magnetic field. The total gradient intensity map of the magnetic field (Fig. 5b) transforms the dipolar shape of the magnetic anomalies into high-amplitude monopole-shaped anomalies, which now provide detailed information on the source locations. The reversely magnetized source B3 is now clearly imaged and distinguished from the other sources. Note that in the map of the magnetic field the field lows (blue) stand for the lows of the dipolar magnetic anomalies, while in the total gradient intensity map the smallest values are around zero and, most importantly, denote the areas in which magnetization is very weak. So, the total gradient intensity highs yield an easy and effective tool to indicate the relative presence or absence of magnetized sources and the location of the sources, even in the case of strong remanent magnetization. We will use both these properties to analyze the magnetic field in Europe.
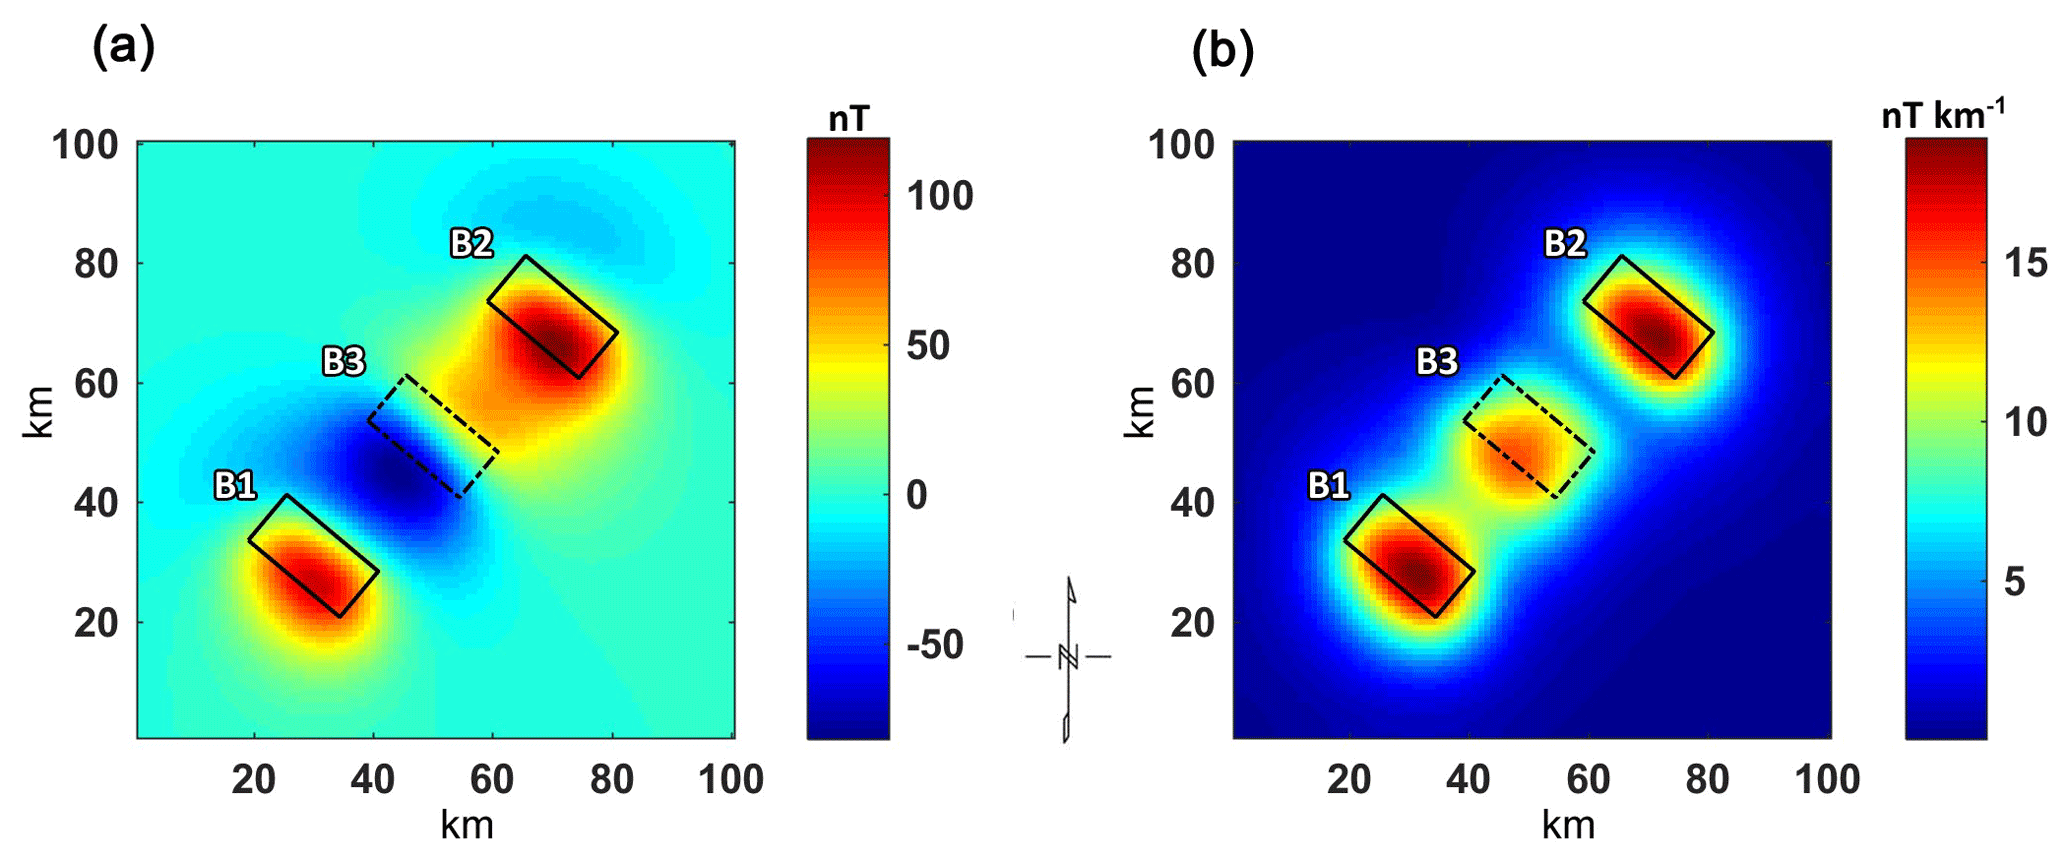
Figure 5Multisource model with B1 and B2 normally magnetized and B3 reversely magnetized. (a) T map; (b) |∇T| map.
As previously indicated, the two main hypotheses put forward to explain the CEML anomaly are the following:
- A.
a pattern of reversely magnetized sources in the upper–middle crust of the Paleozoic Platform, coalescing at satellite altitude; and
- B.
geological contact between a thick magnetized crust (EEC) and a thin low-susceptibility crust (central Europe) with high heat flow.
In order to evaluate these hypotheses, we will now consider two synthetic cases. The first is related to hypothesis A. To this end, we produced a new model with 19 prismatic sources with depths ranging between 2 and 10 km of depth to simulate the magnetic crust of central Europe in a reversely magnetized environment. The magnetization intensity ranged between 1.5 and 2.5 A m−1, and the direction of magnetization was the same as that of the reversely magnetized body B3 in Fig. 5. The inducing field parameters were declination 3∘ and inclination 65∘. The magnetic field and total gradient intensity maps were calculated at 1, 100 and 350 km of altitude (Fig. 6). At small altitudes, the short-wavelength anomalies clearly identify the location of the sources both in the T and |∇T| maps. At 100 km of altitude the magnetic field is considerably smoothed, and the coalescence between the magnetic anomalies begins to be relevant. However, at such altitudes it is extremely difficult to identify the source location from the T map.

Figure 6Synthetic model of the multiple shallow sources reversely magnetized. The magnetic field (T) and total gradient |∇T| maps are shown at 1 km (a), 100 km (b) and 350 km (c) altitudes.
On the other hand, the total gradient intensity map allows for the recognition of the location of the magnetic sources, especially those with higher magnetization that produce stronger anomalies at large altitudes. Note that, similarly to the previous model, the magnetic lows in T are mostly substituted by peaks of |∇T| highs, again demonstrating the ability of the total gradient technique to estimate the presence of reversely magnetized sources.
In Fig. 6c the magnetic field at 350 km of altitude is characterized by a large reverse dipolar anomaly. The intensity of such a magnetic anomaly is very weak, meaning that shallow sources have a very low contribution at satellite altitudes, which could be completely negligible in the presence of additional deeper sources. Here the total gradient intensity map shows a large-amplitude high located in proximity to the magnetic low in the southwestern region and suggests the presence of highly magnetized bodies. These results show that, in the case of the coalescence effect, we can even identify areas of strong magnetization by the total gradient intensity regardless of the direction of magnetization.
The second hypothesis B is analyzed by building a new synthetic model of the magnetic crust in order to simulate the magnetic anomaly above the TESZ. We consider two adjacent prismatic bodies representing the Paleozoic and the EEC with crustal thickness of 30 and 40 km, according to a seismic model (e.g., Guterch and Grad, 2006), and induced only magnetization of 1 and 2 A m−1, respectively. Thus, we assume no remanent magnetization for both the sources. The magnetic field and the total gradient intensity calculated at 350 km of altitude are shown in Fig. 7. The map of the magnetic field shows a reverse dipolar magnetic anomaly with a magnetic high above the synthetic red body (Precambrian crust) and a related magnetic low to the SW, for example above the Paleozoic Platform (blue body) (Fig. 7a). The |∇T| map, in contrast, has highs located roughly along the contact surface (Fig. 7b) and a wide gradient zone extending toward central Europe. One more synthetic model was computed considering the same structural setting but assuming the same magnetization of 2 A m−1 for both the prismatic bodies. Therefore, the produced magnetic field is exclusively generated by the difference in thickness between western and eastern Europe. The results are shown in the Supplement. The magnetic field map at 350 km (Fig. S1a in the Supplement) shows a very low-intensity anomaly, this time related to only the variation from the thin southwestern crust to the thicker one to the northeast. Such a structure is also imaged in the total gradient map (Fig. S1b) by an extended maximum amplitude along the contact line.
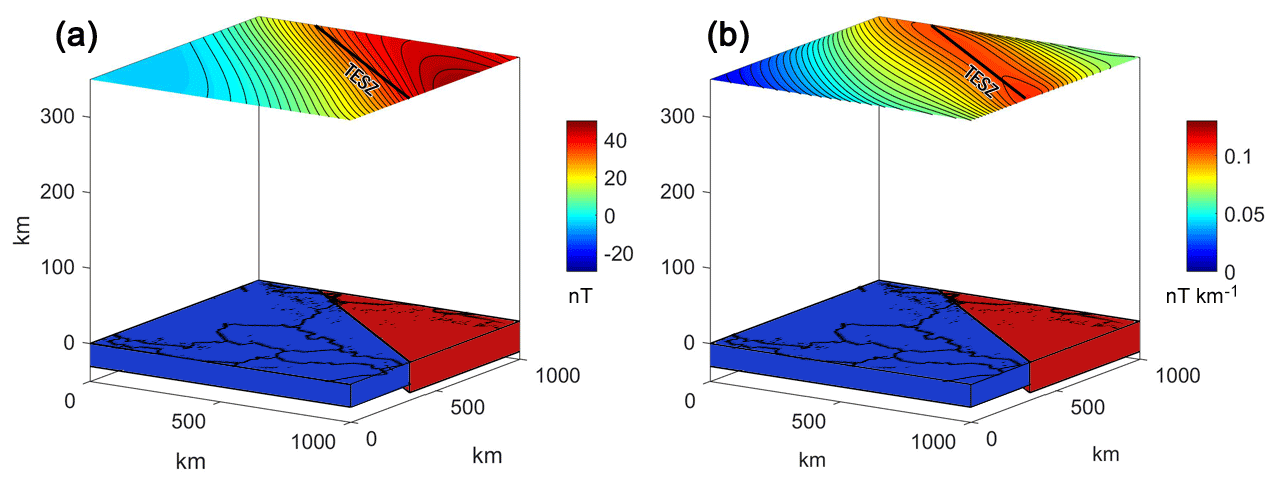
Figure 7Contact-like 3-D model of central Europe and related magnetic field (a) and total gradient intensity (b) at 350 km of altitude. This model refers to hypothesis B described in this paper, wherein the main magnetic source is a magnetic contact between the Paleozoic Platform (blue body) and the Precambrian platform (red body).
Therefore, the case of two magnetized crusts differing exclusively in structural features may contribute to the magnetic field but cannot completely explain such a magnetic anomaly. The combination of both structural and magnetic property differences seems to be the best hypothesis to explain the observed magnetic field above Europe.
Intermediate models that consider the magnetic features of both models A and B can also occur. In the next section we will analyze the field and its total gradient intensity by taking into account the results of our synthetic source distributions.
We computed the total gradient intensity maps of Europe through upward continuation of the aeromagnetic dataset for Europe from 5 to 100 km and for the MF7 model data at 350 km of altitude. As discussed previously the simultaneous analysis of the total gradient intensity maps at different altitudes allows for a detailed evaluation of the magnetic properties of the area because it can effectively outline the following: (a) the relative presence or absence of magnetized sources; (b) the location of sources with a strong remanent component of magnetization; and (c) the occurrence of coalescence at large altitudes. The interpretation of the regional magnetic field is indeed improved if the contributions of the shallow sources can be identified in the low-altitude map. We show the maps of the total gradient intensity at 5, 100 and 350 km of altitude in Fig. 8a, b and c, respectively. The lineaments of the main tectonic structures (from Blundell et al., 1992) are shown with white lines.
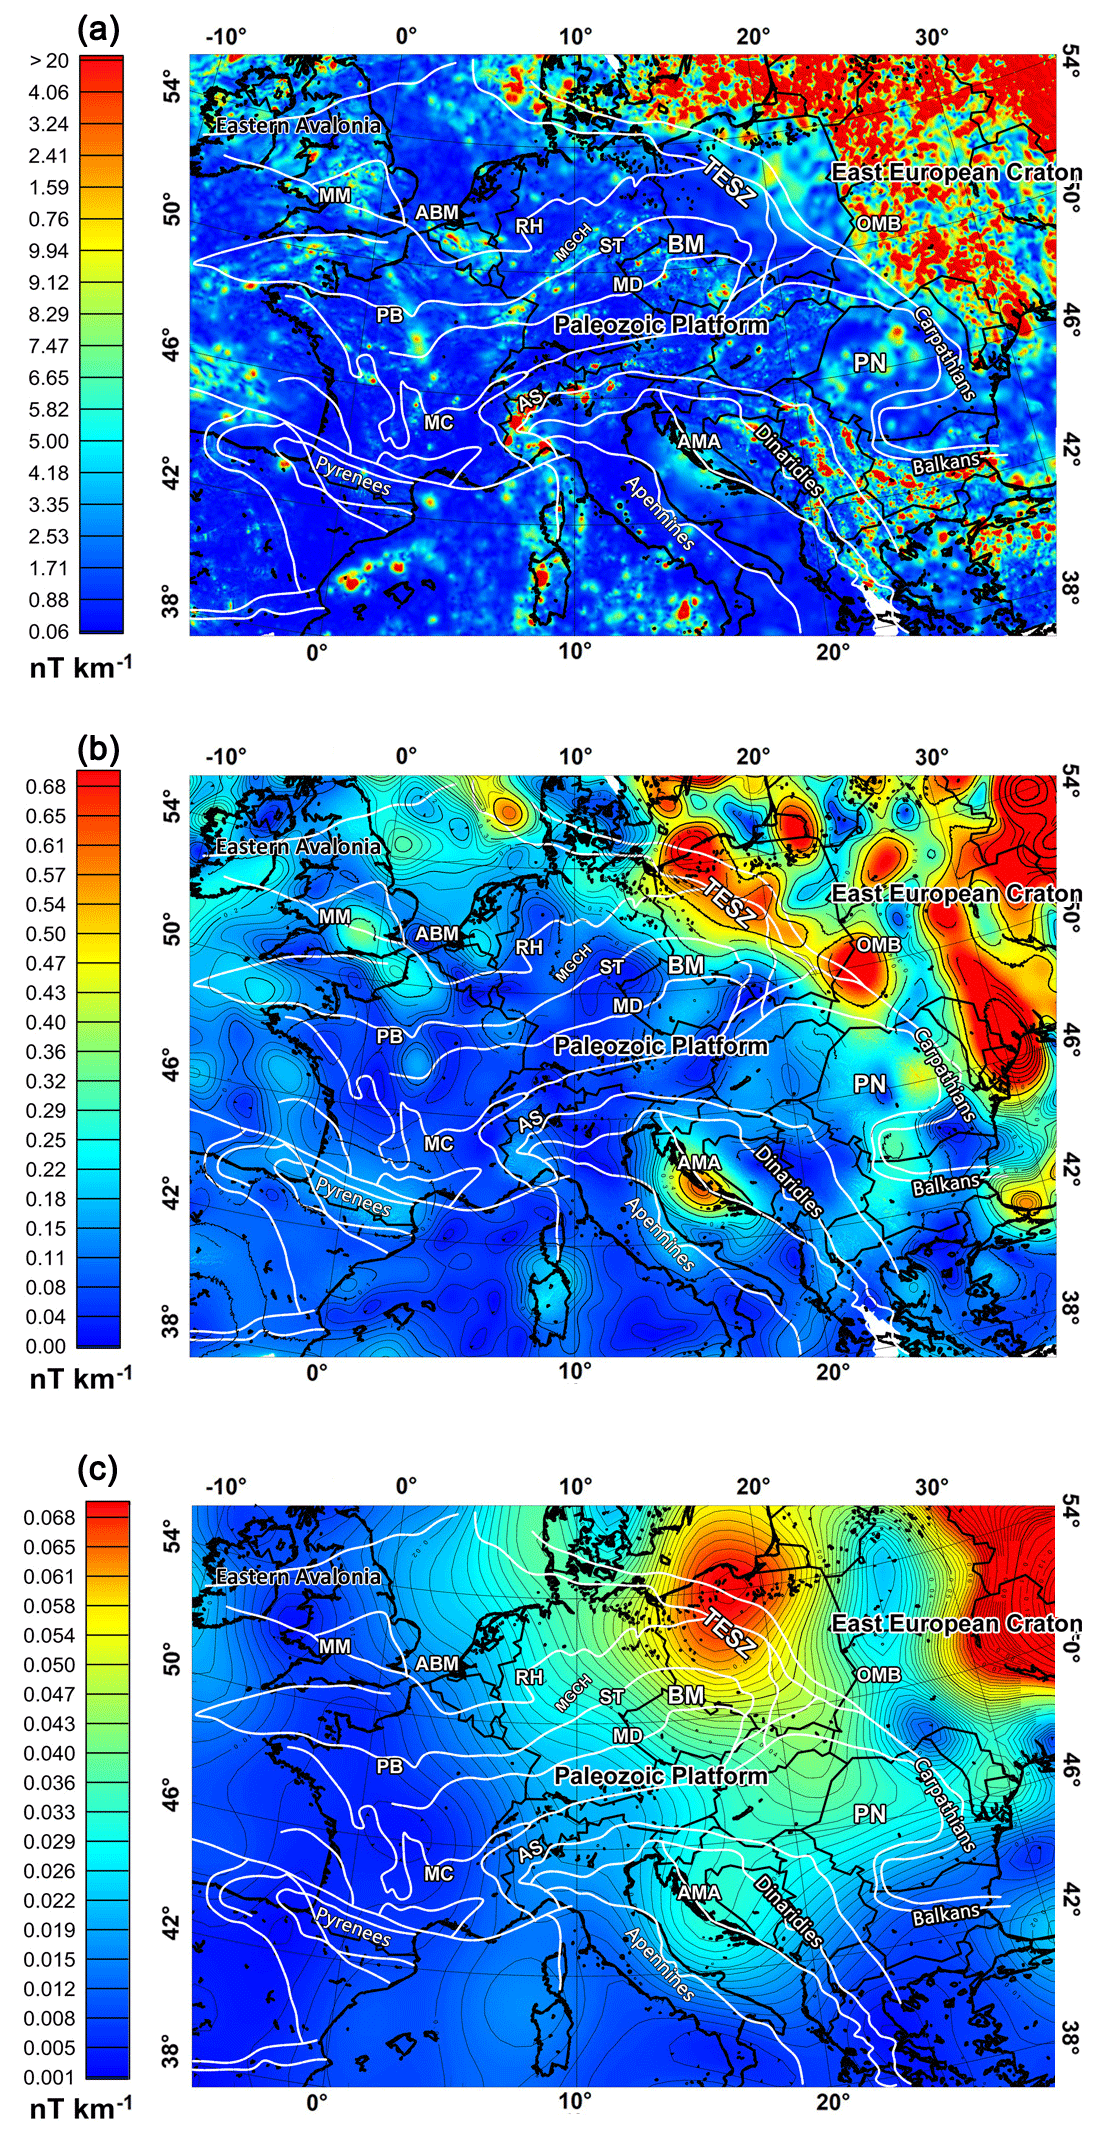
Figure 8Total gradient intensity maps of the aeromagnetic dataset at 5 km (a) and 100 km of altitude (b); total gradient map of the MF7 magnetic field model at 350 km of altitude (c). White lines represent the main tectonic structures (from Blundell et al., 1992). ABM: Anglo-Brabant Massif; AMA: Adriatic magnetic anomaly; AS: Alpine system; BM: Bohemian Massif; MC: Massif Central; MD: Moldanubian zone; MGCH: Mid-German Crystalline High; MM: Midlands Microcraton; OMB: Osnitsk–Mikashevichi Igneous Belt; PB: Paris Basin; PN: Pannonian Basin.
5.1 Magnetic field at 5 km
The low-altitude |∇T| map gives an interesting representation of the main magnetic provinces of the European crust. The northeastern part of Europe, including the East European Craton (EEC) and the thick crust of the Baltic shield, is mostly defined by short-wavelength and well-defined anomalies. The intense distribution of the |∇T| highs suggests a strong magnetization of the Precambrian upper crust. In central Europe, |∇T| highs above Poland highlight the different granitoid massifs of Pomerania, Mazovia and Dobrzyé (Grabowska and Bojdys, 2001; McCann, 2008), as well as structural lineaments with the WNW–ESE trend of the Polish Lithuanian terranes and NNE trend of the eastern Lithuanian belt structures, while rounded and well-defined anomalies above the OMB (Osnitsk–Mikashevichi Igneous Belt) are associated with batholiths and diorite–gabbro intrusions (Bogdanova et al., 2006). In northern Europe, total gradient anomalies are associated with the Caledonian basement and deep relicts of the Scandinavian crust formed during the collision between Baltica and Avalonia. In central Variscan Europe, in contrast, several |∇T| highs are well displayed over Germany, marking the boundaries of the Caledonian basement to the NW, the Rheno-Hercynian zone in the central area, and the Moldanubian zone and Alpine system to the SE (Gabriel et al., 2011). The |∇T| highs also define the magnetic sources forming the Mid-German Crystalline High (MGCH) and the granitoids and metamorphic rocks of the Saxothuringian unit (ST). In the Rheno-Hercynian unit we also find total gradient intensity highs located above young magmatic regions (Gabriel et al., 2011), such as the Soest magnetic anomalies, characterized by sets of reversely magnetized sources. In the Moldanubian zone some magnetic evidence occurs southwards to the MD margin, coinciding with the Donau Line, a prolongation of the northern part of the Massif Central (Bosum and Wonik, 1991). In the eastern parts of Germany and the Czech Republic total gradient intensity highs are located over the Bohemian Massif (BM), representing the eastern side of the Variscan belt, a Paleozoic chain extending from the Iberic to Bohemian complexes in central Europe (Tomek et al., 1997). In western Europe, strong |∇T| highs occur above the Midlands Microcraton (MM) in southern England and continue down to the North Sea and Brabant Massif (BM), showing a very different magnetic environment with respect to the close Rheno-Hercynian zone to the east. The magnetic anomalies of MM are mainly related to the outcrop of the Neoproterozoic basement and to local Carboniferous intrusions (Banka et al., 2002; Pharaoh and Gibbons, 1994). In eastern England patterns of small magnetic anomalies are associated with calcalkaline magmatic rocks and the southern metasedimentary rocks of the Brabant Massif in northern Belgium (Pharaoh et al., 1993; De Vos et al., 1993). The Paris Basin (PB) magnetic anomaly is the main magnetic feature of western Europe, extending for 400 km from central France to the English Channel with a S–NE linear trending. In southern Europe strong |∇T| highs occur above the Alpine system, associated with ophiolitic rocks and with a broad distortion of the lower crust, and above the continental margins of the Tyrrhenian Sea, related to crustal fractures of deep geodynamic events (Rehault et al., 1987). They also occur in the Balkan region and the Carpathians mountain chain, where short-wavelength anomalies are mainly associated with magmatic rocks formed during several volcanic events of different ages, while smoothed anomalies extending to the north have origins in the magnetic basement beneath the Bulgarian foreland (Trifonova et al., 2009). In the Romanian region, the main magnetic contribution is associated with the Neogene–Quaternary volcanism beneath the Pannonian Basin (PN) (Boccaletti et al., 1976), a back-arc basin formed during the complex evolution of the Carpathians–Alpine system (Horváth, 1993). Following Kis et al. (2011), in the Pannonian Basin xenolith and peridotite rocks formed in the deep crust–upper mantle and were carried up into the shallow crust.
5.2 Magnetic field at 100 km
At 100 km of altitude (Fig. 8b) we observe mainly long-wavelength anomalies, whereas small-scale anomalies tend to vanish or to coalesce. Here, a strong difference between the EEC and Paleozoic platforms occurs clearly because of the intense |∇T| highs covering most of the EEC and the substantially non-magnetic behavior of the Paleozoic Platform characterized by a few sparse, weak and isolated anomalies. Huge |∇T| highs are located above the TESZ region, which, according to Milano et al. (2016), suggests the TESZ as a magnetic structure involving the whole crust down to the deep lithosphere. This picture seems to favor hypothesis B as the main cause of the CEML. In fact, the |∇T| map clearly shows that the weak and sparse nature of the magnetization in central Europe is not able to characterize the anomaly field at large altitudes through the mechanism of coalescence.
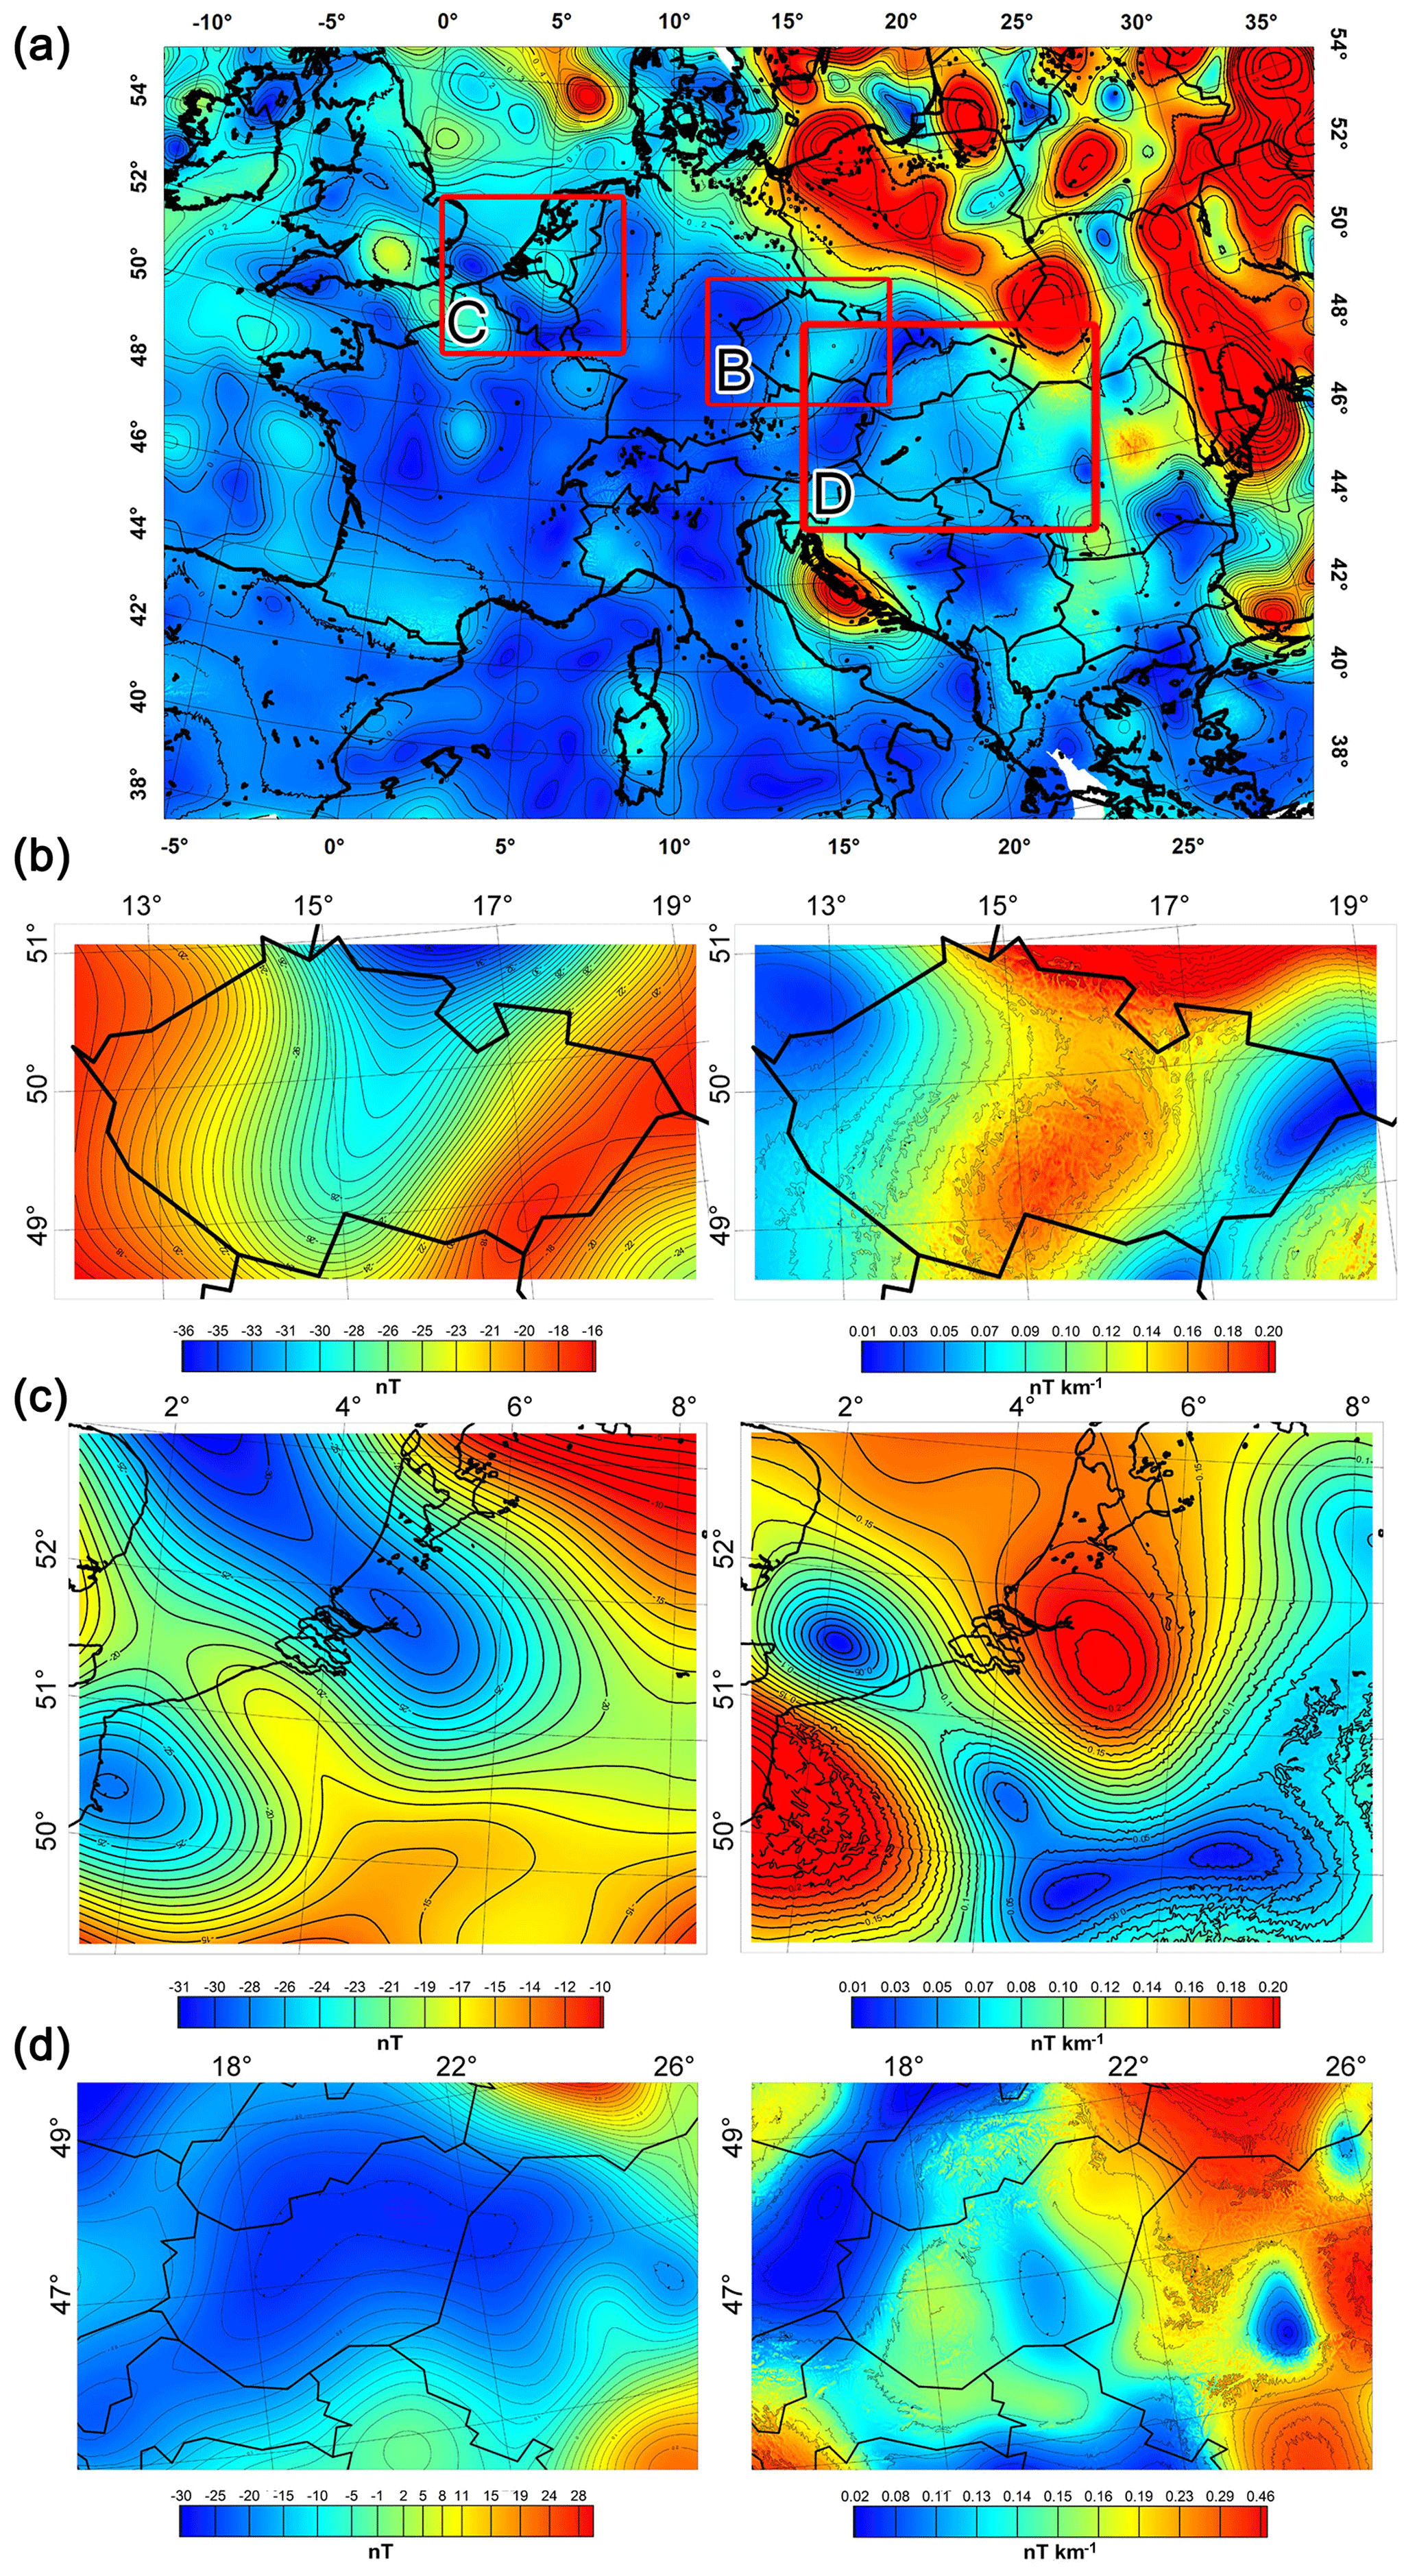
Figure 9Joint interpretation of magnetic and total gradient anomalies in central Europe (a) over the Bohemian Massif (b), the Anglo-Brabant Massif (c) and the Pannonian Basin (d).
However, a coalescence effect can supply an additional contribution to the large-scale magnetic field. Apart from the TESZ, the most noticeable |∇T| high is observed above the Adriatic region, also recognizable in the magnetic field map as the Adriatic magnetic anomaly (AMA). However, in central Europe we can distinguish some slight and isolated |∇T| highs, especially above eastern Germany, the central Czech Republic and southeastern Europe. Rounded and separated highs are also recognized in southern England and Belgium. Comparing the maps of |∇T| at 5 and 100 km, these highs are likely to be produced by coalescence between small-scale anomalies. We indeed observe that most of such |∇T| highs, such as those above PN, BM and ABM, represent the long-wavelength component of sharp and well-defined anomaly patterns that merge with each other at high altitudes, forming a regional-scale magnetic signal. In Fig. 9 we jointly analyze the magnetic and total gradient anomalies in specific areas of central Europe (red boxes in Fig. 9a) in localized regions where reverse magnetization is dominant. In the area of the Bohemian Massif (Fig. 9b) we immediately note that the magnetic field map above BM shows a wide magnetic low (left) in correspondence to the high of the total gradient intensity (right). This feature is interesting because, as discussed above, a reverse magnetization area can be easily identified when the magnetic low of a reverse T anomaly is replaced by a |∇T| high (see Fig. 5). We may so conclude that the joint analysis of T and |∇T| suggests the presence of reversely magnetized sources above BM, even though paleomagnetic analysis did not reveal a significant reverse magnetization here.
In Fig. 9c, we performed the same type of joint analysis in the area of the Brabant Massif, Namur Basin and Ardennes Massif. Magnetic and paleomagnetic studies (e.g., Molina Garza and Zijderveld, 1996) have pointed out Paleozoic carbonate rocks in Belgium characterized by uniform reverse polarity as a consequence of regional remagnetization events that occurred during tectonic and orogenic activity at late Carboniferous times. In the magnetic field map, we observe two intense magnetic lows, with no clear presence of their relative highs, which transform to two highs in the |∇T| map. These results, combined with the paleomagnetic information, allow for an interpretation of these sources as characterized by a strong remanent component of magnetization. Further paleomagnetic studies were carried out in central Europe by Pucher (1994), wherein an analysis of magnetic anomalies in Germany and Belgium pointed out pyrrhotite as the main carrier of remanent magnetization, and a similar magnetic feature was expected in other Paleozoic rocks in central Europe. Other studies have been carried out by Zegers et al. (2003) on Permian remagnetization of Devonian limestones in northern France and Belgium.
The third area considered is the Pannonian Basin (Fig. 9d), which formed contemporary to the Tertiary evolution of the Carpathians and the Eastern Alps, based on SW-to-W-dipping subduction (Bielik et al., 2004). Here an extended magnetic low, visible up to satellite altitudes, lies over Slovakia and Hungary (Fig. 9d, left). Magnetic anomaly modeling was carried out in this area (Taylor et al., 2005; Kis at al., 2011) using magnetic field measurements of the CHAMP satellite. In their model the authors assume a strong remanent magnetization for the source according to exsolution of the hematite–ilmenite minerals found in the upper crust of the Pannonian Basin. Looking at the total gradient intensity map (Fig. 9d, right) we again find a good correlation between the magnetic low anomaly and the high in the |∇T| map.
We conclude that, besides the evidence of a strong contrast in magnetization between SW and NE European regions (hypothesis B), the presence of specific areas where remanent magnetization is dominant represents an additional contribution to the CEML anomaly at 100 km of altitude.
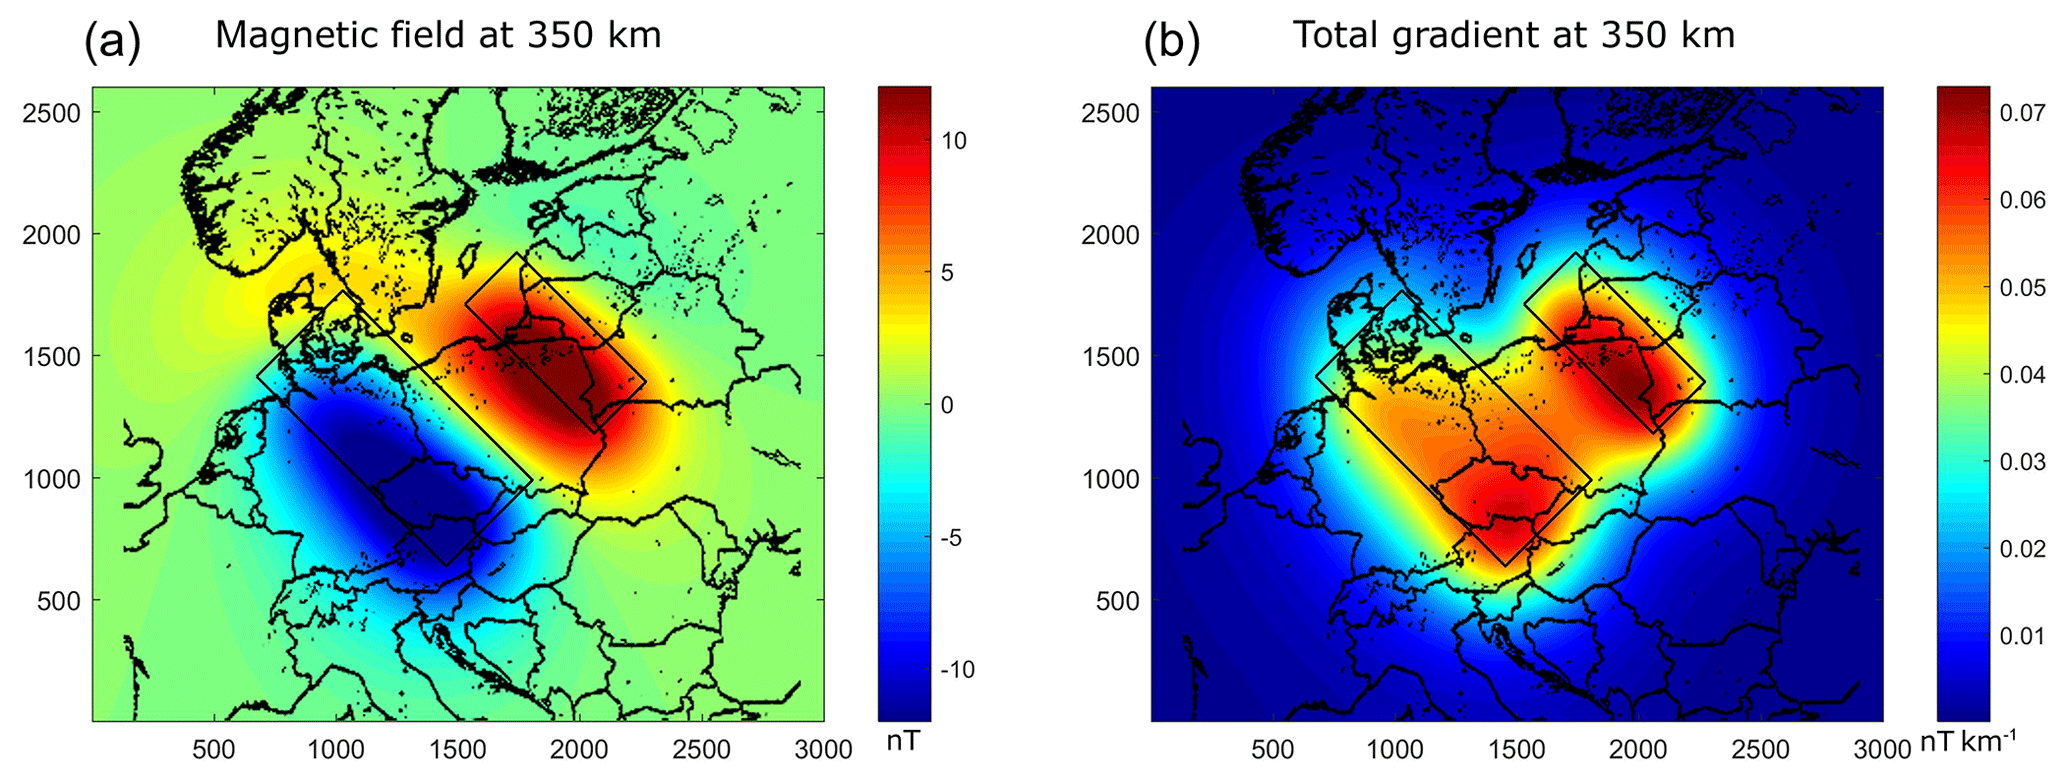
Figure 10Magnetic field (a) and total gradient intensity (b) from a synthetic model of central Europe in agreement with Taylor and Ravat (1995). This model refers to hypothesis A described in this paper. Reverse magnetization is assigned to central European crust and normal magnetization to the Precambrian platform. The magnetic field anomaly is computed at 350 km of altitude (a). The total gradient intensity map (b) shows two highs above both the synthetic bodies.
5.3 Magnetic field at 350 km
At 350 km, small-scale structures can no longer be identified, since their signal vanishes at such a great distance. The total gradient intensity map, indeed, reveals long-wavelength anomalies covering most of central Europe. Moreover, the |∇T| high is now located along the TESZ region. In southeastern Europe, weak highs appear as a consequence of the partial coalescence between the TESZ anomaly and the Adriatic anomaly, which still represent the main appreciable magnetic contribution of southern Europe at satellite altitude. On the Paleozoic Platform, the coalescence effects observed at 100 km of altitude (Fig. 9) are essentially dissolved. The |∇T| map, indeed, shows a large gradient zone starting from the high amplitudes above the TESZ and prolonging toward eastern France, similarly to the total gradient intensity of the synthetic model in Fig. 7b. Hypothesis A, based on the coalescence of anomalies due to reverse magnetization at satellite altitudes, should have its counterpart in |∇T| highs in central Europe according to the synthetic case described in Fig. 6. But |∇T| is characterized there by negligible values, indicating that the dominant phenomenon is the presence of weak magnetization. This may be further verified by testing the models by Taylor and Ravat (1995) and Pucher and Wonik (1998). The results of the synthetic test are shown in Fig. 10 where we considered the same magnetic bodies of Taylor and Ravat (1995) (see their Fig. 6). Normal magnetization is assigned to the magnetic source to the northeast, while the body in central Europe is considered mostly reversely magnetized as a result of the coalescence effect of upper–middle crust sources. The magnetic field calculated at 350 km of altitude shows a clear and intense reverse magnetic anomaly along the TESZ structure. The map of the total gradient shows two strong maxima taking place above both central Europe and the EEC, once again revealing its ability to discriminate the effect of magnetic sources. Looking at this test and at the “contact” test shown in Fig. 7, the joint analysis of the maps of the magnetic field (Fig. 4c) and of the total gradient intensity (Fig. 8c) leads us to conclude that hypothesis B is the most reliable to describe the CEML anomaly.
In this study we performed a step-by-step analysis of the European magnetic field from low to high altitudes, aiming at explaining the regional-scale magnetic anomaly occurring in central Europe. Previous interpretations were only conducted on a regional scale at high satellite altitudes (for example, 350 km) or on a local scale at low altitudes (a few kilometers).
In this study, we performed a comparative analysis of the magnetic field and of its total gradient intensity at 5, 100 and 350 km of altitude. The joint analysis of |∇T| and T was revealed to be a fundamental tool to identify areas characterized by a weakly magnetized crust and to recognize the presence of reversely magnetized sources. This task cannot be fulfilled by analyzing the aeromagnetic field alone due to the dipolar nature of the total magnetic field. The independence of the total gradient modulus from the directions of the inducing magnetic field and the total magnetization vector clearly appears from the result of a simple test involving both normally and reversely magnetized sources. We found that the sources are clearly marked by highs of the total gradient intensity, while the magnetic field map does not provide similar details due to the complex merging of the lows and highs of several anomalies.
At large altitudes the long-wavelength magnetic anomalies are mainly related to the continental-scale magnetic properties of the crust. At 100 km of altitude, the highs of the total gradient modulus of the aeromagnetic field delineate the TESZ fault line well, marking out a magnetic boundary between two regions, which we interpreted as a contact area between the strongly magnetized middle–lower crust of the EEC (to the NE) and the weakly magnetized Paleozoic Platform (to the SW). In particular, the total gradient intensity map was the main tool to favor the hypothesis of a scarce crustal magnetization in central Europe in the area of the CEML, being characterized there by very-low-amplitude values.
At 100 km of altitude, the joint analysis of the total gradient intensity and the magnetic field was also decisive in detecting further magnetic sources in the Paleozoic Platform characterized by a reverse magnetization. In fact, highs of the total gradient intensity and strong lows in the magnetic field occur in the areas of the Brabant Massif, the Pannonian Basin and the Bohemian Massif. This indicates the presence of sources with reverse magnetization, in agreement with rock magnetism surveys, which have shown the presence of minerals, such as pyrrhotite and magnetite, in metamorphic rocks and limestones of Paleozoic formations.
The analysis of the total gradient intensity field at 350 km pointed out the fact that the strong contrast in structural and magnetic properties is the main contribution to the magnetic field. The |∇T| highs are indeed well located above the TESZ region, with a trend directed toward the Paleozoic Platform. This is typical of a contact-like effect, as shown by synthetic modeling. On the other hand, there are no significant highs of the total gradient intensity in central Europe, leading us to consider a weak to average magnetization for the Paleozoic crust.
In conclusion, the large-altitude magnetic low of central Europe can be interpreted as being mainly due to a weakly magnetized thin crust versus a strongly magnetized and thick crust for the EEC, bounded by the TESZ. The presence of rocks with a strong remanent component of magnetization, characterizing some areas of the Paleozoic Platform, cannot contribute to the formation of the whole CEML, and their effects vanish rapidly at satellite elevations.
EMMP high-resolution datasets are available from Getech, UK (info@getech.com), and MF7 model data can be downloaded at http://geomag.org/models/MF7.html (last access: 10 May 2019; Maus et al., 2010).
The supplement related to this article is available online at: https://doi.org/10.5194/se-10-697-2019-supplement.
MM and MF conceived of the presented work and with JDF wrote the paper. MM performed the computations, derived the models and produced the figures. MF and JDF supervised the findings of the work. All authors discussed the results and contributed to the final paper.
The authors declare that they have no conflict of interest.
We acknowledge GETECH for the EMMP dataset availability. The authors would like to thank the reviewers, Fabio Caratori Tontini and Jörg Ebbing, for their useful suggestions that significantly improved the quality of this paper.
This paper was edited by Nicolas Gillet and reviewed by Fabio Caratori Tontini and Jörg Ebbing.
Artemieva, I. M. and Meissner, R.: Crustal thickness controlled by plate tectonics: a review of crust-mantle interaction processes illustrated by European examples, Tectonophysics, 530–531, 18–49, https://doi.org/10.1016/j.tecto.2011.12.037, 2012.
BABEL Working Group: Deep seismic reflection/refraction interpretation of crustal structure along BABEL profiles A and B in the southern Baltic Sea, Geophys. J. Int., 112, 325–343, 1993.
Banka, D., Pharaoh, T. C., Williamson, J. P., and TESZ Project Potential Field Core Group: Potential field imaging of Palaeozoic orogenic structures in northern and central Europe, Tectonophysics, 360, 23–45, 2002.
Baranov, W.: Potential fields and their transformations in applied geophysics, pp. 1–72, Geoexploration monograph series, vol 6, 121 pp., Gebruder Borntraeger, Stuttgart, Germany, 1975.
Bielik, M., Séfara, J., Sotak, J., Kováč, M., Bezák, V., and Plašienka, D.: The western Carpathians: Interaction of Hercynian and Alpine processes, Tectonophysics, 393, 63–86, 2004.
Blundell, D., Freeman, R., and Mueller, S. (Eds.): A Continent Revealed – The European Geotraverse, European Science Foundation, Cambridge University Press, Cambridge, 287, 1992.
Boccaletti, M., Innocenti, F., Manetti, P., Mazzuoli, R., Motamed, A., Pasquare, G., Radicati di Brozolo, F., and Amin Sobhani, E.: Neogene and Quaternary volcanism of the Bijar Area (Western Iran), Bull. Volcanologique, 40–2, 121–133, 1976.
Bogdanova, S., Gorbatchev, R., Grad, M., Janik, T., Guterch, A., Kozlovskaya, E., Motuza, G., Skridlaite, G., Starostenko, I., Taran, L., and Eurobridge and Polonaise working Group: EUROBRIDGE: new insight into the geodynamic evolution of East European Craton, in: European Lithosphere Dynamics, edited by: Gee D. G. and Stephenson. R. A., Geol. Soc., London, Memoirs, 32, 599–625, 2006.
Bosum, W. and Wonik, T.: Magnetic anomaly pattern of Central Europe, Tectonophysics, 195, 43–64, 1991.
Brückl, E., Bodoky, T., Hegedûs, E., Hrubcová, P., Gosar, A., Grad, M., Guterch, A., Hajnal, Z., Keller, G. R., Špičák, A., Sumanovac, F., Thybo, H., Weber, F., and ALP 2002 Working Group: ALP 2002 seismic experiment, Stud. Geoph. Geod., 47, 671–679, 2003.
Čermák, V. and Rybach, L.: Terrestrial Heat Flow in Europe, Springer-Verlag, Berlin, Heidelberg and New York, 328 pp., 1979.
Čermák, V., Šafanda, J., and Guterch, A.: Deep temperature distribution along three profiles crossing the Teisseyre-Tornquist tectonic zone in Poland, Tectonophysics, 164, 151–163, 1989.
Chiozzi, P., Matsushima, J., Okubo, Y., Pasquale, V., and Verdoya, M.: Curie-point depth from spectral analysis of magnetic data in central-southern Europe, Phys. Earth Planet. Inter., 152, 267–276, 2005.
Davies, J. H.: Global map of solid Earth surface heat flow: Global Surface Heat Flow Map, Geochem. Geophys. Geosyst., 14, 4608–4622, 2013.
DEKORP Research Group: Results of the DEKORP 4/KTB Oberpfalz deep seismic reflection investigations, J. Geophys., 62, 69–101, 1988.
De Vos, W., Verniers, J., Herbosch, A., and Vanguestaine, M.: A new geological map of the Brabant Massif, Geol. Mag., 130, 605–611, 1993.
EUROBRIDGE Seismic Working Group: P- and S-wave seismic velocity structure across the Fennoscandia-Sarmatia suture of the East European Craton beneath the EUROBRIDGE profile trough Lithuania and Belarus, Tectonophysics, 314, 193–218, 1999.
Fairhead, J. D.: Advances in Gravity and Magnetic Processing and Interpretation, EAGE Publications bv, 2015..
Farr, T. G., Rosen, P. A., Caro, E., Crippen, R., Duren, R., Hensley, S., Kobrick, M., Paller, M., Rodrigues, E., Roth, L., Seal, D., Shaffer, S., Shimada, J., Umland, J., Werner, M., Oskin, M., Burbank, D., Alsdorf, D., Tom, P. A. R., Farr, G., Caro, E., Crippen, R., Duren, R., Hensley, S., Kobrick, M. P., and Rodriguez, E.: The Shuttle Radar Topography Mission, Rev. Geophys., 45, RG2004, https://doi.org/10.1029/2005RG000183, 2007.
Fedi, M., Florio, G., and Quarta, T.: Multiridge analysis of potential fields: geometrical method and reduced Euler deconvolution, Geophysics, 74, L53–L65, 2009.
Fedi, M., Florio, G., and Cascone, L.: Multiscale analysis of potential fields by a ridge consistency criterion: the reconstruction of the Bishop basement, Geophys. J. Int., 188, 103–114, https://doi.org/10.1111/j.1365-246X.2011.05259.x, 2012.
Fletcher, K. M. U., Fairhead, J. D., Salem, A., Lei, K. A., and Cabanillas, P. L. M.: Building a higher resolution magnetic database for Europe for resource evaluation, First Break, 29, 95–101, 2011.
Florio, G., Fedi, M., and Cella, F.: Insights on the spreading of the Tyrrhenian Sea from the magnetic anomaly pattern: Magnetic anomaly pattern in the Tyrrhenian Sea, Terra Nova, 51, 127–133, https://doi.org/10.1111/j.1365-3121.2011.00992.x, 2011.
Freeman, R. and Mueller, S. (Eds.): Proc 6th EGT Worksh: Data compilation and synoptic interpretation, Eur. Sci. Found., Strasbourg, 457 pp., 1990.
Gaál, G. and Gorbatschev, R.: An outline of the Precambrian evolution of the Baltic Shield, Precambrian Res., 35, 15–52, 1987.
Gabriel, G., Vogel, D., Scheibe, R., Lindner, H., Pucher, R., Wonik, T., and Krawczyk, C. M.: Anomalies of the Earth's total magnetic field in Germany – the first complete homogenous data set reveals new opportunities for multiscale geoscientific studies, Geophys. J. Int., 184, 1113–1118, https://doi.org/10.1111/j.1365-246X.2010.04924.x, 2011.
Gebrande, H., Bopp, M., Neurieder, P., and Schmidt, T.: Crustal structure in the surroundings of the KTB drill site as derived from refraction and wide-angle seismic observations, in: The German Continental Deep Drilling Program (KTB), edited by: Emmetmann, R. and Wohlenberg, J., 37–54, Springer-Verlag, New York, 1989.
Gibert, D. and Galdeano, A.: A computer program to perform transformations of gravimetric and aeromagnetic survey, Comput. Geosci., 11, 553–588, 1985.
Giese, P. and Pavlenkova, N. I.: Structural maps of the Earth's crust in Europe, Izv. Akad. Nauk SSSR Fiz. Zemli, 10, 3–14, 1988 (in Russian).
Grabowska, T. and Bojdys, G.: The border of the East-European Craton in south-eastern Poland based on gravity and magnetic data, Terra Nova, 13, 92–98, 2001.
Grad, M., Jensen, S. L., Keller, G. R., Guterch, A., Thybo, H., Janik, T., Tiira, T., Yliniemi, J., Luosto, U., Motuza, G., Nasedkin, V., Czuba, W., Gaczyñski, E., Środa, P., Miller, K. C., Wilde-Piórko, M, Komminaho, K., Jacyna, J., and Korabliova, L.: Crustal Structure of the Trans-European suture zone region along POLONAISE'97 seismic profile P4, J. Geophys. Res., 108, 2541, https://doi.org/10.1029/2003JB002426, 2003.
Grad, M., Tiira, T., and Group, E. W.: The Moho depth map of the European Plate, Geophys. J. Int., 176, 279–292, 2009.
Guterch, A. and Grad, M.: Lithospheric structure of the TESZ in Poland based on modern seismic experiments, Geol. Q., 50, 23–32, 2006.
Guterch, A., Grad, M., Thybo, H., Keller, G. R., and the POLONAISE WorkingGroup: POLONAISE'97 – international seismic experiment between Precambrian and Variscan Europe in Poland, Tectonophysics, 314, 101–121, 1999.
Guterch, A., Grad, M., Keller, G. R., Posgay, K., Vozár, J., Špičák, A., Brückl, E., Hajnal, Z., Thybo, H., Selvi, O., and Celebration 2000 Experimant Team: CELEBRATION 2000 seismic experiment, Stud. Geoph. Geod., 47, 659–669, 2003.
Haney, M., Johnston, C., Li, Y., and Nabighian, M.: Envelopes of 2D and 3D magnetic data and their relationship to the analytic signal, 73rd Ann. Internat. Mtg., SEG Technical Program Expanded Abstracts, 596–599, 2003.
Henkel, H.: Standard diagrams of magnetic properties and density – a tool for understanding magnetic petrology, J. Appl. Geophys., 32, 43–53, 1994.
Horváth, F.: Towards a kinematic model for the formation of the Pannonian basin, Tectonophysics, 226, 333–357, 1993.
Hurtig, E., Čermák, V., Haenel, R., and Zui, V. I. (Eds.): Geothermal Atlas of Europe, Haack, Gotha, 1992.
Kis, K. I., Taylor, P. T., Wittmann, G., Toronyi, B., and Puszta, S.: Inversion of magnetic measurements of the CHAMP satellite over the Pannonian Basin, J. Appl. Geophys., 75, 412–418, 2011.
Korja, A. and Heikkinen, P.: The Accretionary Svecofennian Orogen – insight from the BABEL profiles, Precambrian Res., 136, 241–268, 2005.
Królikowski, C.: Crustal-scale complexity of the contact zone between the Palaeozoic Platform and the East-European Craton in the NW Poland, Geol. Q., 50, 33–42, 2006.
MacLeod, I. N., Jones, K., and Dai, T. F.: 3-D analytic signal in the interpretation of Total magnetic field data at low magnetic latitudes, Explor. Geophys., 24, 679–688, https://doi.org/10.1071/EG993679, 1993.
Majorowicz, J. and Wybraniec, S.: New terrestrial heat flow map of Europe after regional paleoclimatic correction application, Int. J. Earth. Sci., 100, 881–887, 2011.
Mastellone, D., Fedi, M., Ialongo, S., and Paoletti, V.: Volume upward continuation of potential fields from the minimum-length solution: an optimal tool for continuation through general surfaces, J. Appl. Geophys., 111, 346–355, https://doi.org/10.1016/j.jappgeo.2014.10.020, 2014.
Maus, S.: An ellipsoidal harmonic representation of Earth's lithospheric magnetic field to degree and order 720, Geochem. Geophys. Geosyst., 11, Q06015, https://doi.org/10.1029/2010GC003026, 2010 (data available at: http://geomag.org/models/MF7.html, last access: 10 May 2019).
McCann, T.: The Geology of Central Europe, Precambrian and Palaeozoic, Mesozoic and Cenozoic, vol. 2, p. 748, p. 1449, Geol. Soc. London, London, 2008.
Milano, M., Fedi, M., and Fairhead, J. D.: The deep crust beneath the Trans-European Suture Zone from a multiscale magnetic model, J. Geophys. Res.-Sol. Ea., 121, 6276–6292, https://doi.org/10.1002/2016JB012955, 2016.
Molina Garza, R. S. M. and Zijderveld, J. D. A.: Paleomagnetism of Paleozoic strata, Brabant and Ardennes Massifs, Belgium: Implications of prefolding and postfolding Late Carboniferous secondary magnetizations for European apparent polar wander, J. Geophys. Res., 101, 15799–15818, 1996.
Mushayandebvu, M. F., van Driel, P., Reid, A. B., and Fairhead, J. D.: Magnetic source parameters of two-dimensional structures using extended Euler deconvolution, Geophysics, 66, 814–823, https://doi.org/10.1190/1.1444971, 2001.
Nabighian, M. N.: The analytic signal of two-dimensional magnetic bodies with polygonal cross-section: Its properties and use for automated anomaly interpretation, Geophysics, 37, 507–517, 1972.
Oppenheim, A. V. and Schafer, R. W.: Discrete-Time Signal Processing, Prentice-Hall, Englewood Cliffs, 1975.
Paoletti, V., Gruber, S., Varley, N., D'Antonio, M., Supper, R., and Motschka, K.: Insights into the Structure and Surface Geology of Isla Socorro, Mexico, from Airborne Magnetic and Gamma-Ray Surveys, Surv. Geophys., 37, 601–623, 2016.
Pharaoh, T. C.: Palaeozoic terranes and their lithospheric boundaries within the Trans-European Suture Zone (TESZ): a review, Tectonopysics, 314, 17–41, https://doi.org/10.1016/S0040-1951(99)00235-8, 1999.
Pharaoh, T. C. and Gibbons, W.: Precambrian rocks in England and Wales south of the Menai Strait Fault System, pp. 85–97, in: A revised correlation of Precambrian rocks in the British Isles, edited by: Gibbons, J. S. and Harris, A. L., Geol. Soc. Lond., 110 pp., 1994.
Pharaoh, T. C., Brewer, T. S., and Webb, P. C.: Subduction-related magmatism of late Ordovician age in eastern England, Geol. Mag., 130, 647–656, 1993.
Plant, J. A., Whittaker, A., Demetriades, A., De Vivo, B., and Lexa, J.: The Geological and Tectonic Framework of Europe, Eurogeosurveys, British Geological Survey, in: FOREGS, Geochemical Atlas of Europe, Part 1: Background Information, Methodology and Maps, Geological Survey of Finland, edited by: Salminen, R., Espoo, Finland, 1998.
Plewa, S.: Map of heat flow in Poland, in: Tectonic Atlas of Poland, edited by: Znosko, J., plate 5, Pol. Geol. Inst., Warsaw, 1998.
Pucher, R.: Pyrrohotite-induced aeromagnetic anomalies in western Germany, J. Appl. Geophys., 32, 32–42, 1994.
Pucher, R. and Wonik, T.: A new interpretation of the MAGSAT anomalies of Central Europe, Phys. Chem. Earth, 23, 981–985, 1998.
Ravat, D. N., Hinze, W. J., and Taylor, P. T.: European tectonic features obselwed by Magsat, Tectonophysics, 220, 157–173, 1993.
Rehault, J. P., Moussat, E., and Fabbri, A.: Structural evolution of the Tyrrhenian back-arc basin, Mar. Geol., 74, 123–150, 1987.
Ridsdill-Smith, T. A.: The application of the wavelet transform to the processing of aeromagnetic data, PhD Thesis, University of Western Australia, Perth, 173 p., 2000.
Roest, W. and Pilkington, M.: Identifying remanent magnetization effects in magnetic data, Geophysics, 58, 653–659, 1993.
Roest, W. R., Verhoef, J., and Pilkington, M.: Magnetic interpretation using 3-D analytic signal, Geophysics, 57, 116–125, 1992.
Salem, A., Ravat, D., Gamey, T. J., and Ushijima, K.: Analytic signal approach and its applicability in environmental magnetic investigations, J. Appl. Geophys., 49, 231–244, 2002.
Shearer, S. and Li, Y.: 3D Inversion of magnetic total gradient data in the presence of remanent magnetization, in: SEG Technical Program Expanded Abstracts 2004, https://doi.org/10.1190/1.1851318, 2004.
Taylor, P. T. and Ravat, D.: An interpretation of the MAGSAT Anomalies of Central Europe, J. Appl. Geophys., 34, 83–91, 1995.
Taylor, P. T., Kis, K. I., von Frese, R. R. B., Korhonen, J. V., Wittmann, G., Kim, H. R., and Potts, L. V.: Effects of varying crustal thickness on CHAMP geopotential data, in: Earth Observation with CHAMP, edited by: Reigber, C., Lühr, H., and Schwintzer, J., Springer-Verlag, Berlin, Heidelberg, New York, pp. 279–286, 2005.
Thominski, H. P., Wohlenberg, J., and Bleil, U.: The remagnetization of Devono-Carboniferous sediments from the Ardenno-Rhenish Massif, Tectonophysics, 225, 411–431, 1993.
Thybo, H.: A seismic velocity model along the EGT profile – from the North German Basin into the Baltic Shield, in: The European Geotraverse. Integrative Studies, edited by: Freeman, R., Giese, P., and Muller, S. T., European Science Foundation, Strasbourg, pp. 99–108, 1990.
Thybo, H.: Crustal structure along the EGT profile across the Tornquist Fan interpreted from seismic, gravity and magnetic data, Tectonophysics, 334, 155–190, 2001.
Tomek, Č., Dvořáková, V., and Vrána, S.: Geological interpretation of the 9HR and 503M seismic profiles in Western Bohemia, in: Geological model of western Bohemia related to the KTB borehole in Germany, edited by: Vrana, S. and Stedra, V., J. Geol. Sci., Prague, 47, 43–50, 1997.
Trifonova, P., Zhelev, Z., Petrova, T., and Bojadgieva, K.: Curie point depth of Bulgarian territory inferred from geomagnetic observations and its correlation with regional thermal structure and seismicity, Tectonophysics, 473, 362–374, 2009.
Williamson, J. P., Pharaoh, T. C., Banka, D., Thybo, H., Laigle, M., and Lee, M. K.: Potential field modelling of the Baltica–Avalonia (Thor–Tornquist) suture beneath the southern North Sea, Tectonophysics, 360, 47–60, https://doi.org/10.1016/S0040-1951(02)00346-3, 2002.
Zegers, T. E., Dekkers, M. J., and Bailly, S.: Late Carboniferous to Permian remagnetization of Devonian limestones in the Ardennes: Role of temperature, fluids, and deformation: Remagnetization Of Devonian Limestone, J. Geophys. Res., 108, 2357, https://doi.org/10.1029/2002JB002213, 2003.