the Creative Commons Attribution 4.0 License.
the Creative Commons Attribution 4.0 License.
 | 08 Apr 2020
Fluid-mediated, brittle–ductile deformation at seismogenic depth – Part 2: Stress history and fluid pressure variations in a shear zone in a nuclear waste repository (Olkiluoto Island, Finland)
Francesca Prando
Mark Anderson
Barbara Marchesini
Jussi Mattila
Giulio Viola
The microstructural record of fault rocks active at the brittle–ductile transition zone (BDTZ) may retain information on the rheological parameters driving the switch in deformation mode and on the role of stress and fluid pressure in controlling different fault slip behaviours. In this study we analysed the deformation microstructures of the strike-slip fault zone BFZ045 in Olkiluoto (SW Finland), located in the site of a deep geological repository for nuclear waste. We combined microstructural analysis, electron backscatter diffraction (EBSD), and mineral chemistry data to reconstruct the variations in pressure, temperature, fluid pressure, and differential stress that mediated deformation and strain localization along BFZ045 across the BDTZ. BFZ045 exhibits a mixed ductile–brittle deformation, with a narrow (<20 cm thick) brittle fault core with cataclasites and pseudotachylytes that overprint a wider (60–100 cm thick) quartz-rich mylonite. Mylonitic deformation took place at 400–500 ∘C and 3–4 kbar, typical of the greenschist facies metamorphism at the base of the seismogenic crust. We used the recrystallized grain size piezometry for quartz to document a progressive increase in differential stress, from ca. 50 to ca. 120 MPa, towards the shear zone centre during mylonitization and strain localization. Syn-kinematic quartz veins formed along the mylonitic foliation due to transiently high pore fluid pressure (up to lithostatic value). The overprint of the veins by dynamic recrystallization and mylonitic creep is further evidence of the occurrence of brittle events under overall ductile conditions. We propose a conceptual model in which the ductile–brittle deformation cycle was controlled by transient oscillations in fluid pressure and progressively higher differential stress, possibly occurring in a narrowing shear zone deforming towards the peak strength of the crust at the BDTZ.
- Article
(47207 KB) - Full-text XML
- Companion paper
-
Supplement
(121 KB) - BibTeX
- EndNote


The change from fracturing and frictional sliding to dominant thermally activated creep processes accommodating viscous flow in mylonitic rocks occurs at the brittle–ductile transition zone (BDTZ; e.g. Kohlstedt et al., 1995; Handy et al., 2007). Strength envelopes predict that the BDTZ coincides with a peak strength in the crust at an approximate depth of 10–15 km between the brittle upper crust and the ductile middle and lower crust. Naturally constrained stress profiles through exhumed mid-crustal rocks are consistent with this picture (Behr and Platt, 2011). However, cyclical switches in deformation style during the evolution of mid-crustal shear zones (e.g. Pennacchioni and Mancktelow, 2007; Fusseis and Handy, 2008; Wehrens et al., 2016; Melosh et al., 2018) demonstrate that the BDTZ occupies a depth interval that can vary transiently, reflecting changes in, for example, bulk strength of the shear zones (Hirth and Tullis, 1994; Scholz, 1998; Fossen and Cavalcante, 2017; Melosh et al., 2018) and fluid pressure (Cox, 2010; Kjøll et al., 2015; Sibson and Rowland, 2003; Yardley and Baumgartner, 2007; Hirth and Beeler, 2015; Marchesini et al., 2019). Lithology; P–T conditions; and variations in stress, strain rate, and fluid pressure are important factors controlling the occurrence of different deformation mechanisms (dislocation creep, diffusion creep, fluid-assisted veining, dissolution–precipitation creep, fracturing, and cataclasis) that overlap in space and time at the BDTZ. It is important to assess whether evidence of cyclical fluctuations of those parameters is preserved in the geological record and whether the extent of such variations can be estimated by examining natural fault rocks.
Microstructures can record crucial information on the parameters steering deformation at the BDTZ, and they are an invaluable tool that enables derivation of rheological parameters of shear zones (e.g. Stipp et al., 2002; Behr and Platt, 2011; Ceccato et al., 2018). However, the mutual overprinting relationships between brittle and ductile deformation and associated fault rocks at the BDTZ typically result in only partial microstructural records, in which the youngest deformation event might have completely overprinted the evidence of earlier deformation episodes. Recent deformation experiments have opened up new avenues for the investigations of natural deformation microstructures in quartz-rich rocks that result from stress variations during brittle–ductile deformation. The “kick and cook” experiments, for example, have documented quartz microstructures formed during transient high stress deformation followed by stress relaxation (Trepmann et al., 2007). Deformation experiments conducted by Kidder et al. (2016) show that the microstructure associated with a stress increase in quartzite is a bimodal distribution of recrystallized grain size. The smaller grains accurately record the stress increase, whereas the surviving coarser grains formed during earlier, lower stress deformation. The smaller grains can be used to constrain differential stresses during the most recent (high stress) deformation event using a recrystallized grain size palaeopiezometer (Stipp and Tullis, 2003; Cross et al., 2017).
Fluids can also play a fundamental role in triggering a transient switch from dominantly ductile to brittle deformation, as demonstrated, for example, by the syn-kinematic emplacement of quartz veins subsequently overprinted by crystal-plastic deformation (Handy et al., 2007; Kjøll et al., 2015; Trepmann and Seybold, 2019; Marchesini et al., 2019). Cyclical ductile–brittle–ductile deformation associated with high fluid fluxes involving a fault-valve behaviour (Sibson, 1990) implies cycles of fluid pressure build-up followed by fluid venting and pressure drop, and it has been related to seismic fault behaviour (Sibson, 1992; Cox, 1995; Nguyen et al., 1998; Viola et al., 2006). Fault modelling and field studies must attempt to quantify the thermal and structural history of fault rocks, as well as the fluid activity in faults, to identify the parameters controlling the dominant deformation mode and mechanisms active at seismogenic depths.
This study investigates the microstructural record of the deformation behaviour at the BDTZ of a sub-vertical sinistral strike-slip fault hosted in the basement of the Paleoproterozoic Baltic Shield in Finland. The fault occurs within the deep ONKALO spent nuclear fuel repository that is currently being built on the island of Olkiluoto in SW Finland (Fig. 1a). The present-day structure of the fault consists of a narrow (<20 cm thick) brittle fault zone core that is contained inside a thicker (max 1 m thick) ductile, mylonitic shear zone. We constrain the deformation history of the fault zone and use quartz microstructure to estimate the stress history of the mylonitic precursor. We propose a conceptual model of the evolution of fault slip behaviour that incorporates the constraints on differential stress and fluid pressure derived from our microstructural analysis and that applies to a narrowing shear zone that progressively localizes strain when deforming across the BDTZ.
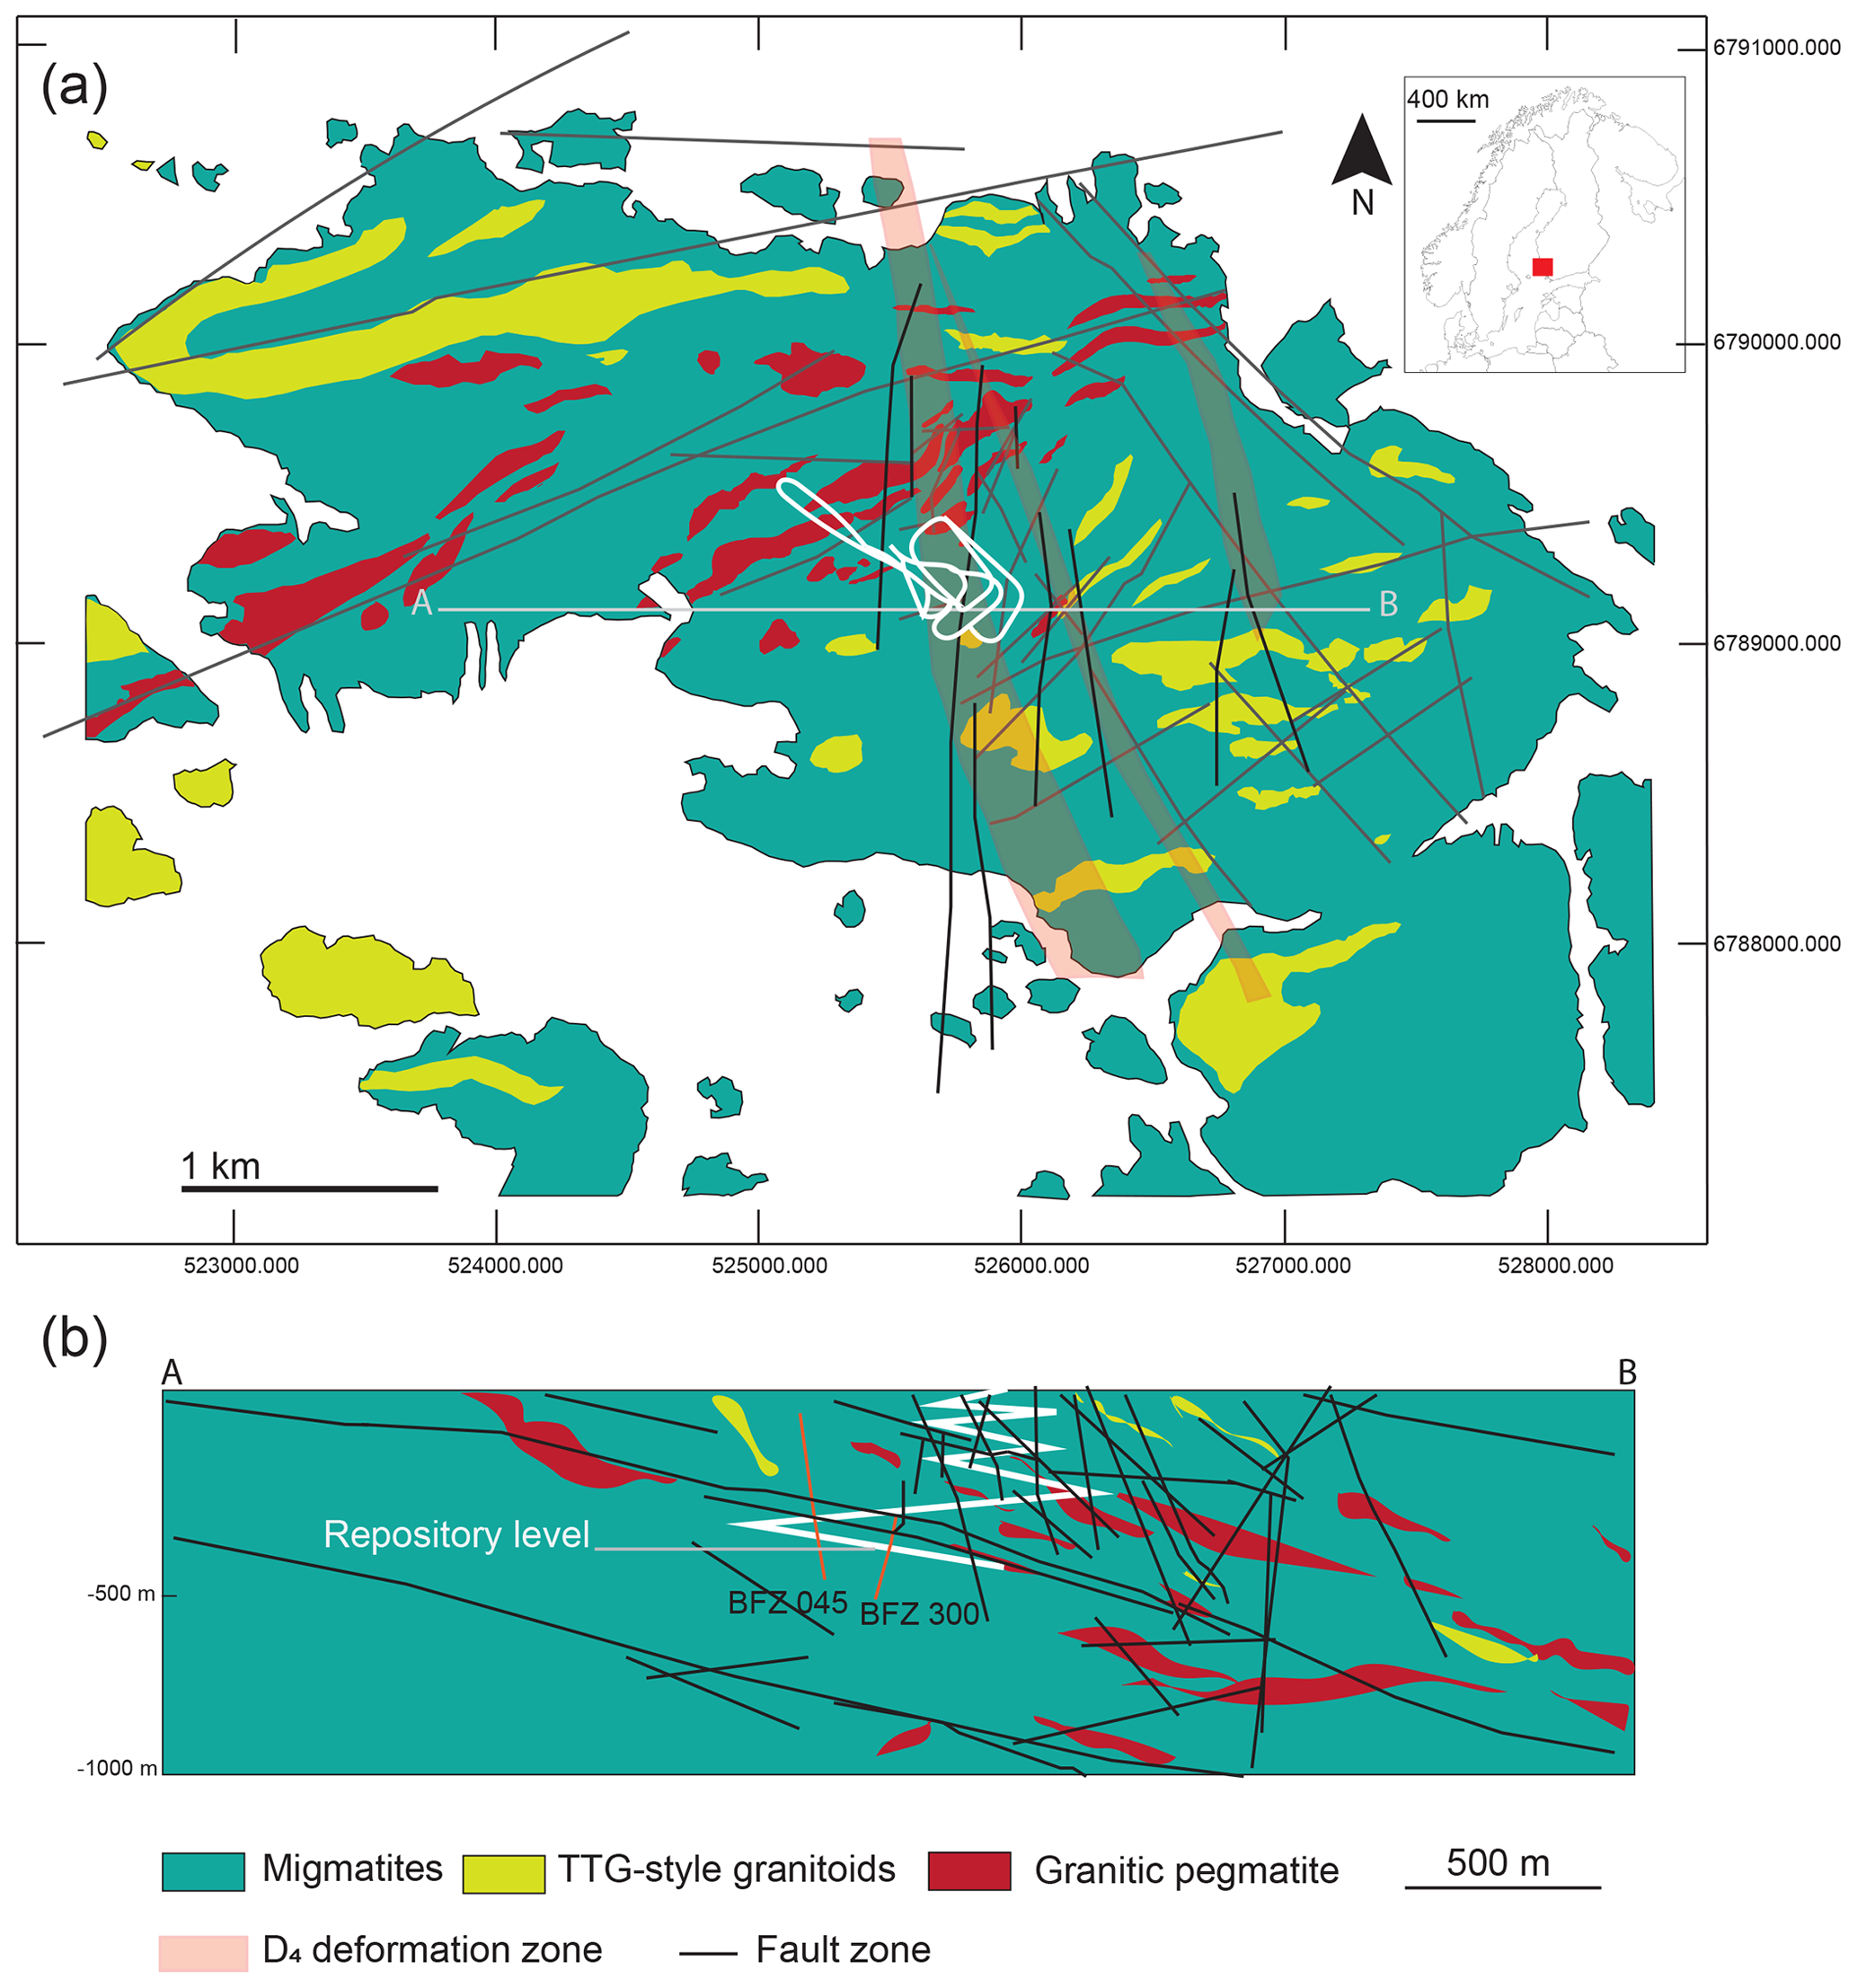
Figure 1Geological setting of Olkiluoto, SW Finland (inset on top-right). (a) Schematic geological and structural map, showing surface intersection of modelled brittle fault zone (BFZ) and ductile deformation zone, modified from Aaltonen et al. (2016) and Skyttä and Torvela (2018). Coordinates are for zone 34N in UTM coordinate system. The white line indicates the location of the underground ONKALO facility. A–B is the trace of the cross section shown in (b). (b) East–west cross section for the underground infrastructure, with the tunnel shown as white line. Sub-vertical fault BFZ045 described in this study and its conjugate BFZ300 are shown as orange lines.
The island of Olkiluoto in SW Finland (Fig. 1a) is part of the Baltic Shield, which was consolidated during the latest accretionary stages of the Svecofennian orogeny between ca.1.89 and 1.80 Ga (Lahtinen, 1994; Nironen, 1997; Lahtinen et al., 2005; Pajunen et al., 2008). In the study area, the dominant rock types consist of amphibolite facies migmatitic metasediments formed between ca.1.84–1.82 Ga, at 3.7–4.2 kbar and 660–700 ∘C (Tuisku and Kärki, 2010; Aaltonen et al., 2016); ca. 1.89 and 1.85 Ma old calc-alkaline syn-orogenic TTG-type (tonalite-trondhjemite-granodiorite) granitoids that predated the migmatization (Mänttäri et al., 2006); and syn- to late-orogenic leucogranites and pegmatites intruded ca. 1.85 to 1.79 Ga (Mänttäri et al., 2010). Following the peak metamorphism leading to migmatization, retrograde metamorphism under greenschist facies conditions affected the area and continued throughout the subsequent orogenic collapse, dated at ca. 1.79–1.77 Ga for SW Finland (Lahtinen et al., 2005).
Polyphase ductile deformation affected Olkiluoto between ∼1.86 and 1.79 Ga (Aaltonen et al., 2016), followed by a polyphase brittle deformation history between ∼1.75 to 0.8 Ga (Mattila and Viola, 2014). Field studies identified characteristic structures for three (D2–D4) deformation stages, which overprint a pre-migmatite, poorly preserved deformation stage (D1; Aaltonen et al., 2010, and references therein). Deformation during D2 (∼1.86–1.83 Ga) and D3 (∼1.83 to 1.81 Ga) occurred under amphibolite facies condition; D2 developed a penetrative NE–SW-striking high-grade (locally migmatitic) foliation dipping moderately towards SE, as well as NE–SW-striking mesoscopic shear zones. D3 developed NNE–SSW-striking foliations and E–W- to NE–SW-trending (S–SE-dipping) shear zones (Aaltonen et al., 2010). The latest stage, D4, developed under greenschist facies retrograde metamorphism around ∼1.81–1.79 Ga according to U/Pb dating of syn-kinematic pegmatites (Mänttäri et al., 2010). D4 structures consist of NNE–SSW- and N–S-striking sub-vertical ductile shear zones, varying in thickness from ∼0.5 to 200 m (Fig. 1a).
Brittle deformation in Olkiluoto was characterized both by the reactivation of optimally oriented pre-existing ductile structures and by the formation of new Andersonian-type faults and joints. The dominant brittle structures can be grouped into two main sets: (1) an E–W- to NE–SW-trending set of low-angle faults exploiting the D2 regional migmatitic foliation and (2) a set of sub-vertical faults striking N–S to NW–SE (Fig. 1; Aaltonen et al., 2016). Palaeostress inversion of fault slip data permitted us to identify seven distinct brittle stages during the Paleoproterozoic–Mesoproterozoic structural history of SW Finland (Mattila and Viola, 2014). Of interest for this study is the first brittle deformation stage that developed conjugate systems of NNW–SSE sinistral and NW–SE dextral strike-slip faults, in accordance with the NW–SE to NNW–SSE compression proposed for the late- to post-Svecofennian orogeny (Viola et al., 2009; Torvela and Ehlers, 2010; Saintot et al., 2011). Field observations indicate that faults optimally oriented for the first stage of brittle deformation commonly exploit NNE–SSW and N–S precursor shear zones characteristic of the D4 stage of ductile deformation (Aaltonen et al., 2016; Nordbäck and Mattila, 2018; Skyttä and Torvela, 2018).
A network of vertical N–S and NW–SE faults has been mapped and investigated at the repository scale in ONKALO with underground surveys and boreholes (Aaltonen et al., 2016, Fig. 1b). N–S faults are typically localized on mica-rich precursor ductile shear zones (Pere, 2009). The role of sub-vertical, N–S-striking ductile precursor zones in controlling the localization of faults at the disposal site was investigated by Skyttä and Torvela (2018), who identified the ductile precursor structures as short limbs of D4 asymmetric folds and as anastomosing networks of discrete retrograde (greenschist facies) ductile shear zones. Skyttä and Torvela (2018) proposed that the sub-vertical N–S faults formed as a result of progressive strain localization during the late stage of D4, which culminated in the development of discrete faults through linkage of individual fault segments that preferentially exploited optimally oriented branches of the anastomosing network of localized ductile shear zones. Therefore, the faults exploiting D4 shear zones represent ideal targets to investigate the deformation processes and mechanisms at the brittle–ductile transition in Olkiluoto and the associated rheological parameters recorded in the fault rock microstructures. This study uses the N–S sinistral strike-slip fault BFZ045 as a natural laboratory to investigate the stress history of the ductile precursor and the possible role of fluids on the deformation processes active at the brittle–ductile transition. The companion paper by Marchesini et al. (2019) has thoroughly described the deformation history of the conjugate dextral BFZ300 fault.
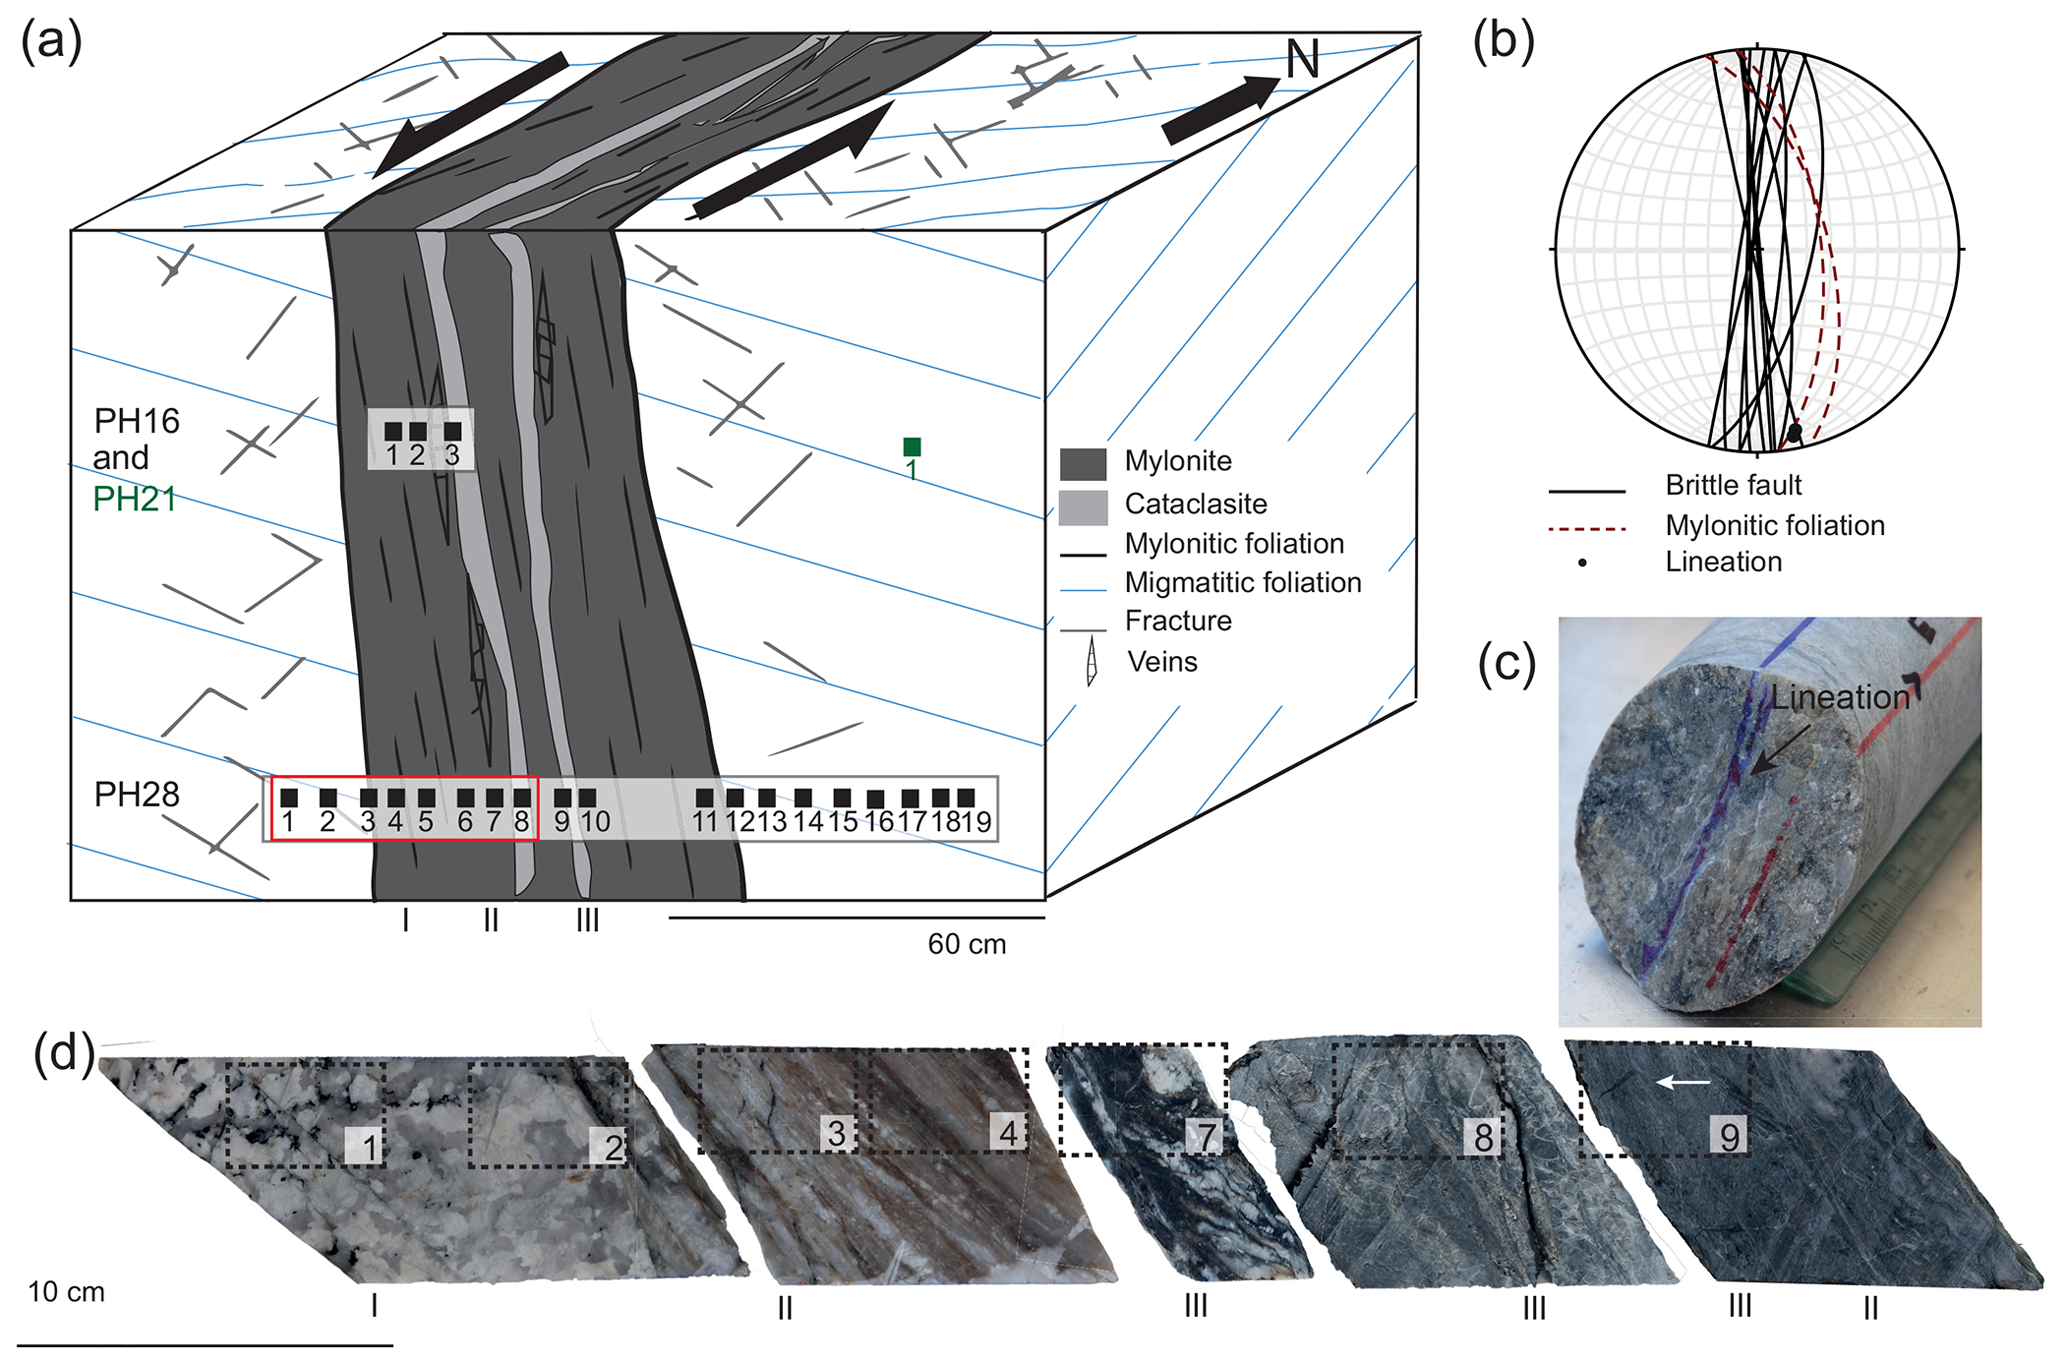
Figure 2BFZ045 fault geometry. (a) Schematic representation of fault architecture from core logs; vertical axis not to scale. Grey rectangles locate the studied drill cores PH28 and PH16, black squares show sample locations. The red rectangle indicates the samples shown in (d). (b) Stereonet plot of BFZ045 fault core orientation and mylonitic foliation observed at different drill hole intersections in the ONKALO facility (Aaltonen et al., 2016). (c) Core sample along PH28 drill core within the fault core unit. The core sample exposes the mylonitic foliation, where the blue line indicates the stretching lineation, which is parallel to chlorite striae. (d) Samples from PH28 drill core representative of different domains of the fault: damaged coarse-grained host rock (I) and fault core with mylonites and chlorite-rich cataclasites (II–III). Dashed lines outline the area of petrographic thin sections. White arrow points to pseudotachylyte injection veins.
3.1 Sampling
Samples were obtained from two sub-horizontal drill cores from the underground facilities that intersect the BFZ045 fault (Fig. 2a). The analysed samples were selected from (i) a 2 m continuous section along drill core PH28, which was drilled at a depth of 433 m b.s.l. and is oriented ESE–WNW and (ii) drill core PH16 from the “Demonstration Facilities” tunnels at 420 m depth, described in Aaltonen et al. (2016). The PH28 samples were selected from the 99–101 m interval of the drill core, with core distance measured from ESE to WNW, which includes the fault core and the proximal damage zone. The selected interval of the drill core was cut in half parallel to the stretching lineation and perpendicular to the mylonitic foliation and subsampled at regular intervals of 2 cm. Nineteen polished thin sections were added to three samples from PH16 previously described in Aaltonen et al. (2016). An additional thin section from drill core PH21 (drilled at the same depth of PH16) was used to estimate the T of the graphite formation in the host rock using Raman spectroscopy of carbonaceous material (see Sects. 3.2 and 4.5).
3.2 Microstructural observations and electron backscatter diffraction (EBSD) analysis
Deformation microstructures were studied using petrographic and scanning electron microscopy (SEM). SEM and EBSD analyses were performed at the Plymouth Electron Microscopy Centre using a JEOL LV6610 SEM and a JEOL 7001 FEG-SEM. Thin sections used for electron backscatter diffraction (EBSD) analysis were polished with colloidal silica before being carbon coated. Data were acquired on a NordlysNano and a NordlysMax EBSD detector (Oxford Instruments). Working conditions during acquisition of the EBSD patterns were 20 kV, 20 mm working distance, 70∘ sample tilt, and high vacuum. AZtec software was used for pattern indexing on rectangular grids with step sizes of 0.7, 1, and 1.8 µm. EBSD patterns were processed with the Channel 5 software (Oxford Instruments), and noise reduction was performed following the procedure suggested in Bestmann and Prior (2003).
Differential stresses during mylonitic creep were estimated using the recrystallized grain size piezometer for quartz by Cross et al. (2017). The method relies on the separation between relict and recrystallized grains based on the grain orientation spread (GOS), which is a measure of the internal strain of a grain defined as the average misorientation angle between each pixel in a grain and that grain's mean orientation (Wright et al., 2011). Further details on the presentation of the EBSD data and on the recrystallized grain size piezometer for quartz by Cross et al. (2017) are presented in the Supplement S1.
3.3 Mineral chemistry and Raman spectroscopy
Major element mineral chemistry of chlorite and white mica was measured with electron microprobe analysis (EMPA) at the Department of Earth Sciences, University of Milan, Italy. Carbon coated thin sections were probed with a JEOL 8200 Super Probe equipped with five wavelength-dispersive spectrometers (WDS). Working conditions were 15 kV of probe voltage, 5 nA of current on sample, and 1 µm beam diameter. Natural minerals were used for standardization; measurement times were 30 s on peaks and 10 s on backgrounds of the X-ray lines.
Raman spectroscopy was applied for feldspar and opaque phase identification and for carbonaceous material (CM) characterization. Data acquisition was conducted at the Department of Chemistry, University of Padua (Italy), using a Thermo Scientific DXR MicroRaman spectrometer, equipped with a 532 nm depolarized laser. Raman analysis was also carried out at the Department of Mathematical, Physical and Computer Sciences of the University of Parma (Italy) using a Jobin Yvon Horiba LabRam spectrometer equipped with He–Ne laser (emission line 473.1 nm) and motorized xy stage. Spectra were acquired from polished thin sections using a laser power of 5 mW, spectrograph aperture 25 µm pinhole, and 50× or 50× short-distance objective. The estimated spot size was 1–2 µm in diameter and the spectral resolution was 2 to 4.4 cm−1, with an acquisition time of 30–90 s. Feldspar composition was classified on the basis of the acquired Raman spectra, as suggested in Freeman et al. (2008), using a comparison with standard Raman spectra from the RRUFF Project database (Lafuente et al., 2016). To assure a good statistical analysis of the CM structural heterogeneity, only samples with >10 CM spectra were taken into consideration. Omnic software (Thermo Fisher Scientific) was used for Raman spectrum decomposition, using the software's Lorentzian/Gaussian function, following the procedure described in Kouketsu et al. (2014). Raman analytical conditions are detailed in the Supplement S1. A discussion about the analytical limitation of the chosen methods for temperature estimation is also presented in the Supplement S1.

Figure 3Polarized light microscope images of the damaged host rock (a) and representative quartz microstructures (b–c). Cross-polarized light is used. (a) Host rock showing the original magmatic textures and mineral assemblage. White arrow shows a chlorite-rich shear band oriented at a low angle to the mylonitic foliation of BFZ045. (b) Quartz with wide extinction bands (WEBs) and undulatory extinction. WEBs are bounded by sets of fluid inclusion trails (FI trail, dashed lines). Intercrystalline deformation bands and well-developed FI trails developed subparallel to the mylonitic foliation. (c) Polygonal recrystallized quartz grains, with small grain size (∼20 µm), forming bands oriented subparallel to the mylonitic foliation. The white arrow shows sutured grain boundaries between magmatic quartz grains, indicative of bulging. Foliation trace is projected as a white line onto the images from the adjacent foliated host rock.
4.1 BFZ045 fault zone structure
A schematic representation of the BFZ045 fault geometry obtained from underground field mapping and detailed characterization along the horizontal PH28 drill core is represented in Fig. 2a. A 10–100 cm wide mylonite with a sinistral sense of shear, oriented 61∕075 (dip ∕ dip direction), hosts a sub-vertical network of cohesive cataclasites with an average orientation of 87∕095 (Fig. 2b). Rodding of quartz and feldspar in the mylonite defines a stretching lineation oriented 10∕168 (plunge ∕ trend; Fig. 2b, c). Slickensides with chlorite mineral striations are abundant throughout BFZ045 and the average orientation of the striations is 07∕169; stepped slickensides indicate a dominant sinistral sense of shear, although striations associated with dextral kinematics have also been observed (Aaltonen et al., 2016; Nordbäck and Mattila, 2018).
A network of veins typically filled with chlorite, quartz, and calcite, as well as chlorite-filled fractures, overprint the mylonite and host rock (Fig. 2a; Aaltonen et al., 2016). The damage zone is localized between 0.5 and 1 m from the fault core, and it is characterized by an increased fracture density towards the fault core, with the average spacing between fractures decreasing from 3 to ca. 0.5 cm. With the term “fault core”, we refer here to the brittle core of BFZ045 defined by cohesive cataclasites that overprint the mylonite. This means that the damage zone of BFZ045 affects both the migmatitic host rock and the BFZ045 mylonite.
In Fig. 2d, representative samples of core PH28 are shown from left to right in a sequence from the damage zone in the host rock to the fault core. The host rock is a coarse-grained veined migmatite (Fig. 2dI). The extent of damage in the host rock was defined by the farthest occurrence of chlorite-filled fractures, identified microscopically as deformation bands associated with visible slip. A total of 12 fractures longer than 5 cm can be observed along the core, of which 7 are within a distance of 10 cm from the fault core (west side of the core). The contact between the host rock and the mylonite is sharp. The millimetre-spaced mylonitic foliation is defined by a compositional layering of alternating quartzofeldspathic domains and mica-rich domains (Fig. 2dII). Multiple slip surfaces marked by 0.5–10 cm thick cataclastic domains overprint the mylonite along the foliation (Fig. 2dIII). Locally, phyllosilicates and trails of opaque minerals define thin (<1 mm thick) anastomosing foliation planes within the cataclasites, which wrap around subangular fragments of the mylonitic precursor. Along a thin (<5 mm thick) slip surface, two pseudotachylyte injection veins intruding the mylonite at a high angle have been observed, which demonstrates the transient seismogenic behaviour of BFZ045. Calcite veins (1–3 mm thick) locally overprint the fault core both at high angle to the foliation and along the slip surfaces.
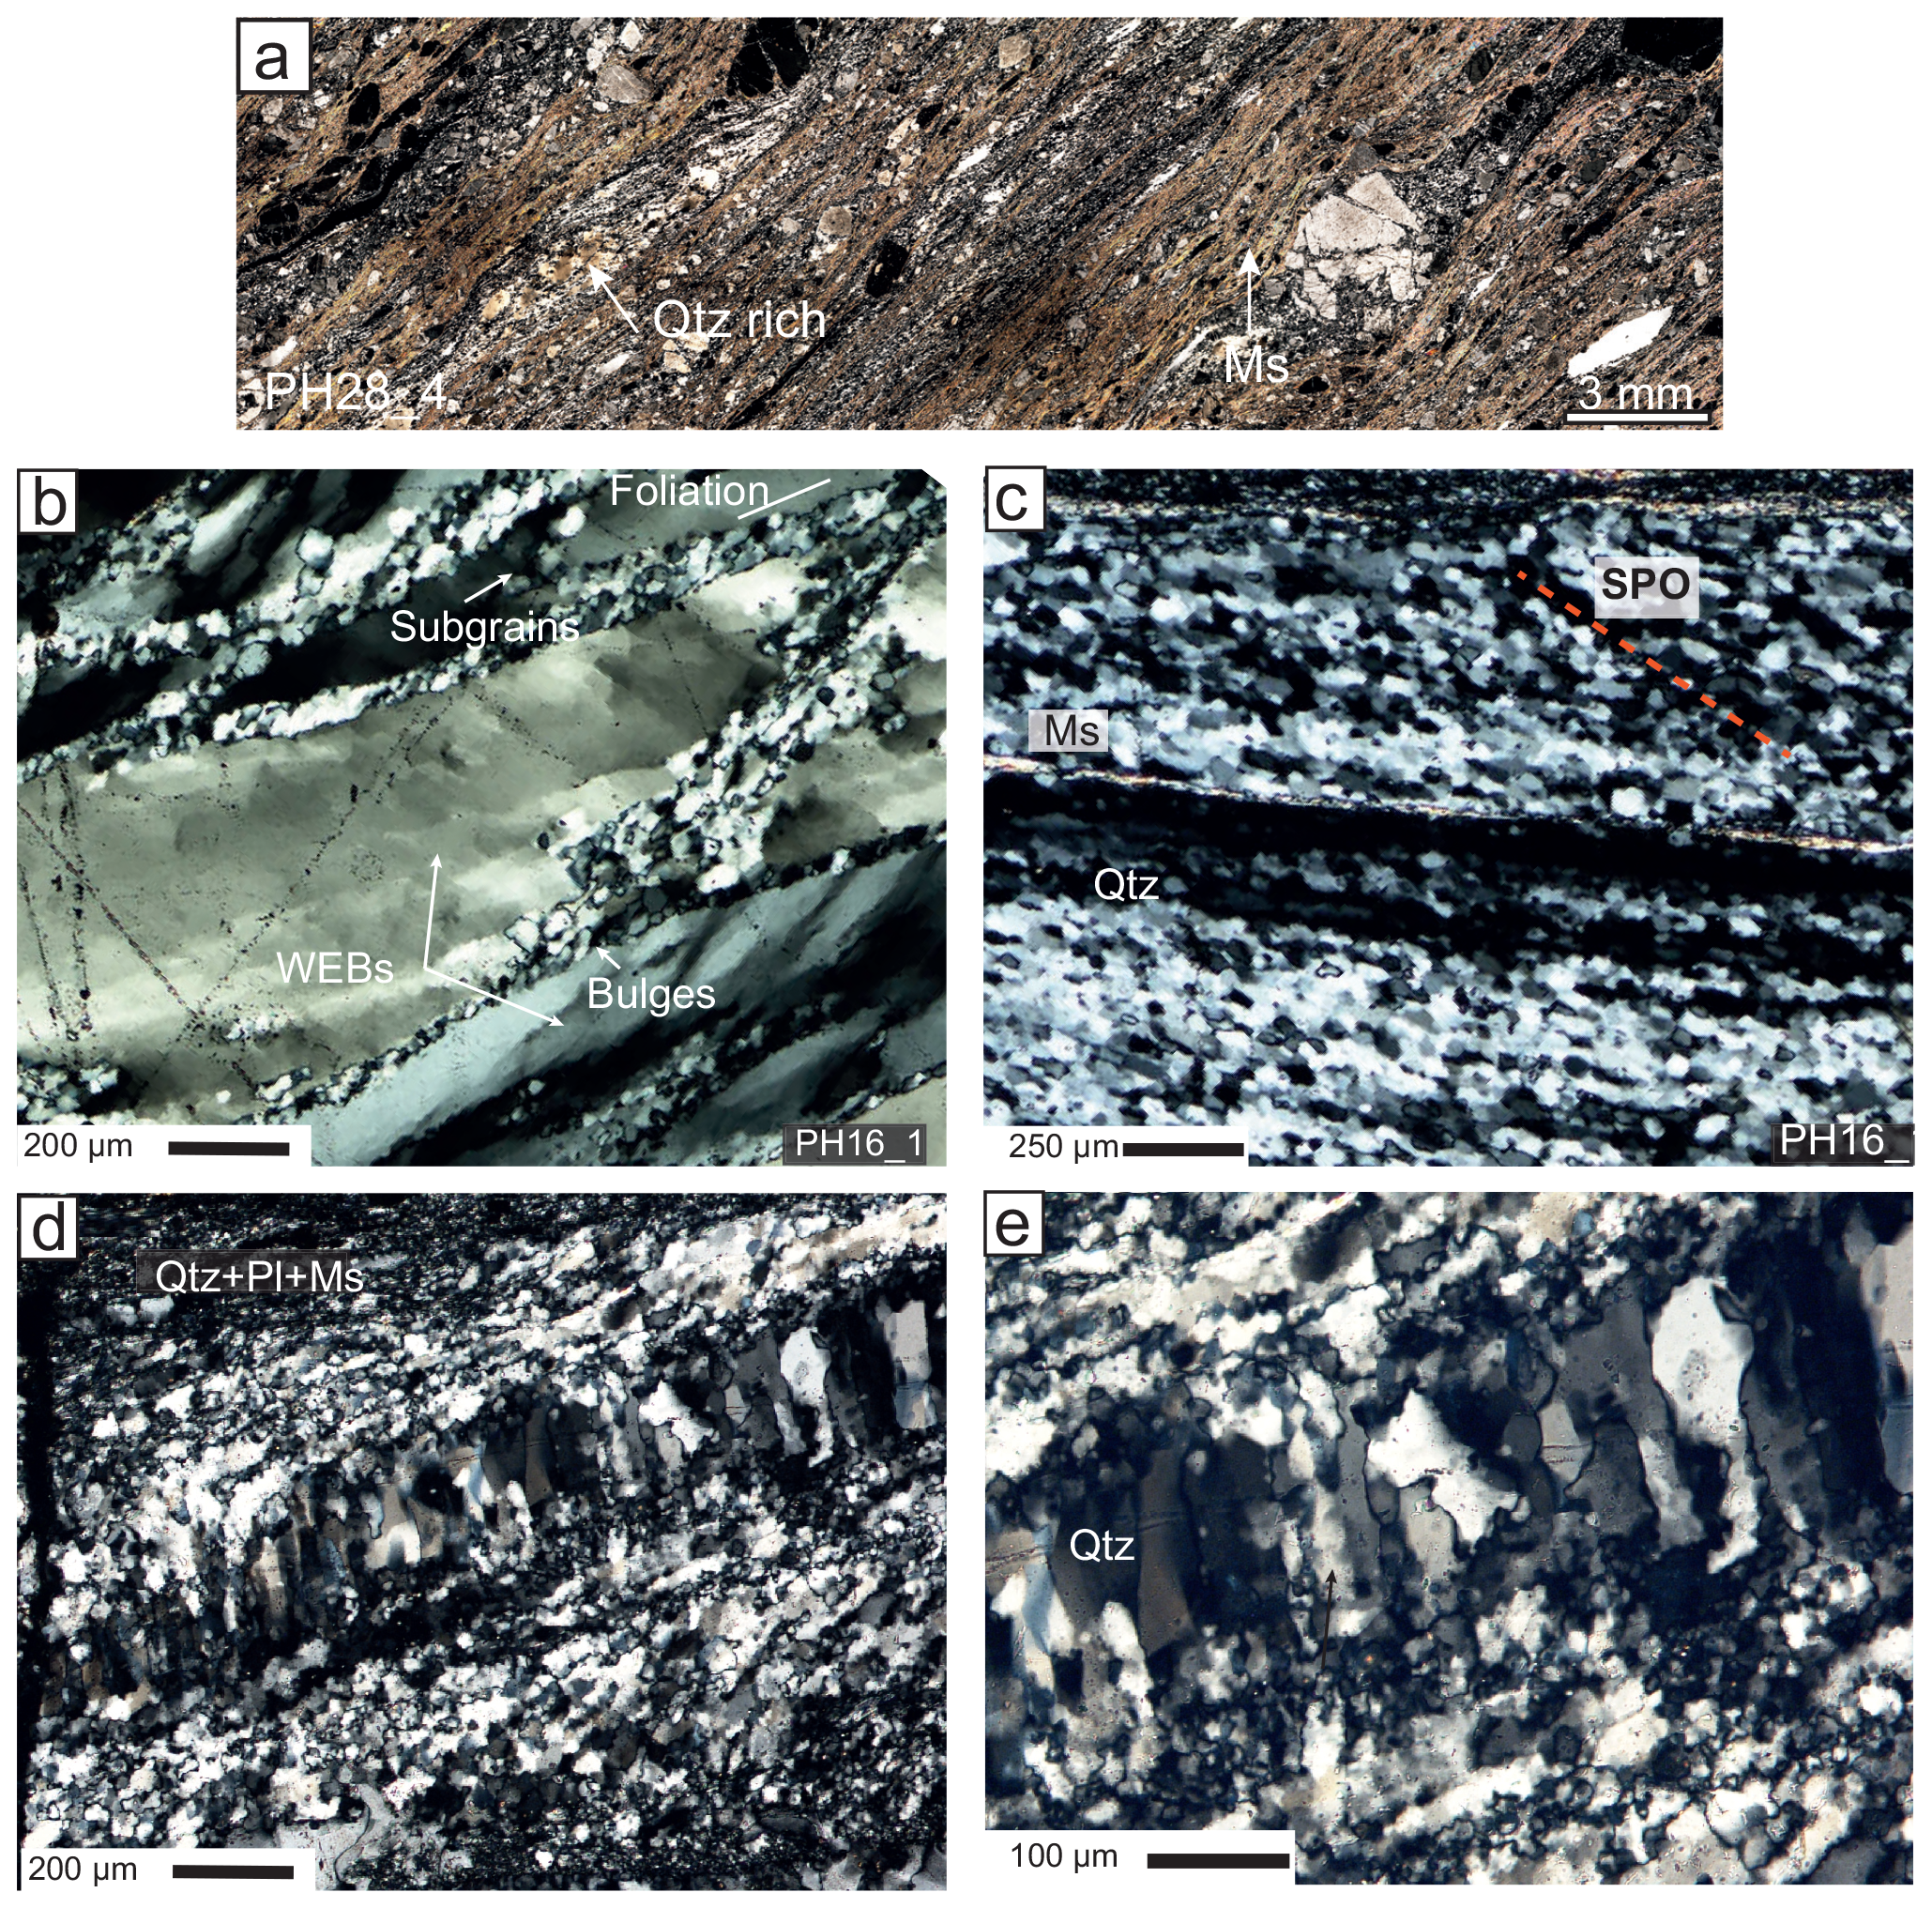
Figure 4Microstructure of the BFZ045 mylonite. Cross-polarized light is used. (a) The mylonitic foliation is defined by the alternation of quartz-rich and mica-rich bands. Fractured porphyroclasts of feldspars are preferentially located in mica-rich domains. (b) Quartz ribbons in the shear zone boundary are stretched along the foliation and show typical core-and-mantle microstructure, with recrystallization localized at the grain boundaries. Ribbons also contain well-developed WEBs. (c) Completely recrystallized quartz ribbon. The recrystallized grains show a shape preferred orientation indicating a sinistral sense of shear. Thin muscovite (Ms) layers define the mylonitic foliation, together with the elongated and recrystallized quartz domains. (d) Quartz veins along the foliation, filling a mode I fracture at a distance of ∼1 cm from the cataclasite fault core. Quartz grain elongation in the veins is normal to the vein wall and to the foliation. (e) High-magnification view of the quartz vein. Bulges along the grain boundaries, and subgrains within the grains, are visible.
4.2 Petrography and microstructures
4.2.1 Host rock
The migmatitic host rock mineral assemblage observed in the PH28 samples consists of 50 % of quartz; 40 % of K-feldspar and plagioclase; and the remaining 10 % of white mica, graphite, alteration minerals of plagioclase (sericite) and secondary chlorite, and calcite veins. Coarse-grained (1–2 mm) quartz and feldspars are homogeneously distributed in an equigranular texture and show mostly straight grain boundaries (Fig. 3a). K-feldspar occurs as orthoclase, with a well-developed veined perthitic texture. Plagioclase, albitic in composition as determined from Raman analysis, has lamellar twinning and is commonly altered to sericite. Both types of feldspar locally show bent twin lamellae and undulose extinction. Microfractures in feldspars are preferentially oriented parallel and at low angle (≤20∘) to the mylonitic foliation. White mica was observed occasionally as millimetric sub-euhedral grains. Quartz displays intracrystalline deformation features such as undulatory extinction, wide extinction bands (WEBs, following the terminology by Derez et al., 2015; Fig. 3b), and bulges resulting in sutured grain boundaries (Fig. 3c; Stipp and Kunze, 2008). WEBs are locally bounded by fluid inclusion trails with different orientations, which give them a blocky or slightly elongated aspect (Fig. 3b–c). Two main sets of intracrystalline fluid inclusion trails are observed: one at a low angle with respect to the mylonitic foliation and the other perpendicular to the foliation. Fine bulges (10–20 µm in size) occur along grain boundaries and intercrystalline fractures (Fig. 3b). Quartz grains in the proximity of the mylonite (sample PH28-2, Fig. 2b) develop intracrystalline bands of recrystallized grains subparallel to the foliation, with grain sizes of ∼30–60 µm (Fig. 3c). Shear bands in the deformed host rock appear as cohesive micro-cataclasites, with fine grained (<10 µm) chlorite surrounding angular feldspar and quartz clasts.
4.2.2 Mylonite
The relative mineral abundances in the mylonite are slightly different from those in the host rock and consist of 50 % quartz, 20 % white mica + chlorite, and 30 % K-feldspar + plagioclase. Accessory phases are graphite, rutile, anatase, and apatite, which are typically found associated with chlorite to form black seams. The spaced mylonitic foliation is defined by a compositional layering between alternating millimetre-thick quartz bands and narrower (0.2 to 1 mm thick) mica- and feldspar-rich bands (Fig. 4a). Porphyroclasts of K-feldspar are up to 7 mm in size and show asymmetric pressure shadows filled with chlorite + muscovite ± feldspars (albite and K-feldspar), with a geometry indicative of a sinistral sense of shear. Feldspars in the mylonite present brittle behaviour, with domino-type fragmented porphyroclasts. Neoblasts of K-feldspar are commonly observed in the pressure shadows of porphyroclasts or together with fine-grained white micas along the mylonitic foliation.
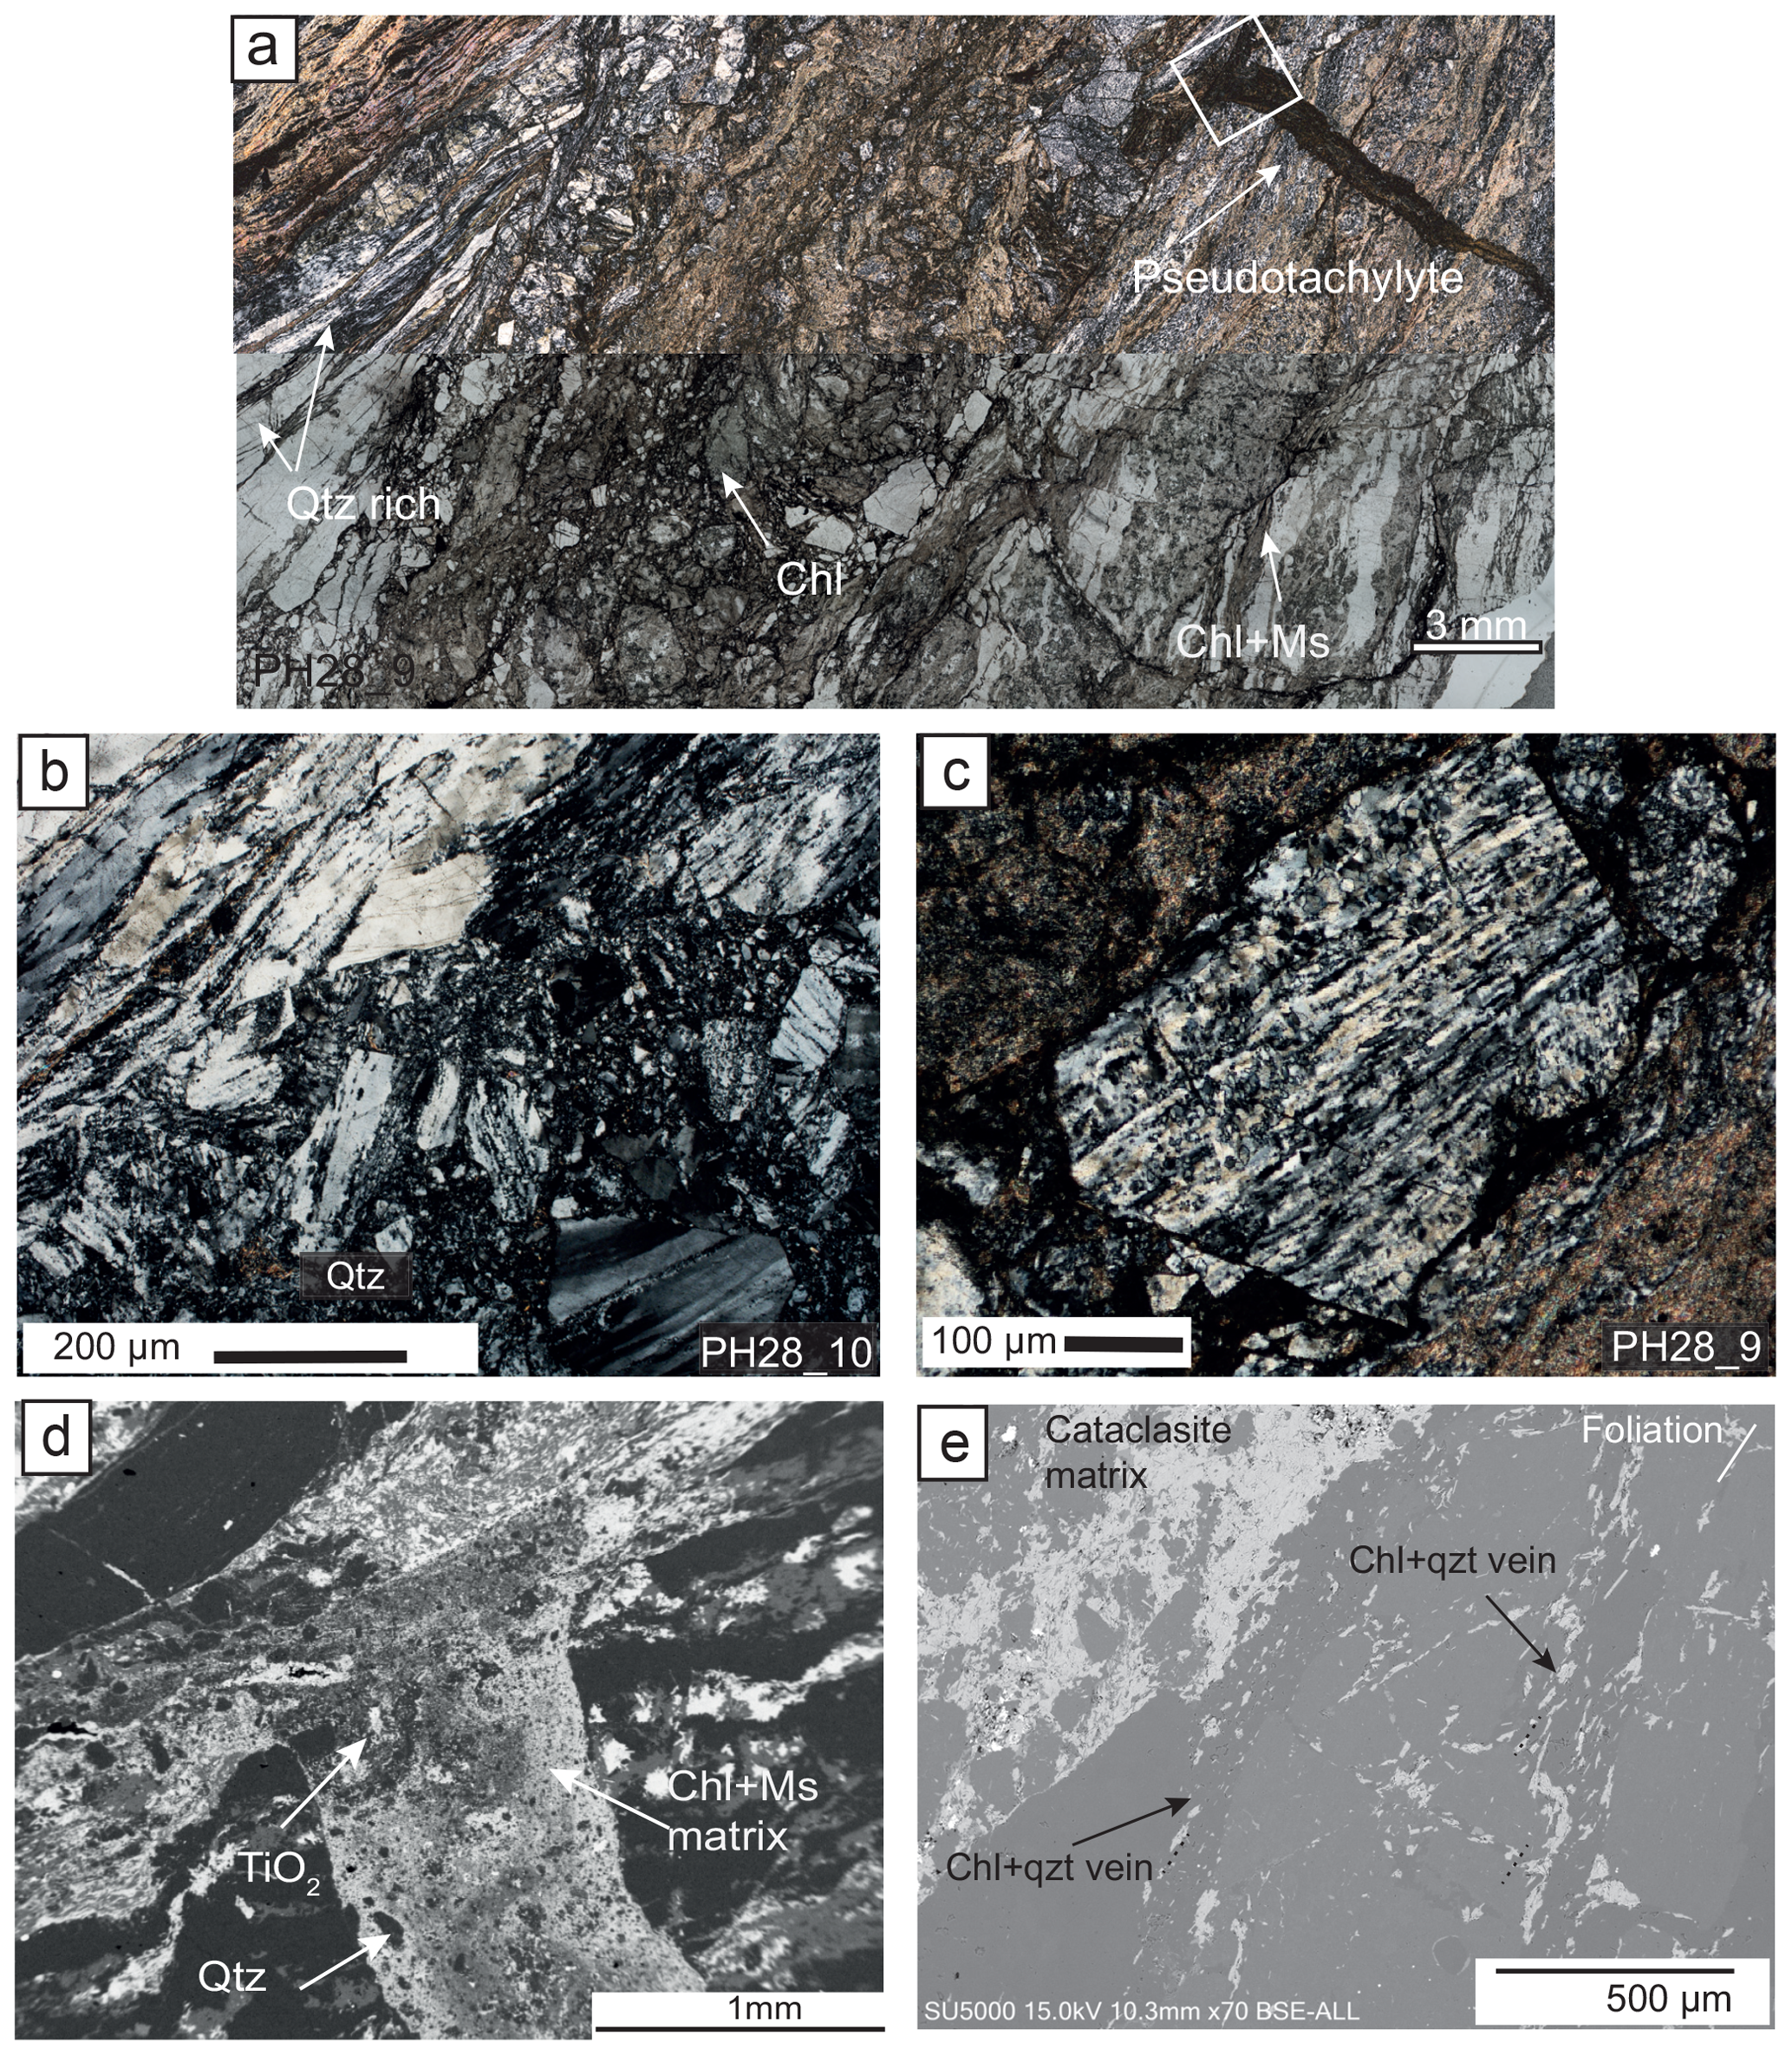
Figure 5Microstructure of the BFZ045 brittle fault core. Cross-polarized light (a–c), plane-polarized light (a), and scanning electron microscope backscatter electron images (SEM-BSE) (d–e). (a) Cataclasite with characteristic pseudotachylyte injection veins (arrow). The cataclasite matrix is enriched in chlorite and Ti oxides. (b) Contact between the mylonite (upper left corner) and the cataclasite. Quartz forms almost entirely recrystallized polycrystalline ribbons. (c) Detail of a subangular polycrystalline clast of quartz in the cataclasite. The trace of the mylonitic foliation is still visible in the clast, and it is only slightly rotated with respect to the trace of the foliation in the mylonite. The surrounding matrix is a fine mixture of white mica and plagioclase. (d) Pseudotachylyte injection vein. Rounded quartz clast (dark grey) and Ti oxides (white) are surrounded by a chlorite- and mica-rich ultrafine-grained matrix. (e) Quartz + chlorite aggregates filling fractures within and strain shadows around plagioclase porphyroclast in the mylonite. The clast is slightly rotated within the protocataclasite. The white line in the top right corner indicates the trace of the mylonitic foliation.
Quartz in the mylonite presents various degrees of recrystallization (Figs. 4b, c). In zones where ductile deformation is less prominent (e.g. samples PH28_3, PH16_1; Fig. 2), quartz retains a coarser grain size (1–5 mm), and it forms slightly asymmetric (sigmoidal shaped) grains. Internally, the grains display patchy undulatory extinction, well-developed blocky to elongated WEBs (100–300 µm wide), and discrete intracrystalline bands (<200 µm wide) of bulges and recrystallized grains preferentially oriented subparallel to the foliation and at ca. 45∘ from the foliation, measured anticlockwise (Fig. 4b). The host grains contain small subgrains (<60 µm), which, towards the boundaries of the host grain, transition to aggregates of recrystallized grains of sizes comparable to the subgrains, forming typical core-and-mantle microstructures (Fig. 4b).
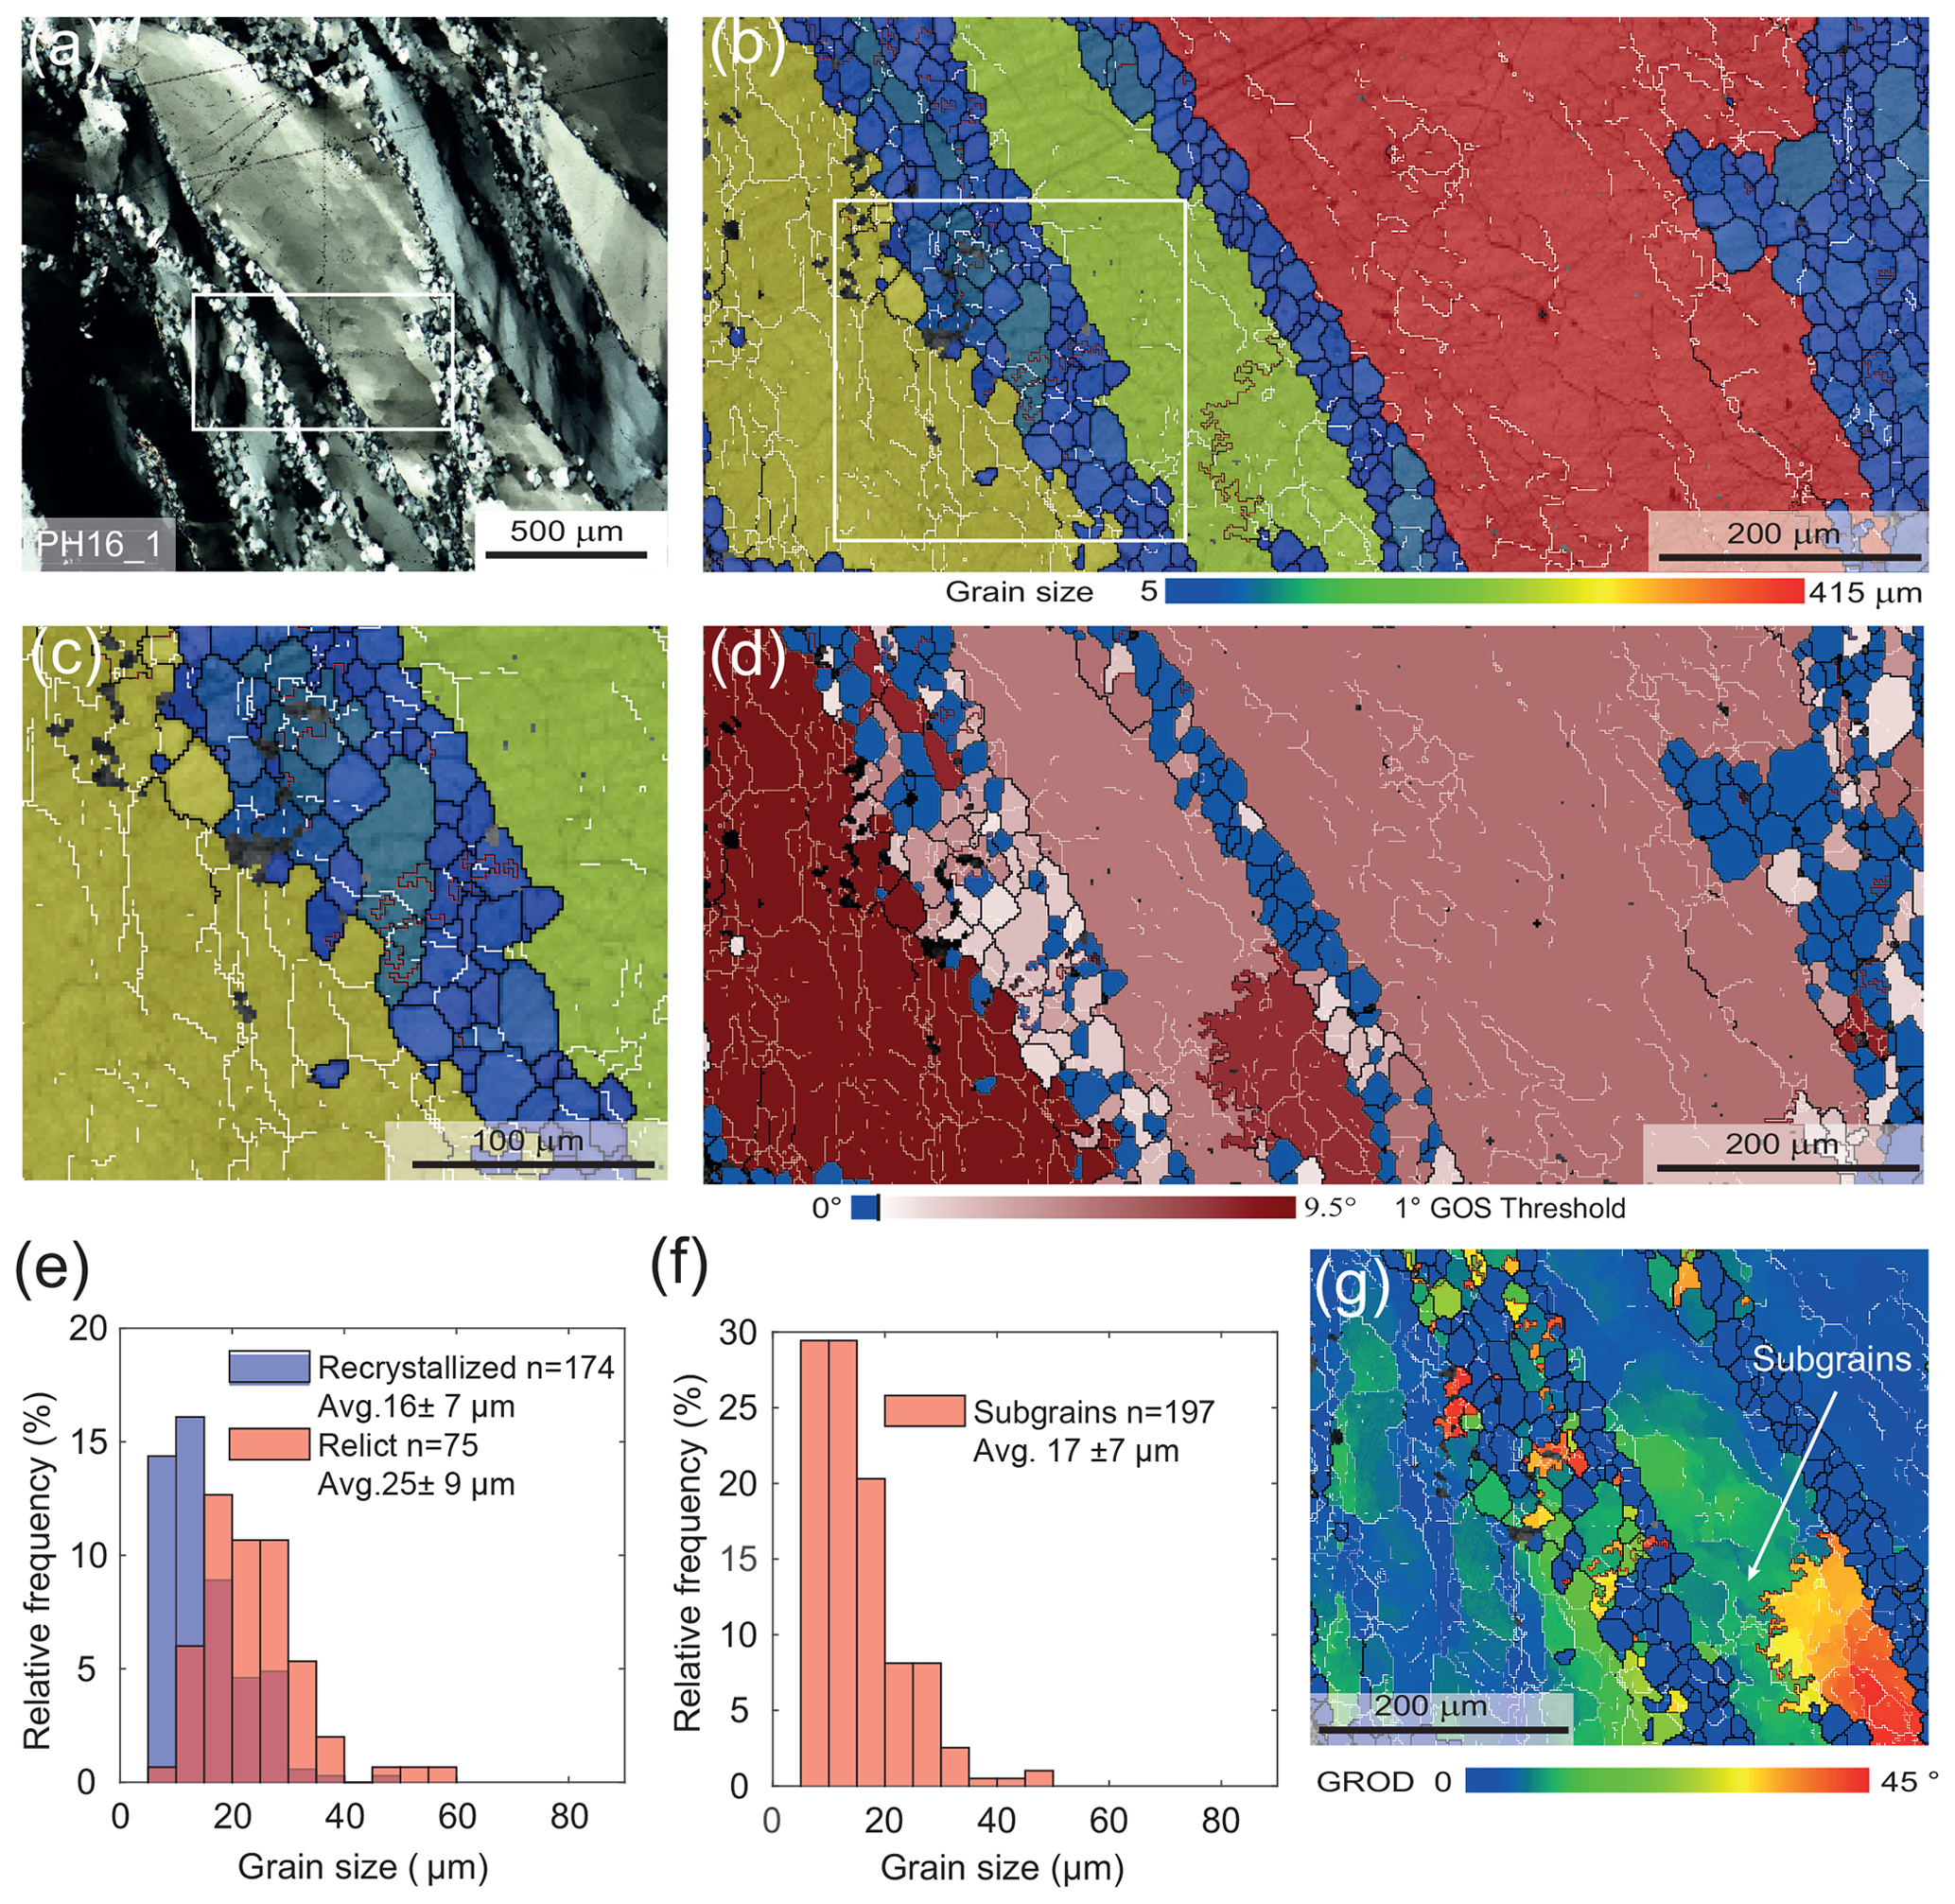
Figure 6EBSD data of quartz from the mylonitic fault core. In all the EBSD maps, black lines correspond to high-angle boundaries (misorientation >10∘), white lines to low-angle boundaries (misorientation between 2∘ and 10∘), and red lines to Dauphiné twin boundaries (misorientation of 60∘ around the c axis). (a) Quartz ribbons and intracrystalline bands of recrystallized grains (Fig. 5a). Cross-polarized light is used. The box indicates the EBSD map shown in (b)–(d) and (g). (b–c) Grain size map (diameter of the equivalent circle in micrometres, µm), the higher magnification in (c) highlights the presence of subgrains in the large relict quartz grains and in the recrystallized grains. (d) Grain orientation spread (GOS) for each grain coloured relative to the GOS threshold (black line) between recrystallized (blue) and relict (red) grains. (e) Histogram of grains size distribution of grains in the intercrystalline bands. (f) Histogram of subgrain size distribution of subgrains in the relict quartz from the intercrystalline bands (light red in d). (g) Grain relative orientation distribution (GROD) maps were used to estimate visually the subgrain size in the quartz ribbon.
In zones of complete recrystallization, quartz forms highly elongated polycrystalline ribbons (up to 0.5–1 mm thick and up to 2 cm long) parallel to the foliation (Fig. 4c). The recrystallized grains locally define a shape preferred orientation (SPO in Fig. 4c) inclined with 10 to 30∘ with respect to the trace of the foliation, consistently with the bulk sinistral sense of shear. Adjacent to the cataclastic fault core (sample PH16_3, Fig. 2), ataxial/unitaxial (i.e. with no visible median line; Bons, 2012) quartz veins occur parallel to the mylonitic foliation (and to the layers of recrystallized quartz) and contain grains elongated normal to the vein boundary (i.e. normal to the foliation; Fig. 4d). The vein crystals range in length from 200 to 400 µm and have a maximum thickness of 150 µm measured parallel to the vein. Quartz in the veins shows undulatory extinction and bulges at the grain boundaries (Fig. 4e) indicative of crystal plastic deformation. The recrystallized quartz in the mylonite surrounding the vein has a finer grain size than the one in the mylonite described in Fig. 4a–c, which is located farther away from the cataclastic core. Veins of radiate chlorite are observed cutting the mylonitic foliation at a high angle (∼60∘).
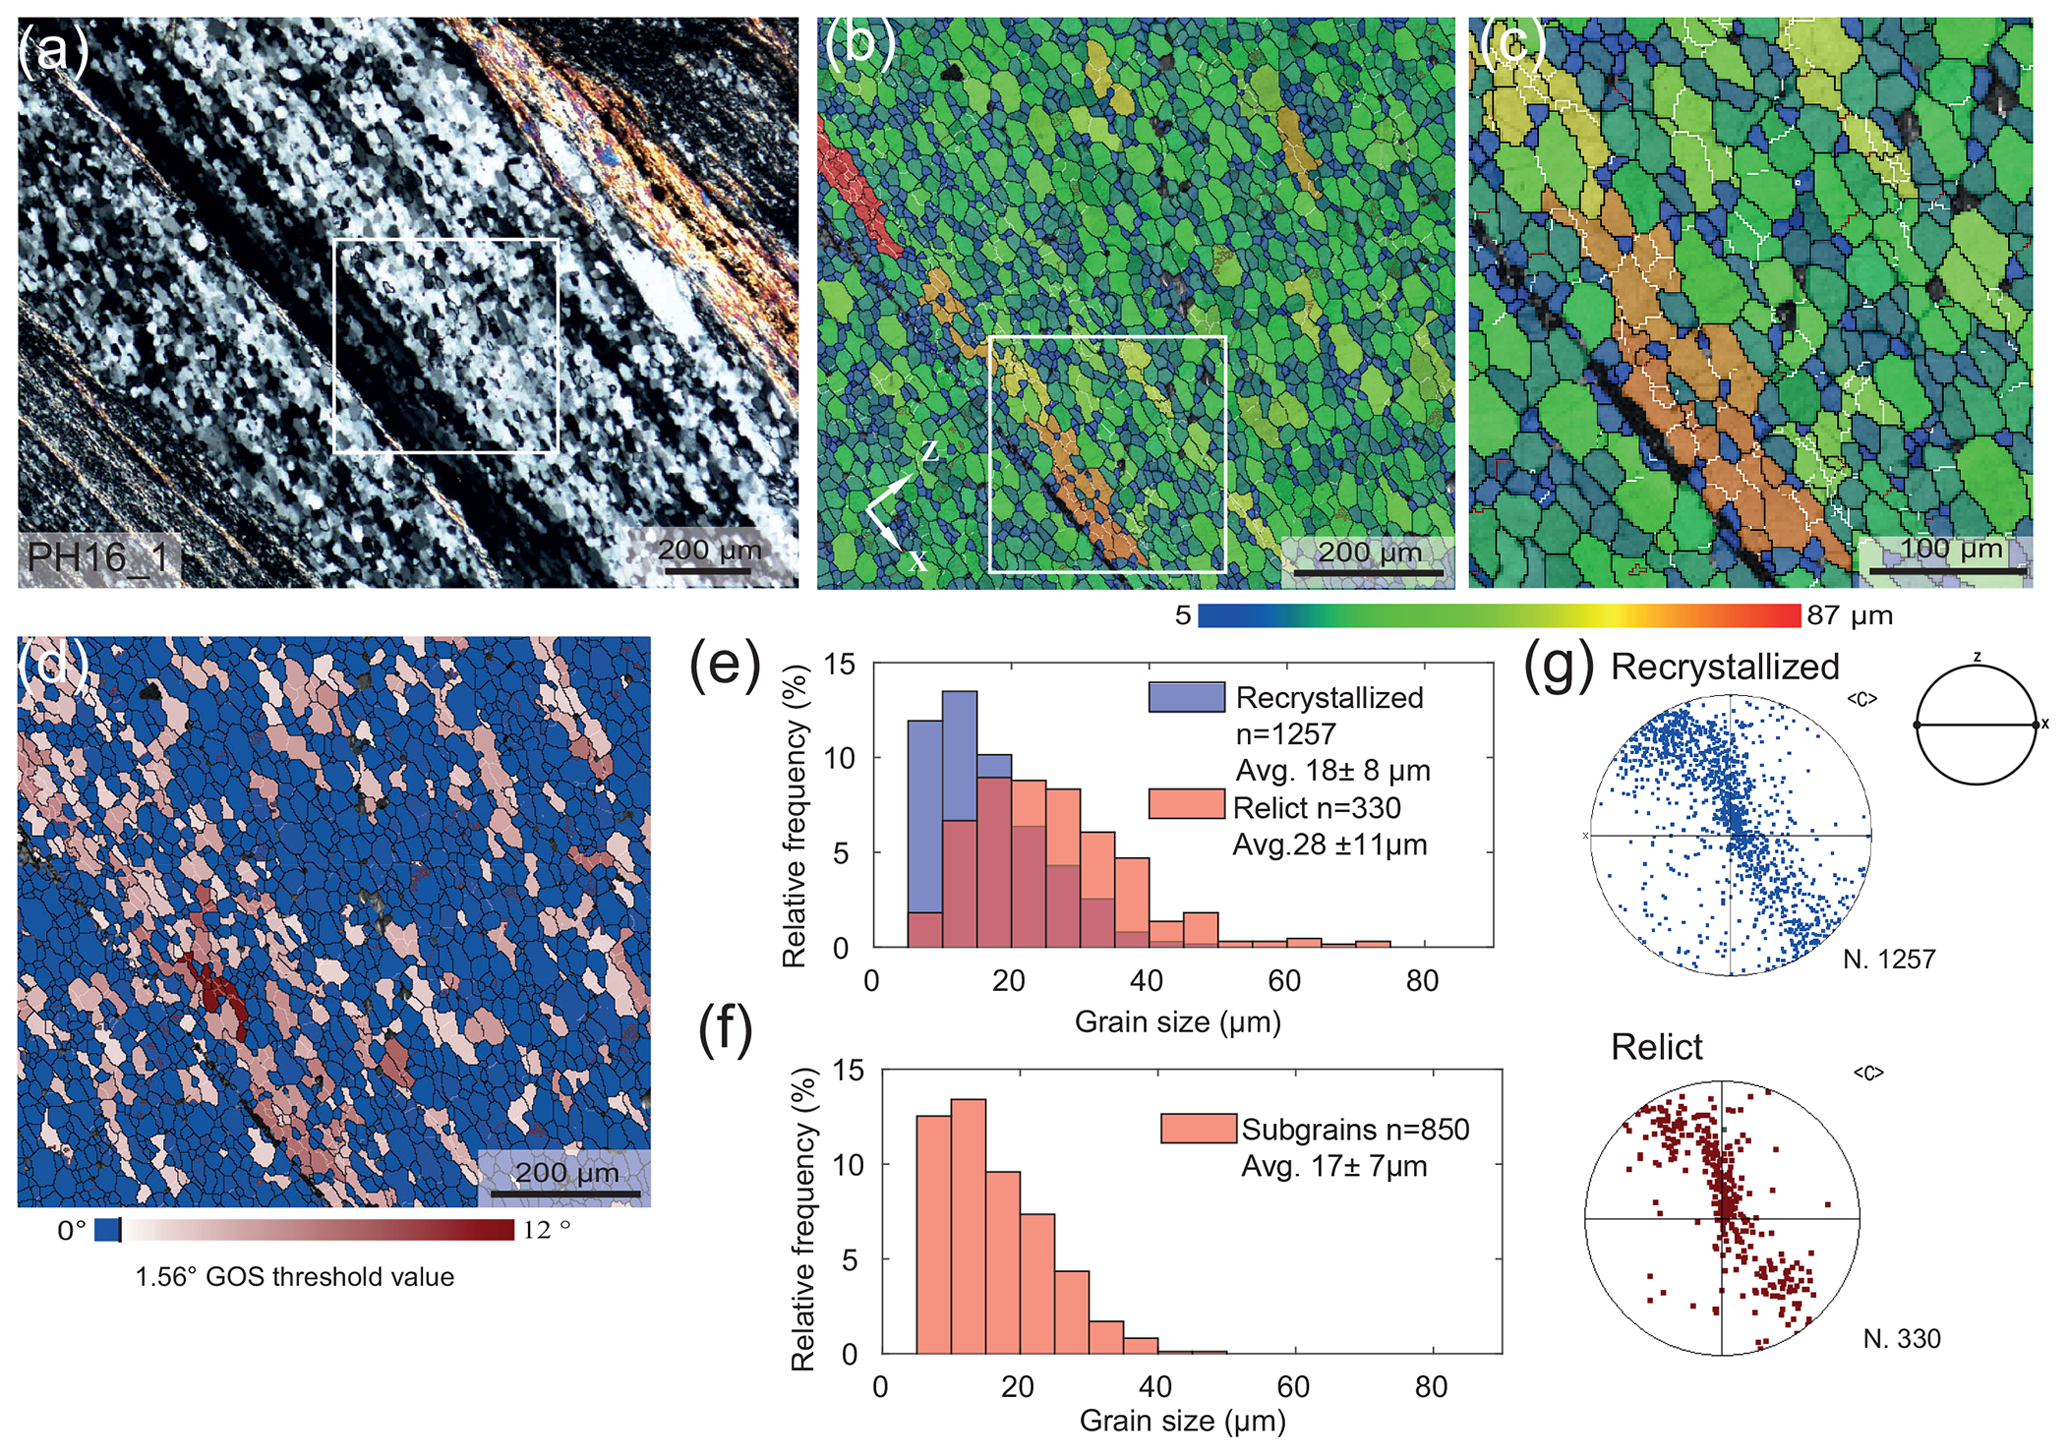
Figure 7EBSD data of quartz from a recrystallized ribbon in the mylonite. (a) Polycrystalline ribbons of recrystallized quartz grains elongated parallel to the mylonitic foliation (Fig. 5b). Cross-polarized light is used. The box indicates the EBSD maps shown in (b)–(d). Colour coding of the boundaries like in Fig. 6. (b, c) Grain size map (diameter of the equivalent circle in micrometres, µm) and detail (c) showing that the larger grains contain subgrains of the same size as the surrounding finer grains. (d) GOS map showing that the GOS values are mostly under the threshold, indicative of high degree of recrystallization. (e) Histogram of the grain size distribution for recrystallized and relict grains. (f) Histogram of the subgrain size distribution in the relict quartz grains identified in (d) and (e). (g) Pole figure of the c-axis orientation of recrystallized and relict grains, colour coded like the GOS map in (d) (equal area, lower-hemisphere projection).
4.2.3 Cataclasite
The brittle overprint in BFZ045 occurs mostly as 3–10 cm thick protocataclasites that transition to 0.5–2 cm thick cataclasite bands in the fault core. The cataclasite is rich in chlorite and opaque minerals, which occur as fine-grained (2–10 µm) flaky aggregates within the fine-grained (<50 µm) matrix rich in quartz + feldspars + muscovite. Locally, the cataclasite matrix contains a foliation defined by aligned phyllosilicates and anastomosing dark seams of opaque minerals. Clasts are predominantly angular fragments of the mylonite, ranging in size from 100 µm to 5 mm, and surrounded by a variable proportion of matrix (Fig. 3a–c). Quartz in the protocataclasite occurs as almost entirely recrystallized ribbons with a finer grain size (ca. 10 µm) than the one observed at greater distances from the brittle fault core (Fig. 5b–c vs. Fig. 4b–c). The quartz clasts in the cataclasite (Fig. 5c) preserve the deformation and recrystallization microstructures observed in the mylonite in close proximity to the cataclasite (Fig. 5b).
A pseudotachylyte generation surface is observed subparallel to a cataclastic band (Fig. 5a), and it is identified from characteristic centimetric injection veins, branching in the mylonite at high angle to the foliation. The pseudotachylyte main generation surface is less than 1 mm thick and is parallel to the mylonitic foliation (Fig. 5a, d). The matrix of the pseudotachylyte is completely altered to a fine-grained, <2 µm, matrix rich in chlorite and muscovite that surrounds survivor clasts of quartz and rutile (Fig. 5d). Chlorite and quartz aggregates commonly fill fractures within feldspar porphyroclasts in the mylonite. Similar fractured feldspar porphyroclasts with quartz + chlorite fillings are observed inside slightly rotated clasts of mylonite in the protocataclasites (Fig. 5e).
4.3 EBSD and grain size analysis of quartz
4.3.1 Mylonite
EBSD analysis of the mylonite was conducted on sample PH16_1, which is located at the mylonitic shear zone boundary at a distance of 4 cm from the brittle fault core (Fig. 2a). EBSD maps were acquired from intracrystalline bands of recrystallized grains within an elongated millimetre-sized quartz grain (Fig. 6a) and from a highly recrystallized quartz layer along the mylonitic foliation (Fig. 7a). The recrystallized grain size within the intracrystalline bands ranges from 5 to 60 µm (Fig. 6b, c). The grain orientation spread (GOS) within the recrystallized bands varies between 0 and 8.4∘, with a threshold value of 1∘ between the recrystallized grains and the relict grains when analysing the trade-off curve proposed by Cross et al. (2017). The average grain size of recrystallized grains (GOS <1∘) is 16±7 µm, whereas relict grains (GOS >1∘) have an average grain size of 25±9 µm. Relict grains contain subgrains of an average size of 17±7 µm (Fig. 6f). Quartz grain hosting the intracrystalline band shows subgrains of approximately 25–50 µm in size, which is comparable to the size of the coarser recrystallized grains observed in the intracrystalline bands (Fig. 6c). The size of the subgrains in the host quartz was estimated visually with the aid of grain relative orientation distribution maps (GROD, Fig. 6g).
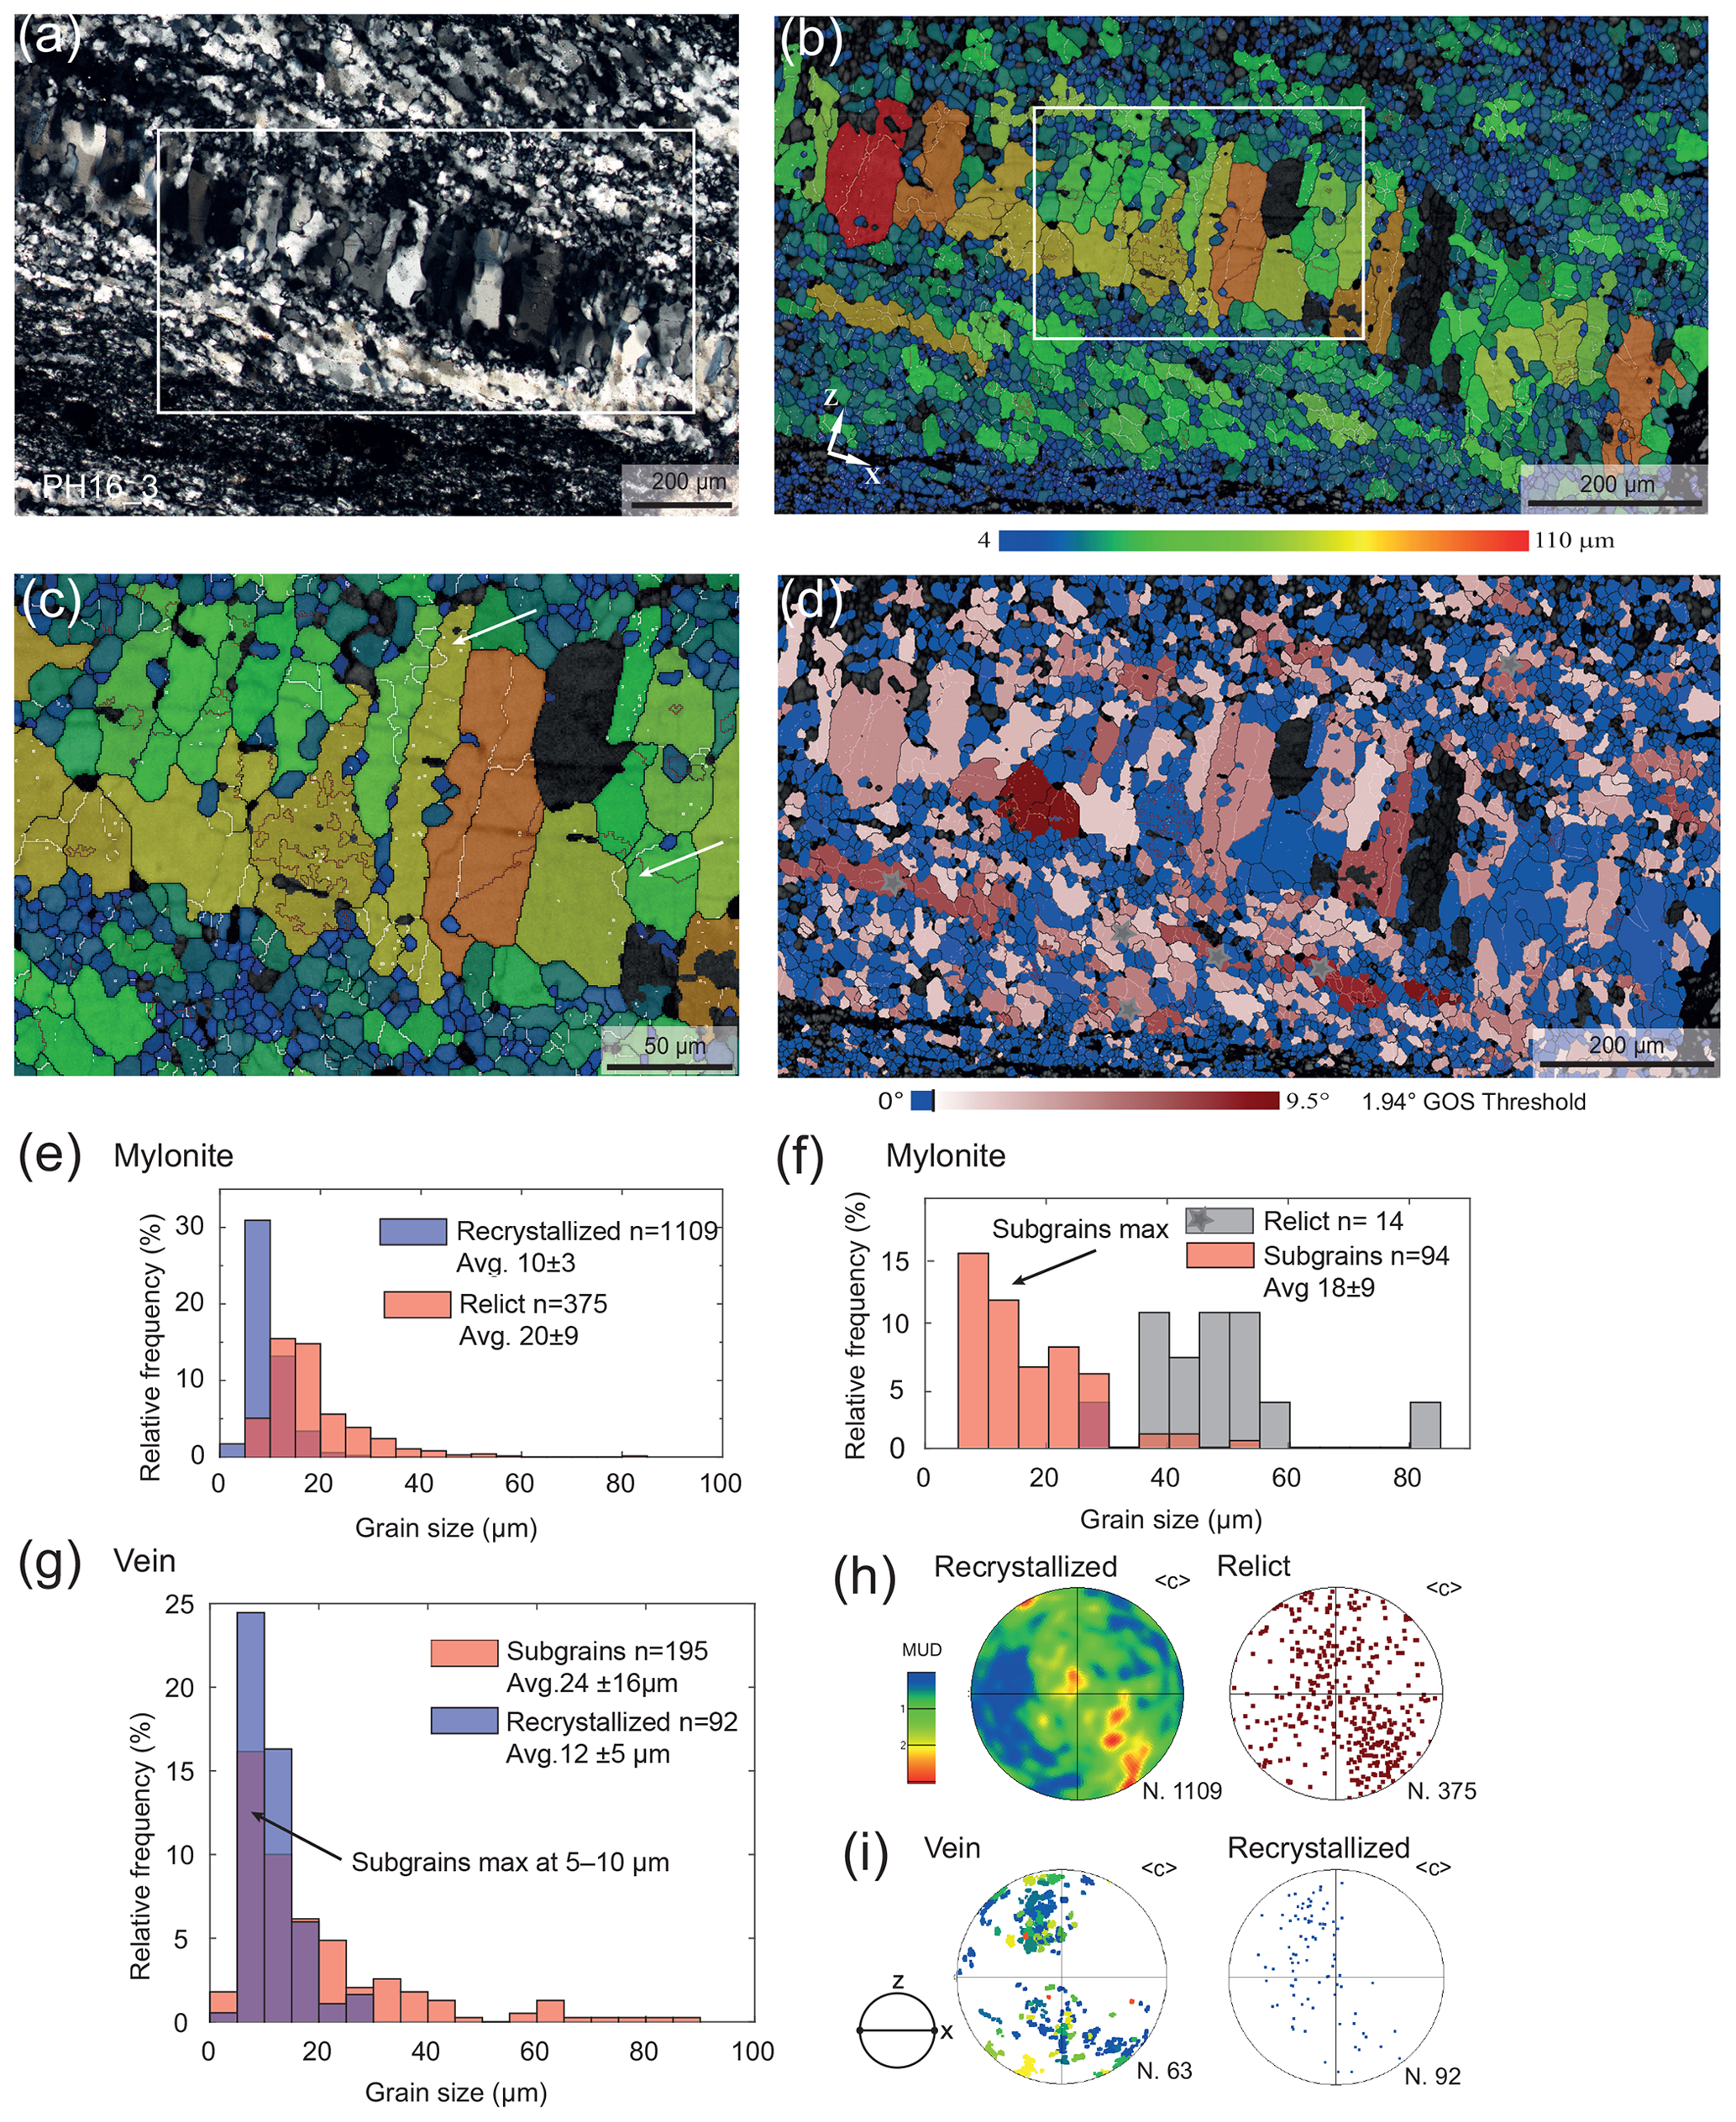
Figure 8EBSD data of quartz from a foliation-parallel vein in the mylonite near the contact to the cataclasite. Colour coding of the boundaries like in Fig. 6. (a) Quartz vein along the foliation. Quartz in the mylonite shows a strong SPO consistent with the sinistral sense of shear of BFZ045. Cross-polarized light is used. (b) Grain size map (diameter of the equivalent circle in micrometres, µm). (c) Details of previous maps. Bulges and subgrains (white arrows) of similar size of the bulges are evident within the quartz vein. (d) GOS map of quartz in the vein and of the surrounding mylonite. The GOS threshold value of 1.94∘ separates relict grains (red) from recrystallized grains (blue). Grey stars indicate relict grains plotted in (f) for subgrain size estimates. (e) Histogram of the grain size distribution in the mylonite, with relict and recrystallized grains separated with the GOS method. (f) Histogram of the subgrain size distribution (red) in relict quartz of the mylonite (grey). (g) Histogram of the recrystallized grain size (red) and subgrains size (blue) distribution in the vein. (h–i) Pole figures of the c-axis orientation of the recrystallized and relic quartz in the mylonite (h) and in the veins (i) (equal area, lower-hemisphere projection).
In the recrystallized quartz layer (Fig. 7a), quartz grain shapes range from equant to elongate parallel to the foliation, with grain sizes ranging from 5 to 87 µm (Fig. 7b, c). GOS analysis identified a threshold value of 1.56∘ to separate recrystallized and relict grains (Fig. 7d). Average grain size of the recrystallized grains is 18±8 µm, while relict grains have an average size of 28±11 µm (Fig. 7e). The relict grains contain subgrains of an average size of 17±7 µm (Fig. 7c, f). The crystallographic preferred orientation (CPO) of the c axis of the relict grains and recrystallized grains forms a single girdle consistently inclined with the sinistral sense of shear of the sample (Fig. 7g). The EBSD-calibrated recrystallized grain size piezometer for quartz by Cross et al. (2017) was used to estimate the differential stresses during plastic flow in the mylonite. The estimated differential stress is 73–80 MPa for the average recrystallized grain size of 16–18 µm.
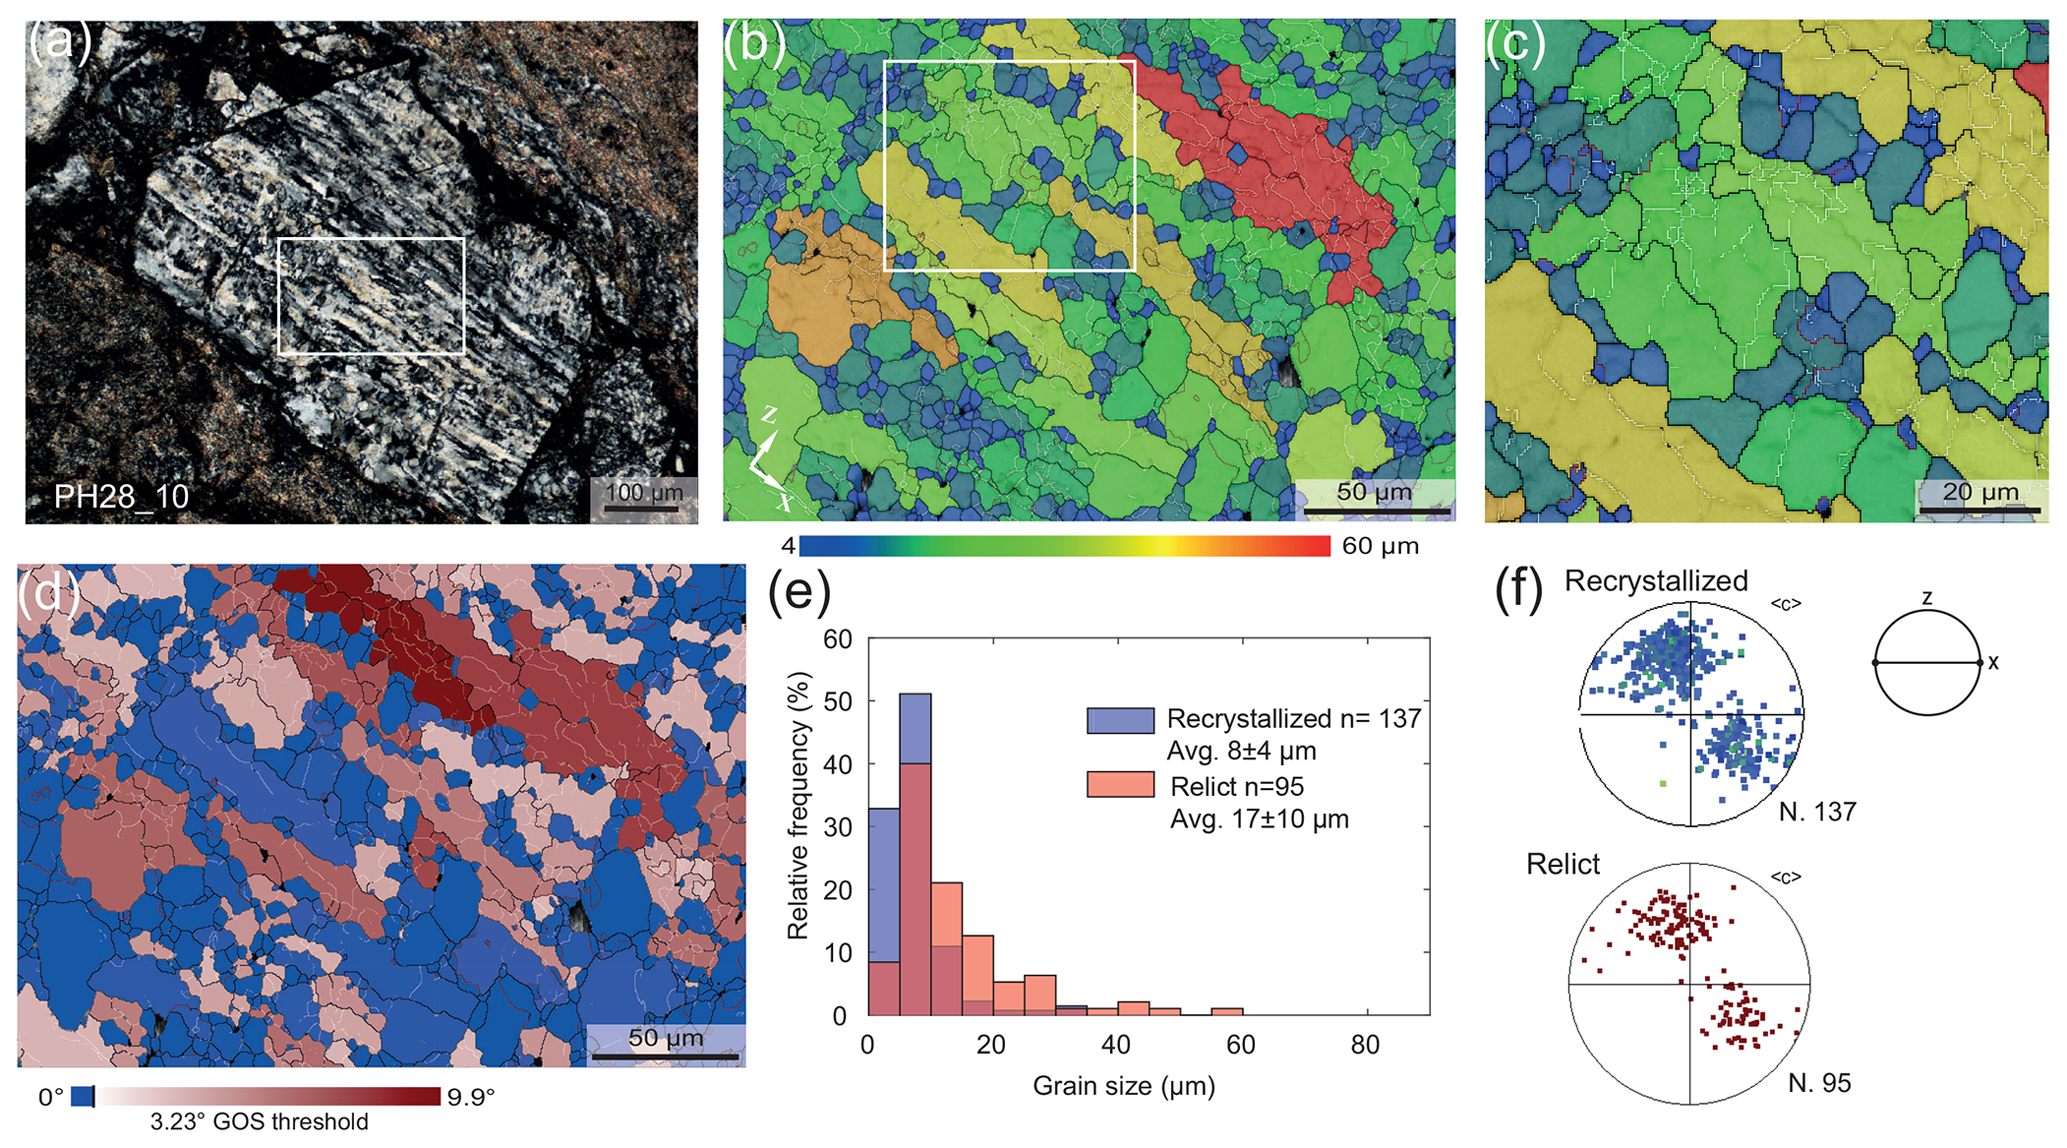
Figure 9EBSD data of quartz from a clast in the cataclasite. Colour coding of the boundaries like in Fig. 6. (a) The analysed quartz clast (Fig. 5f). The white rectangle indicates the EBSD map shown in (b)–(d). (b)–(c) Grain size map (diameter of the equivalent circle in micrometres, µm). The map highlights the presence of subgrains in the coarser elongated quartz grains with size comparable to the surrounding finer quartz. (d) GOS map. (e) Histogram of the grain size distribution of the recrystallized (blue) and relict (red) grains. (f) Pole figure of the c-axis orientation of recrystallized and relict grains. (equal area, lower-hemisphere projection, colour coded as GOS map).
4.3.2 Veins parallel to the mylonitic foliation
The quartz vein parallel to the foliation shown in Figs. 5c and 8a was analysed to identify possible evidence of crystal-plastic deformation and dynamic recrystallization. Grain shape varies from fibrous with elongation perpendicular to the vein wall to more equant and less elongate. Grain boundaries of vein crystals are straight to lobate, which is the latter most commonly observed in association with fine recrystallized grains and bulges (<15 µm in size) (Fig. 8b, c). Irrespective of their shape, most of the grains contain low-angle boundaries and Dauphiné twins. The low-angle boundaries are typically arranged to define polygonal to slightly elongated domains of ∼10 µm in size, comparable to that of the surrounding recrystallized grains in the mylonite (Fig. 8c).
Quartz in the mylonite flanking the vein shows a fine grain size (<20 µm), with only a small fraction of coarser grains (30–60 µm). GOS analysis indicates that dynamic recrystallization is pervasive. The mean recrystallized grain size is 10±3 µm, and the relict average grain size is 20±9 µm, with a GOS threshold value of 1.94∘ (Fig. 8d, e). Selected relict grains (size >40 µm) in the mylonite contain subgrains with sizes in the range of 5 to 25 µm (Fig. 8f). Finer grains observed within the vein also present a GOS value below the threshold, which suggests that they represent the recrystallized fraction in the quartz vein (Fig. 8c, f). In the quartz vein, GOS analysis indicates that the average subgrain size is 24±7 µm, although the largest fraction of subgrains is smaller than 15 µm, i.e. similar in size to the recrystallized grains in the flanking mylonite and in the vein itself. The c-axis CPO of the recrystallized grains in the mylonite forms a single girdle synthetically inclined with the sinistral sense of shear (Fig. 8h). The c-axis CPO of recrystallized grains in the veins overlaps with the one of the relict grains (Fig. 8i). The differential stress estimated from the average recrystallized grain size in the mylonite (10 µm) is 106 MPa.
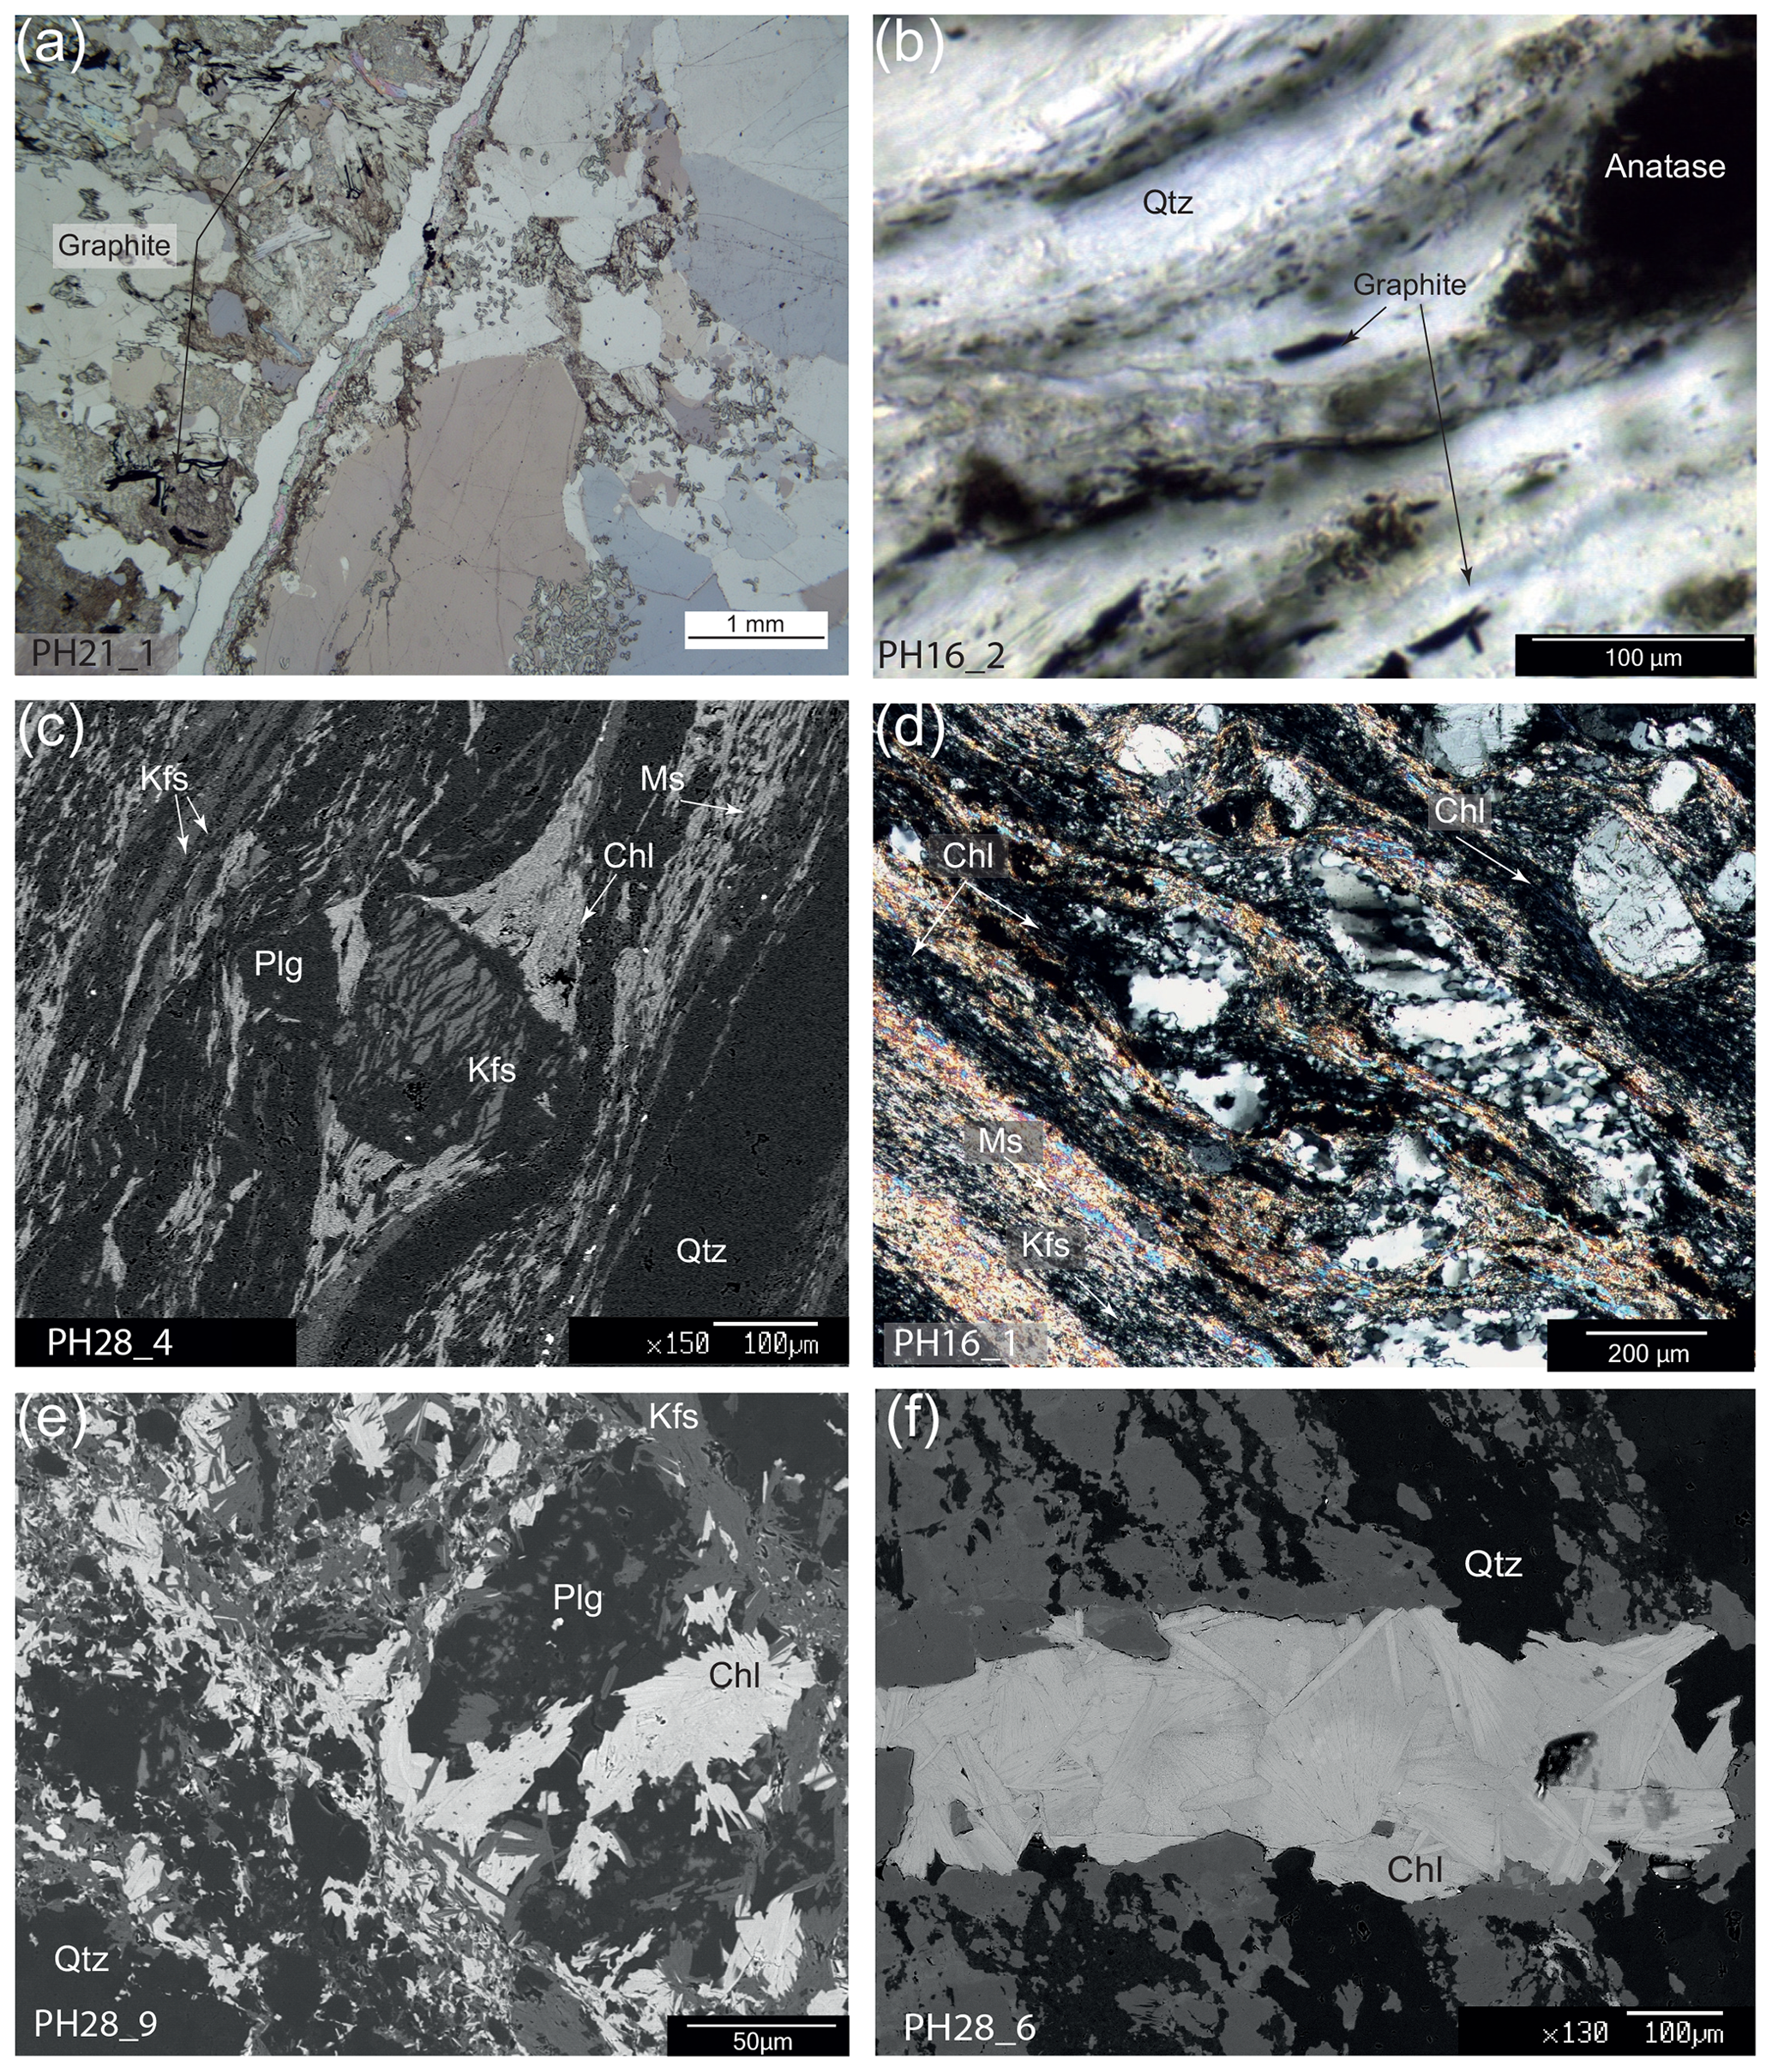
Figure 10Light microscopy and SEM backscattered electron (BSE) images of characteristic microstructural domains and mineral assemblages used for geothermobarometry estimates. (a) Graphite flakes in association with radiate chlorite in the host rock. Plane-polarized light is used. (b) Detail of graphite grains along the mylonitic foliation of BFZ045. Plane-polarized light is used. (c) Chlorite in pressure shadows around a K-feldspar porphyroclast in the mylonite. White mica and a fine grained recrystallized K-feldspar assemblage is common along the foliation. (d) Light microscope image of a microstructure similar to (c) (cross-polarized light). (e–f) SEM BSE images of radiate chlorite used for chlorite thermometry in the cataclasite matrix (e) and in a vein cutting the mylonitic foliation (f). The trace of the mylonitic foliation in (f) is oriented ca. NW–SE.
4.3.3 Cataclasite
We analysed a largely recrystallized quartz clast in the cataclasite from sample PH28_10 (Fig. 9a). The selected clast is rotated of less than 10∘ with respect to the adjacent mylonitic foliation. Quartz grain size in the clast ranges from 4 to 60 µm. The coarser grains are elongated parallel to the foliation, show bulges and fine recrystallized grains at their boundaries, and contain a high density of low-angle boundaries (Fig. 9b). The low-angle boundaries define small polygonal domains of a size comparable to the one of the recrystallized grains found at the grain boundaries (Fig. 9c). The GOS map in Fig. 9d identifies two grain size distributions, separated by a GOS threshold value of 3.23∘. The recrystallized grains (average grain size: 8±4 µm) form equigranular aggregates at the boundaries of the coarser (average grain size: 17±10 µm) elongated relict grains. The c-axis CPO of the recrystallized grains and of the relict grains is the same, showing two maxima at an intermediate position between the centre of the pole figure and its periphery, and consistently inclined with the sinistral sense of shear of the sample (Fig. 9f). The differential stress estimated from the average recrystallized grain size in the clast (8 µm) is 123 MPa. Although the map has been acquired from a clast, these microstructures and recrystallized grain sizes are similar to those of the mylonite in the immediate vicinity (<2 cm) of the brittle fault core (Fig. 5b, c).
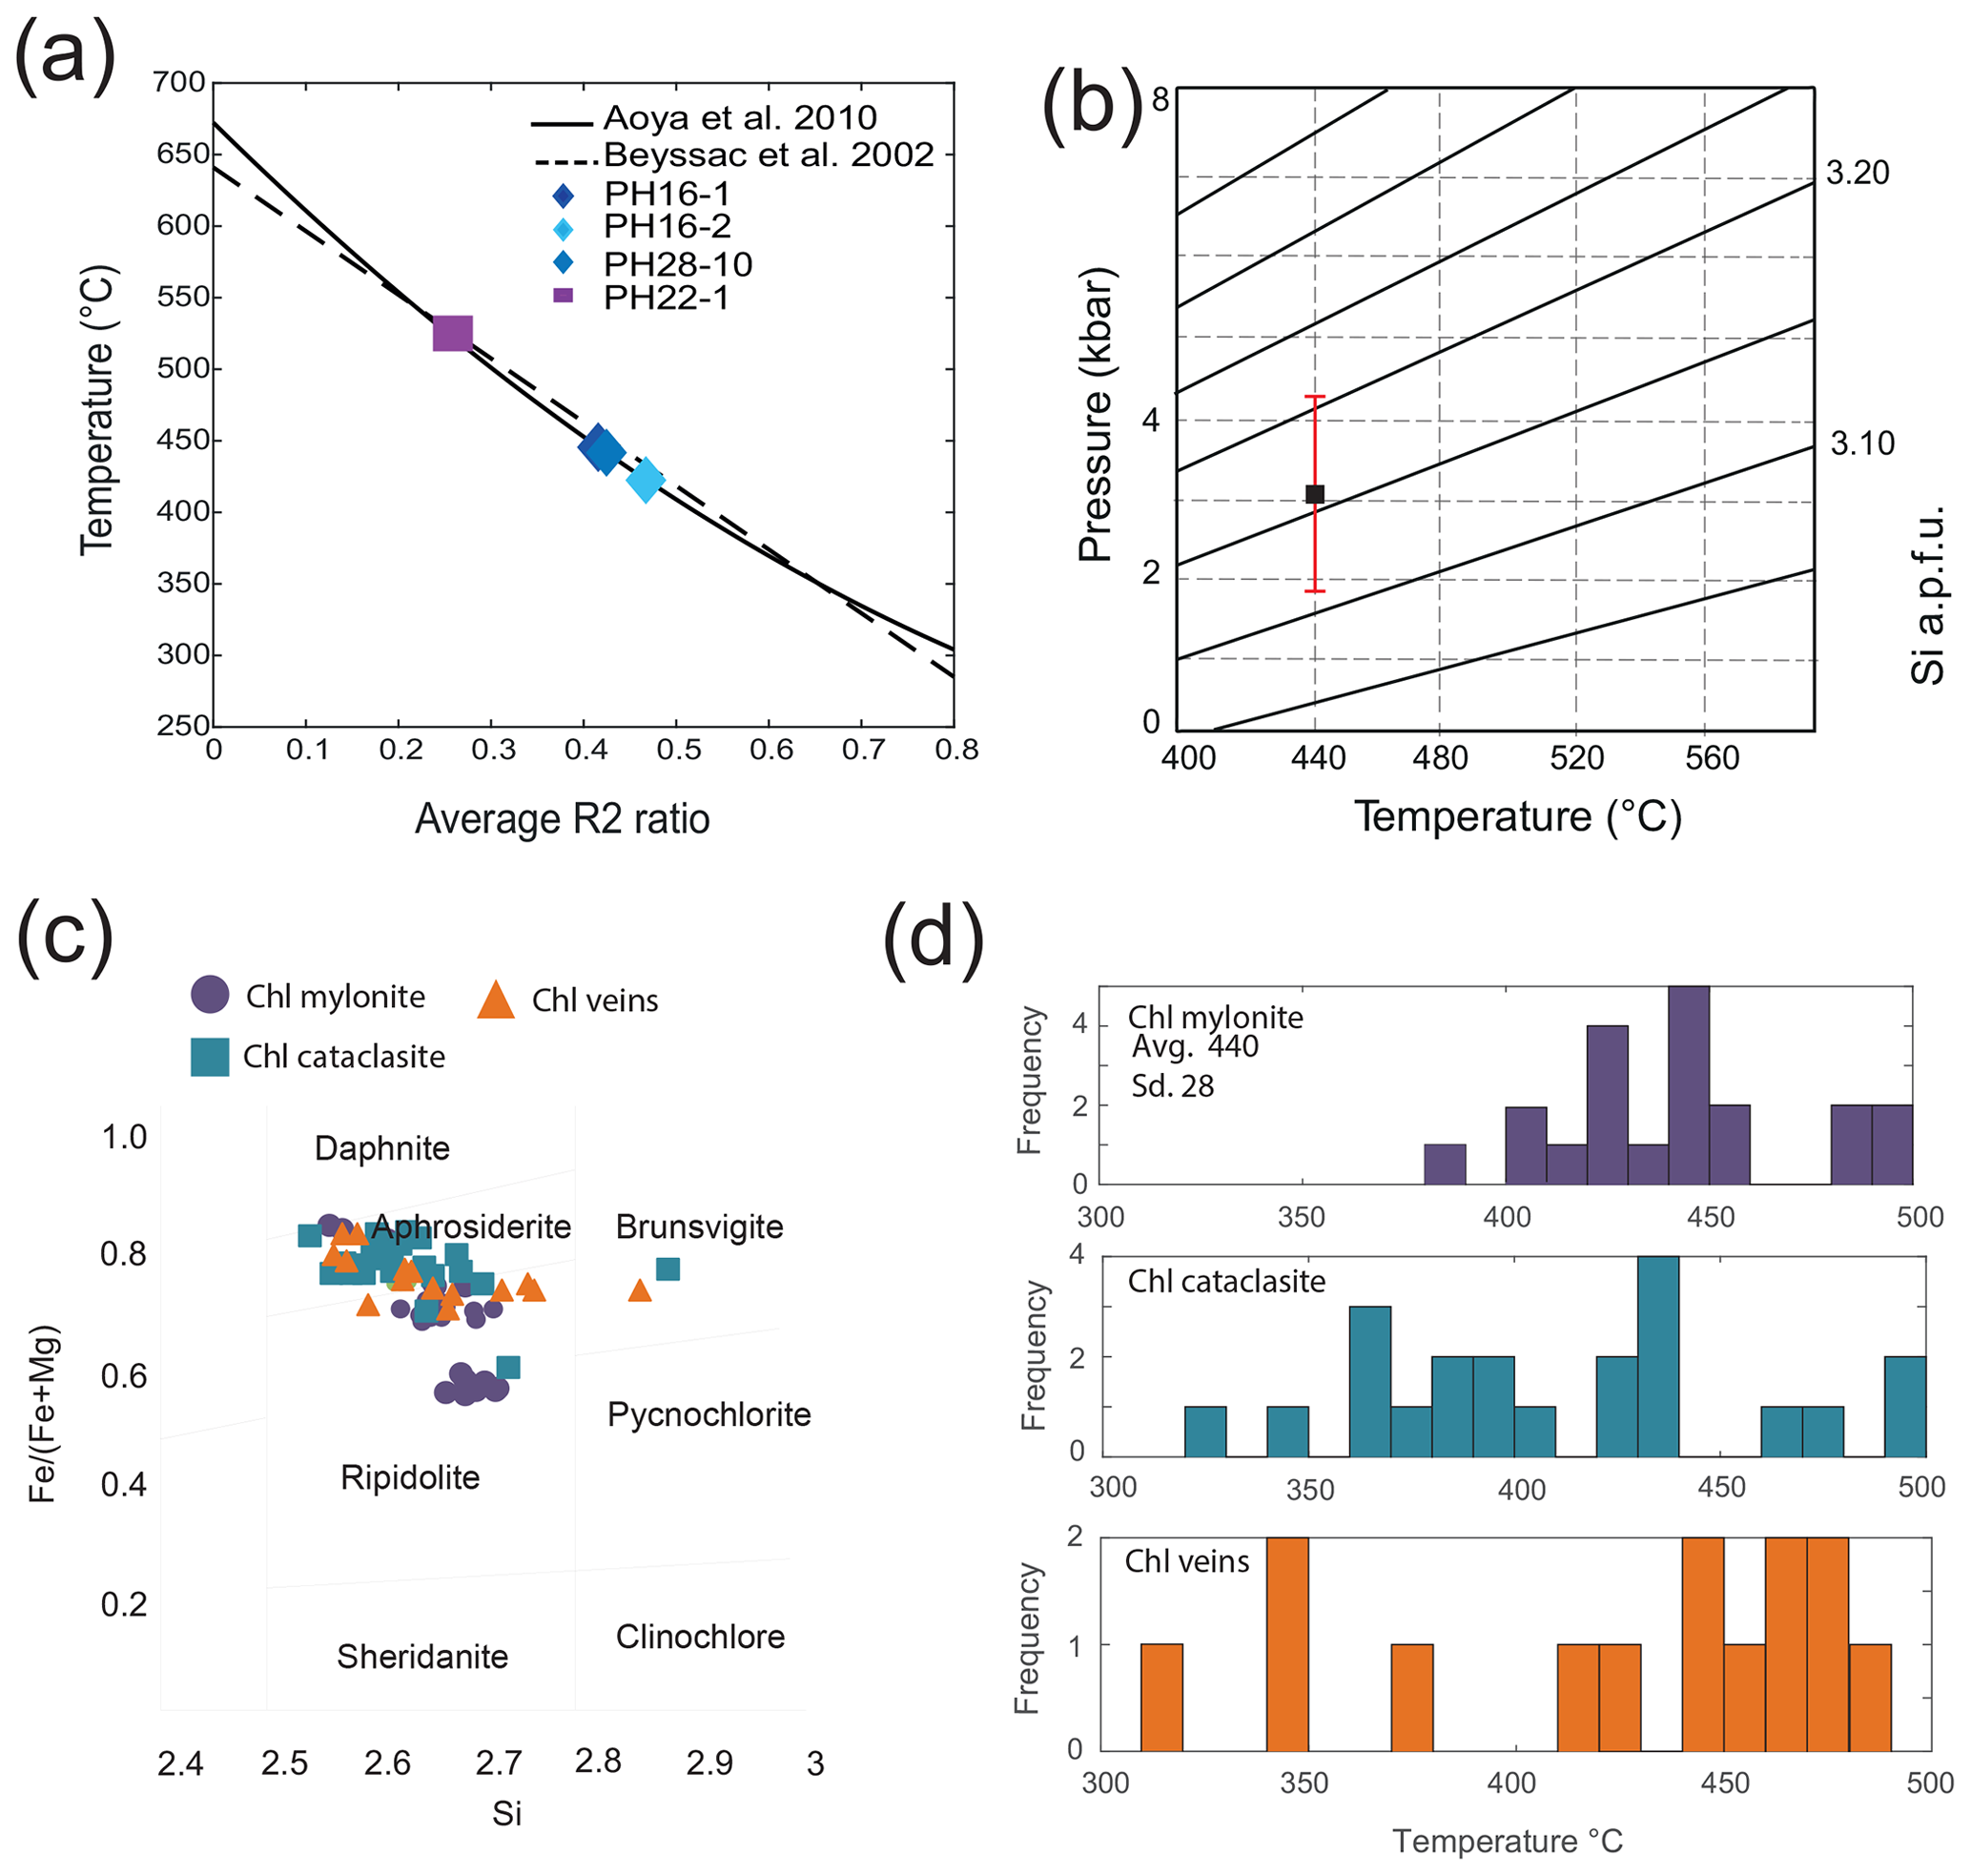
Figure 11Results of P–T estimates. (a) Carbonaceous material Raman geothermometer. Average R2 ratio (refer to text for explanation) for graphite-rich mylonitic and host rock samples was measured to derive a T estimate using the method by Beyssac et al. (2002) and Aoya et al. (2010). (b) Estimated P of mylonitization using the Si-in-phengite barometer (Massonne and Schreyer, 1987) for the average T of 440 ∘C obtained with the carbonaceous material Raman thermometry. Red line shows the total spread of the Si values obtained. Black square shows the (c) chlorite compositional diagram based on Hey (1954). (d) Chlorite formation temperature estimated for mylonitic foliation, veins, and cataclasite using the method by Lanari et al. (2014).
4.4 Mineral chemistry, Raman spectroscopy, and pressure–temperature (P–T) conditions of deformation
We estimated the P–T conditions of mylonitic deformation using Raman spectroscopy of carbonaceous material (RSCM), chlorite thermometry, and phengite barometry. Carbonaceous material was observed as grains and aggregates ranging in size from ∼50 to ∼200 µm in the host rock (sample PH21_1, Fig. 10a) and as smaller grains (20–50 µm) along the mylonitic foliation (sample PH16_1–2, Fig. 10b), along chlorite- and muscovite-rich layers. Data from Raman peak deconvolutions are reported in the Supplement S1. We estimated a maximum temperature of 530 ∘C ± 50 ∘C for the carbonaceous material in the host rock (Fig. 11a) (using the thermometer calibration for a laser wavelength of 514 nm; Beyssac et al., 2002), and a lower T of 440 ∘C ± 50 ∘C for the mylonite (Aoya et al., 2010, using the thermometer calibration for a laser wavelength of 532 nm; Fig. 11a).
Table 1Representative compositions of muscovite from the BFZ045 mylonite.
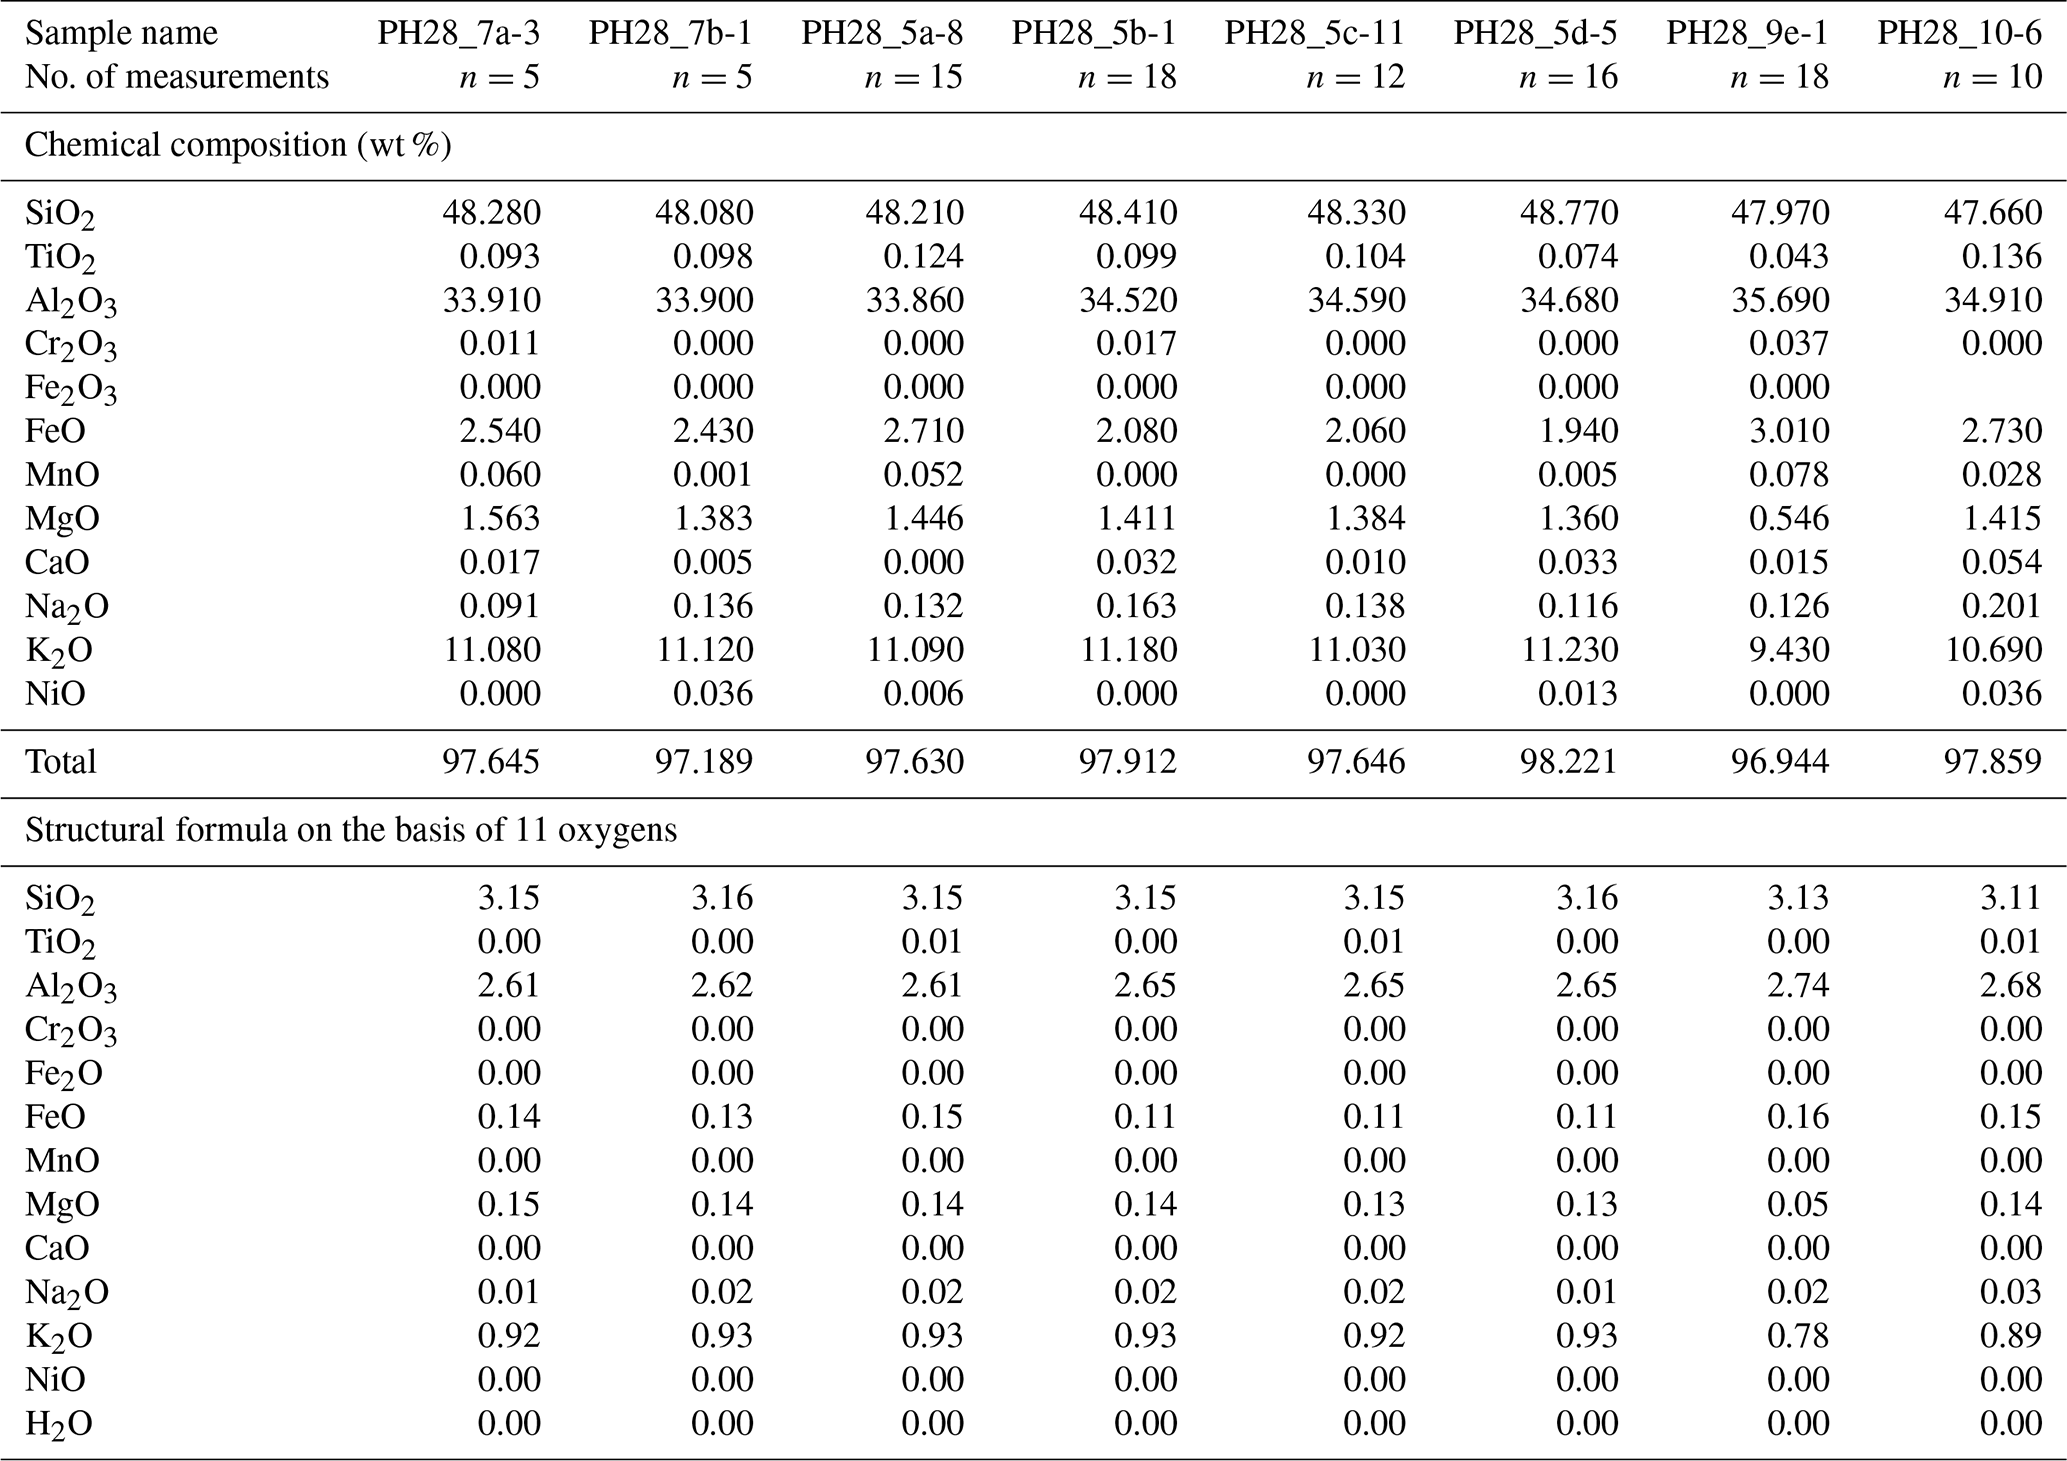
The pressure during mylonitization was estimated using the Si-in-phengite geobarometer (Massonne and Schreyer, 1987). Representative compositions of white mica are listed in Table 1. The full dataset of chemical compositions of white micas is reported in the Supplement S1. White mica composition was measured for grains parallel to the foliation associated with neoblasts of K-feldspar, as the application of the Si‐in‐phengite geobarometer requires stability of K-feldspar (Fig. 10c, d). Structural formulae were calculated assuming 11 oxygens. The range of Si apfu (atom per formula unit) in the probed white mica grains is 3.12–3.16. This compositional range indicates a pressure of 2–4 kbar for the mylonitization (Fig. 11b), considering the average temperature of 440 ∘C derived for the mylonite with the graphite thermometry.
Chlorite composition was determined for (i) chlorite grains intergrown with quartz and muscovite in the strain shadows around feldspar porphyroclasts in the mylonite (Fig. 10c, d), (ii) chlorite flake aggregates in the cataclasite quartz matrix (Fig. 10e), and (iii) radiate chlorites filling veins at high angle to the mylonitic foliation (Fig. 10f). The structural formula of chlorite was calculated based on 14 oxygens, and representative compositions are shown in Table 2. The full dataset of chemical compositions for chlorite is reported in the Supplement S2.
Table 2Representative compositions of chlorite from different domains of BFZ045.
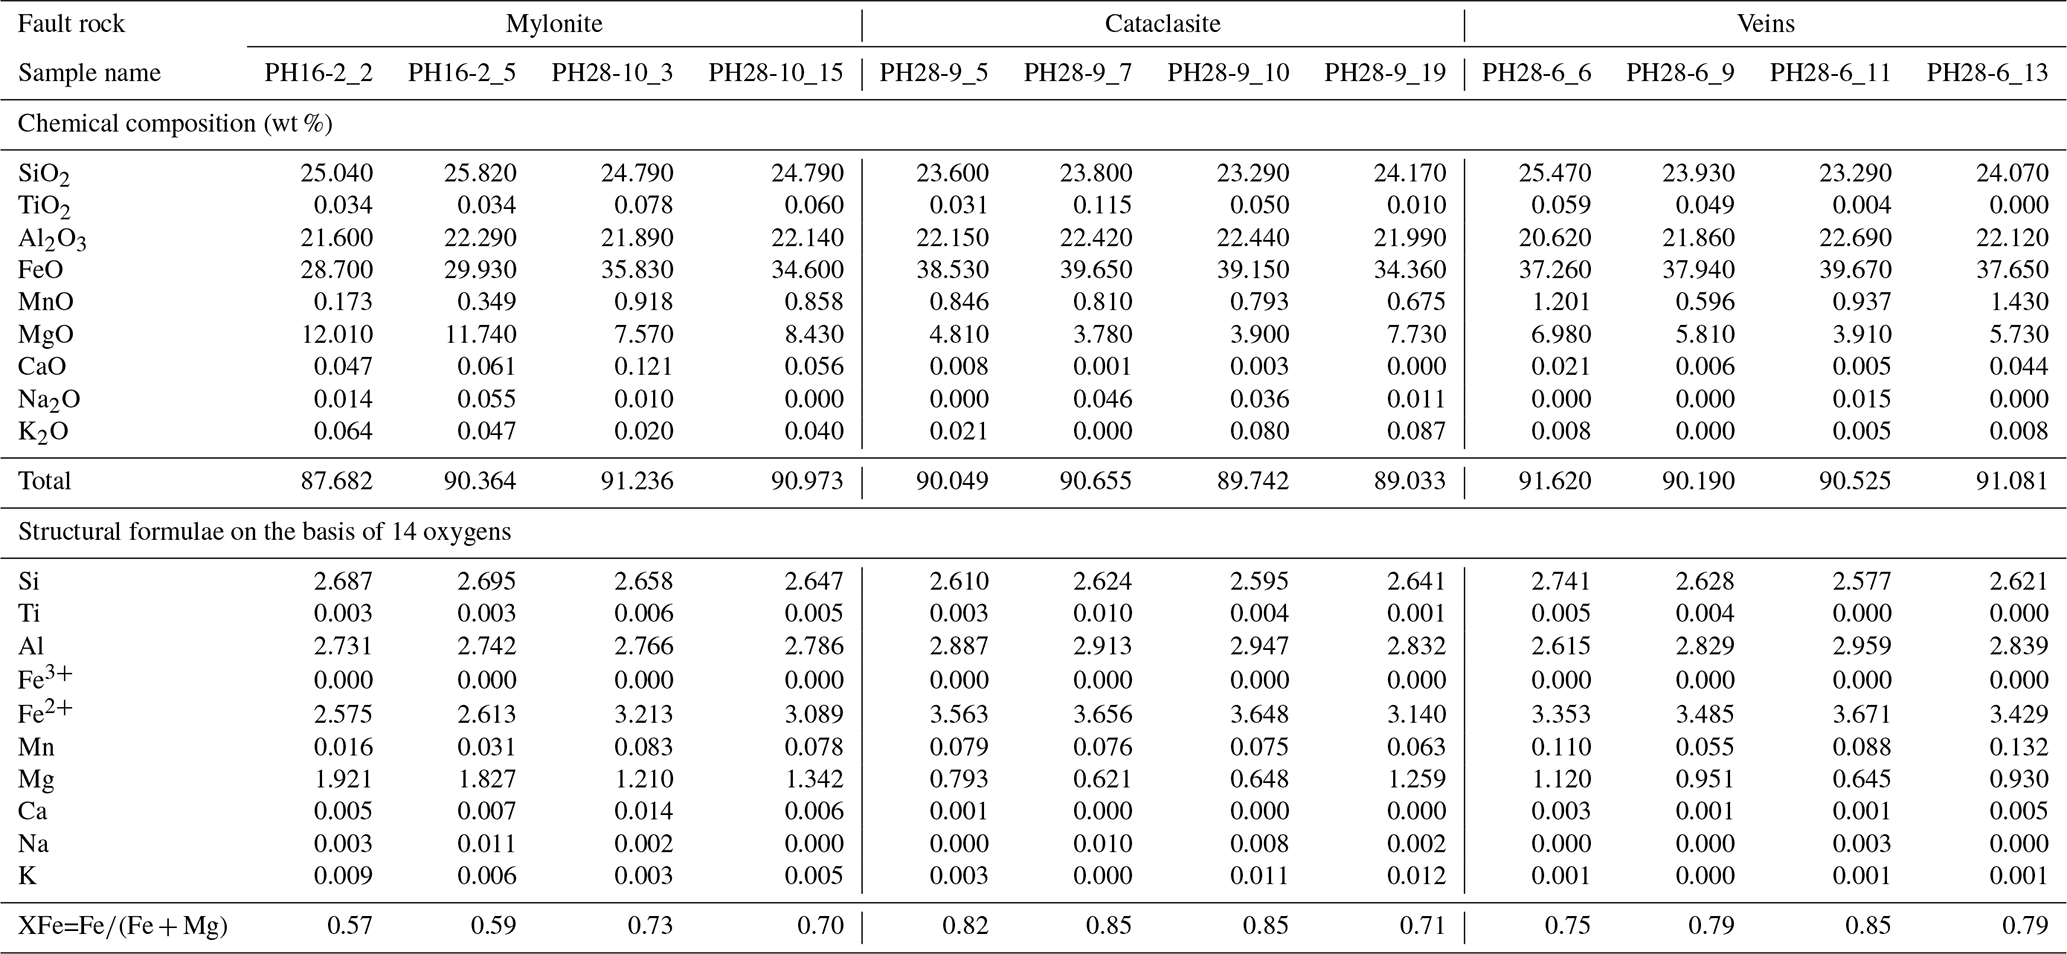
Chlorites along the mylonitic foliation have an Si content between ∼2.60 and 2.70 apfu, Al content between 2.74 and 2.88 apfu, and they are moderately Fe rich with a XFe () between 0.62 and 0.82. Chlorites in the mylonitic sample from PH_16 have a more narrow range of XFe, between 0.57 and 0.73 (see the Supplement S1). In the cataclasite chlorites Si content ranges between 2.53 and 2.772 apfu, and Al contents have a wider range of 2.61–2.94 apfu (Supplement S1). The cataclastic chlorite is richer in Fe compared to the mylonite, with a XFe range between 0.71 and 0.85. The radial chlorite filling the veins cutting the mylonite has an Si content between 2.51 and 2.780 apfu, Al between 2.74 and 3.00 apfu, and XFe varies between 0.69 and 0.81. In general, BFZ045 chlorites have a aphrosiderite-ripidolite composition and the microprobe results show that the composition of distinct chlorite generations is similar (Fig. 11c). The CHL(2) semi-empirical thermometer by Lanari et al. (2014) was applied to each EMPA analysis of chlorite with Si <3 apfu and (Na + K + Ca) <0.1 apfu. FeO was used as Fe total, and and were assumed. The estimated temperature for the mylonite ranges from ∼380 to 500 ∘C (limit of the used thermometer) for an assumed P of 3.5 kbar (Fig. 11d), with a temperature variation of 10 ∘C every 0.5 kbar increment. Temperatures estimated for the cataclasite matrix and for the radiated chlorite in the veins have a larger range (∼300–500 ∘C, Fig. 11d). Compositions yielding T lower than 400 ∘C are more frequent, especially in the cataclasite, but no clear relationship could be discerned between temperature and microstructural position of the chlorites.
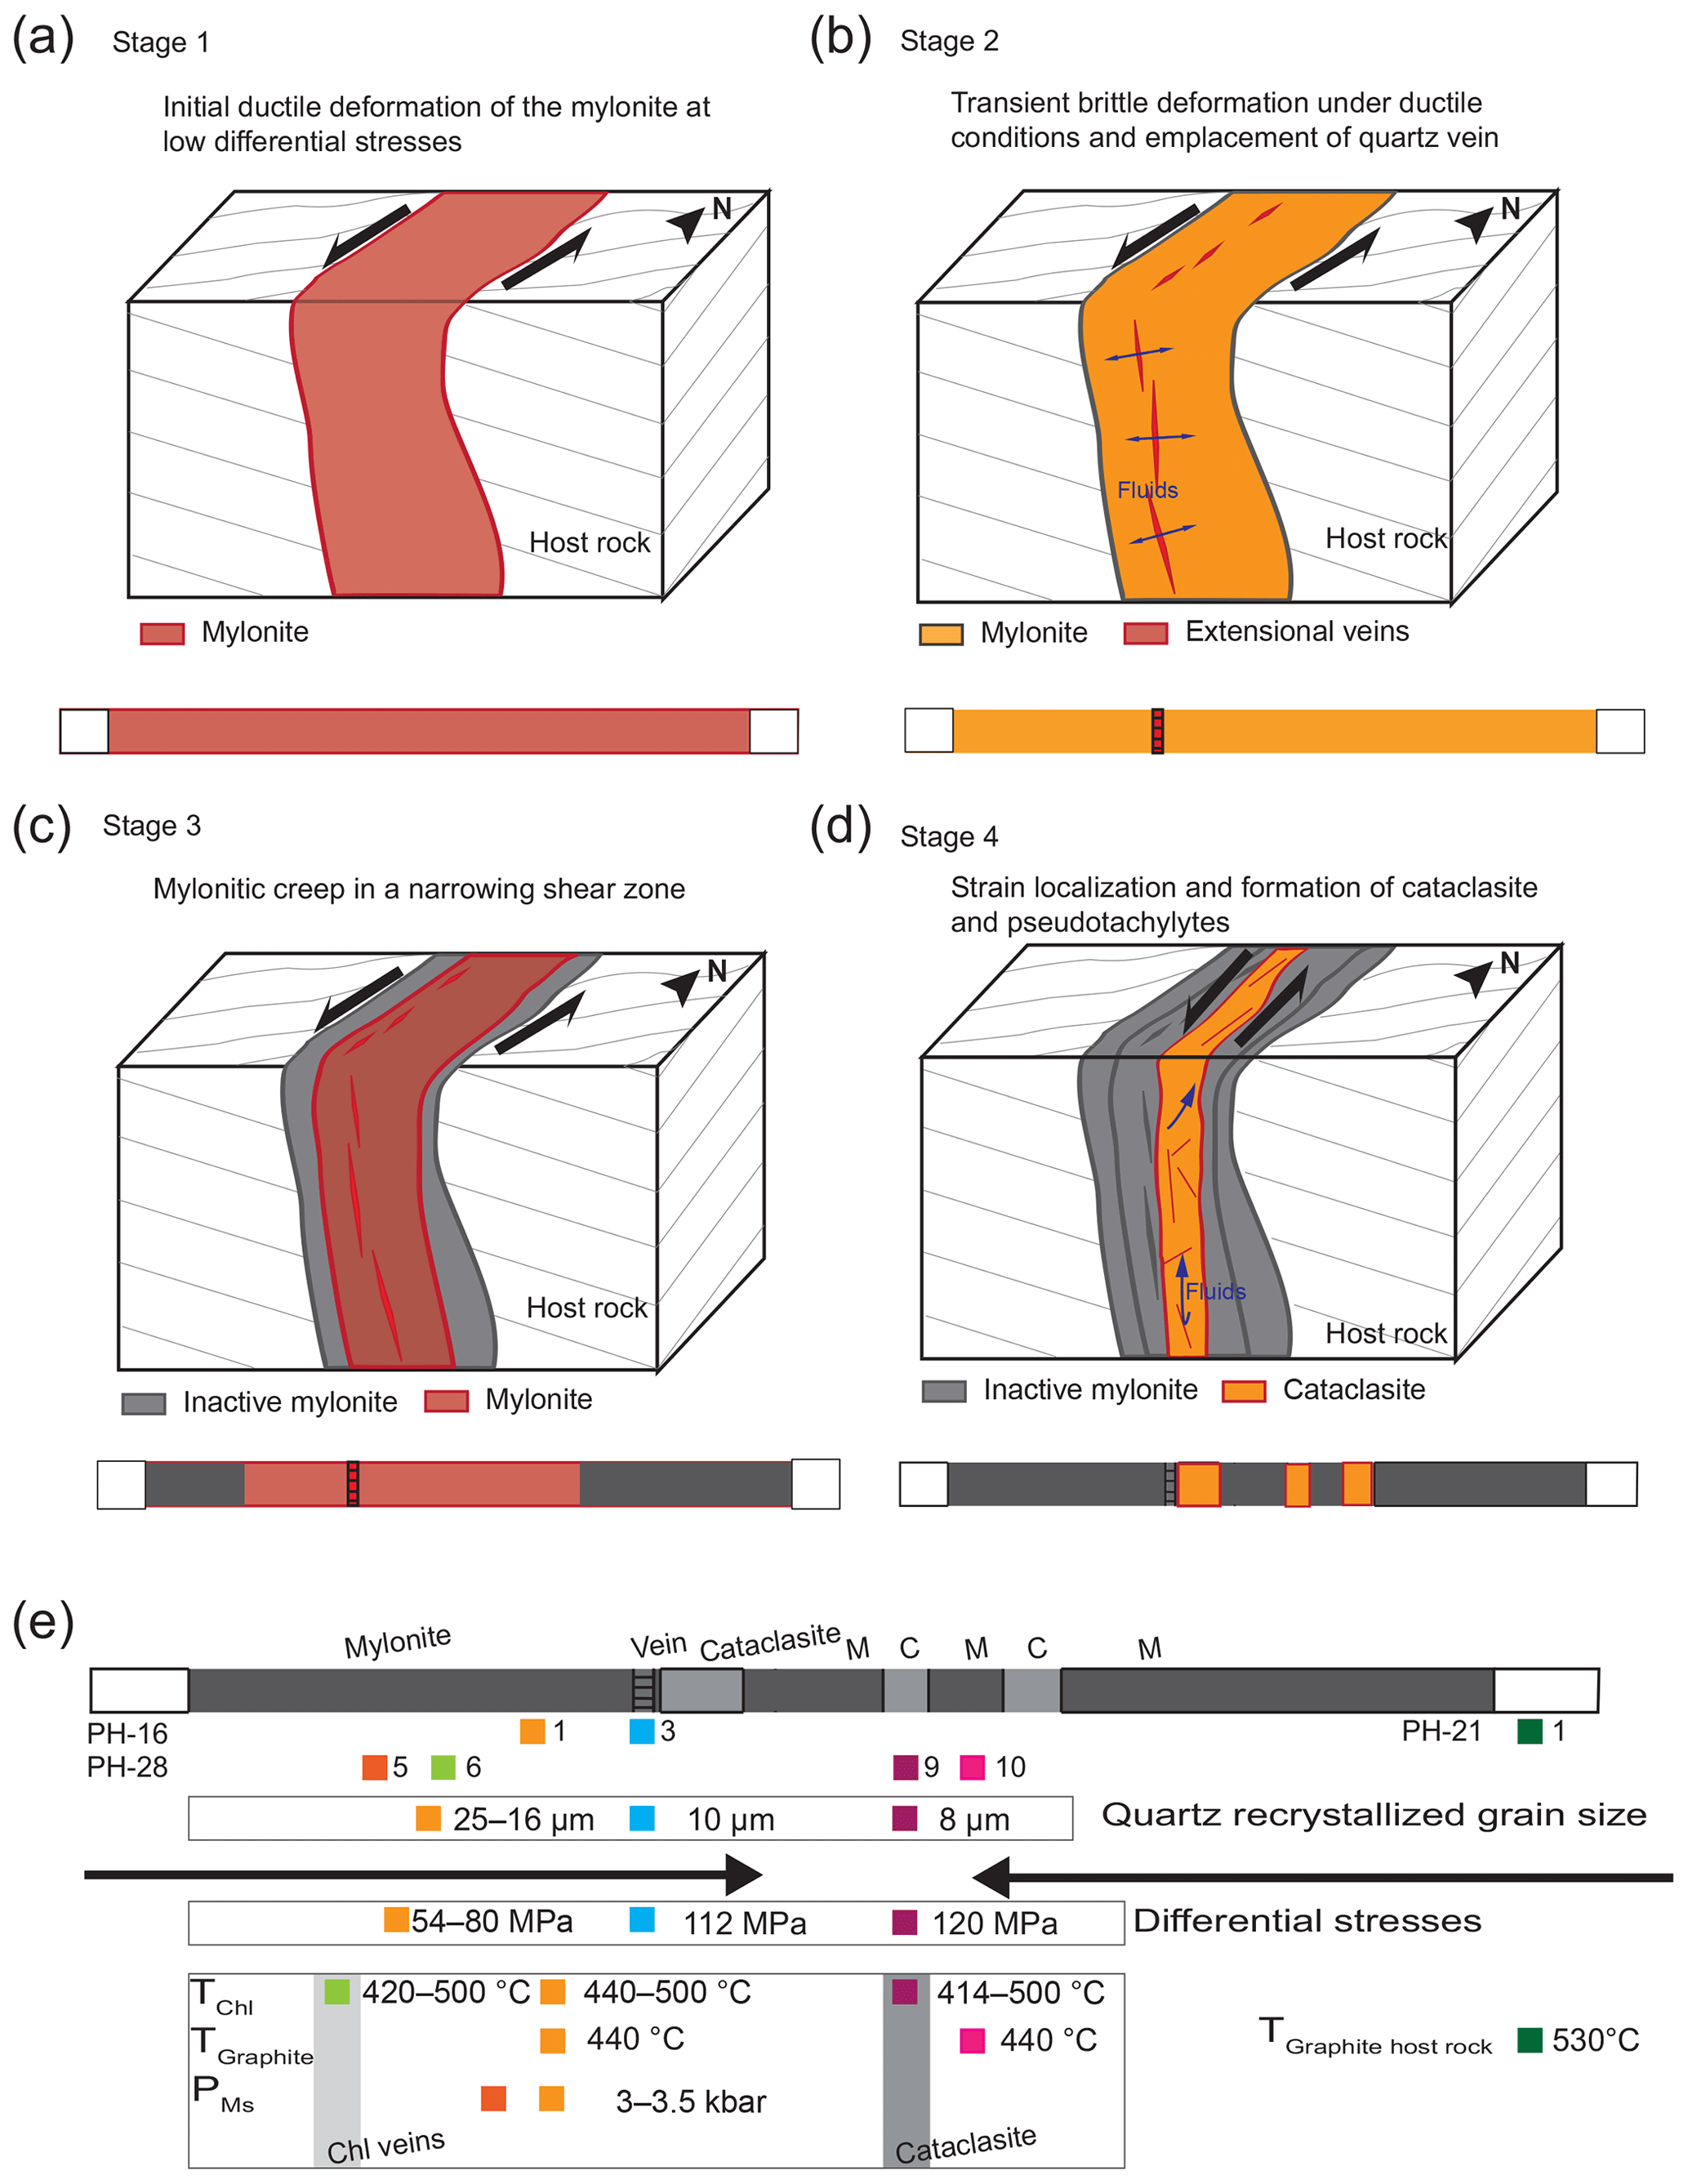
Figure 12Schematic representation of the microstructural evolution of BFZ045. (a–d) Grey lines: traces of metamorphic foliation in the host rock. In the schematic fault scheme evolution, red displays the active deformation process, grey represents the inactive deformation processes, and orange suggests a transition in the deformation. (a) The development of mylonite was punctuated by the emplacement of quartz vein (b). (c) Ductile deformation localized toward the centre of the mylonitic fault core in an overall narrowing shear zone, and it was followed by formation of cataclasite, chlorite veins, and pseudotachylyte (d). (e) Schematic summary of the quartz recrystallized grain size, differential stresses, and P–T conditions of deformation for BFZ045 derived in the present study, in relation to the fault core geometry. Each sample is coloured differently to indicate the spatial position of the results described in Sect. 4 of this paper.
Our observations constrain the details of the structure and the deformation history of BFZ045. In particular, the microstructures of fault rocks indicate a sequence of deformation events where ductile deformation (mylonitization) was punctuated by brittle deformation (veining), and eventually culminated in the formation of the brittle, cataclastic fault core. We interpret this sequence to result from the evolving stress history and possible fluid pressure variations during the overall ductile-to-brittle deformation history of the strike-slip BFZ045 fault.
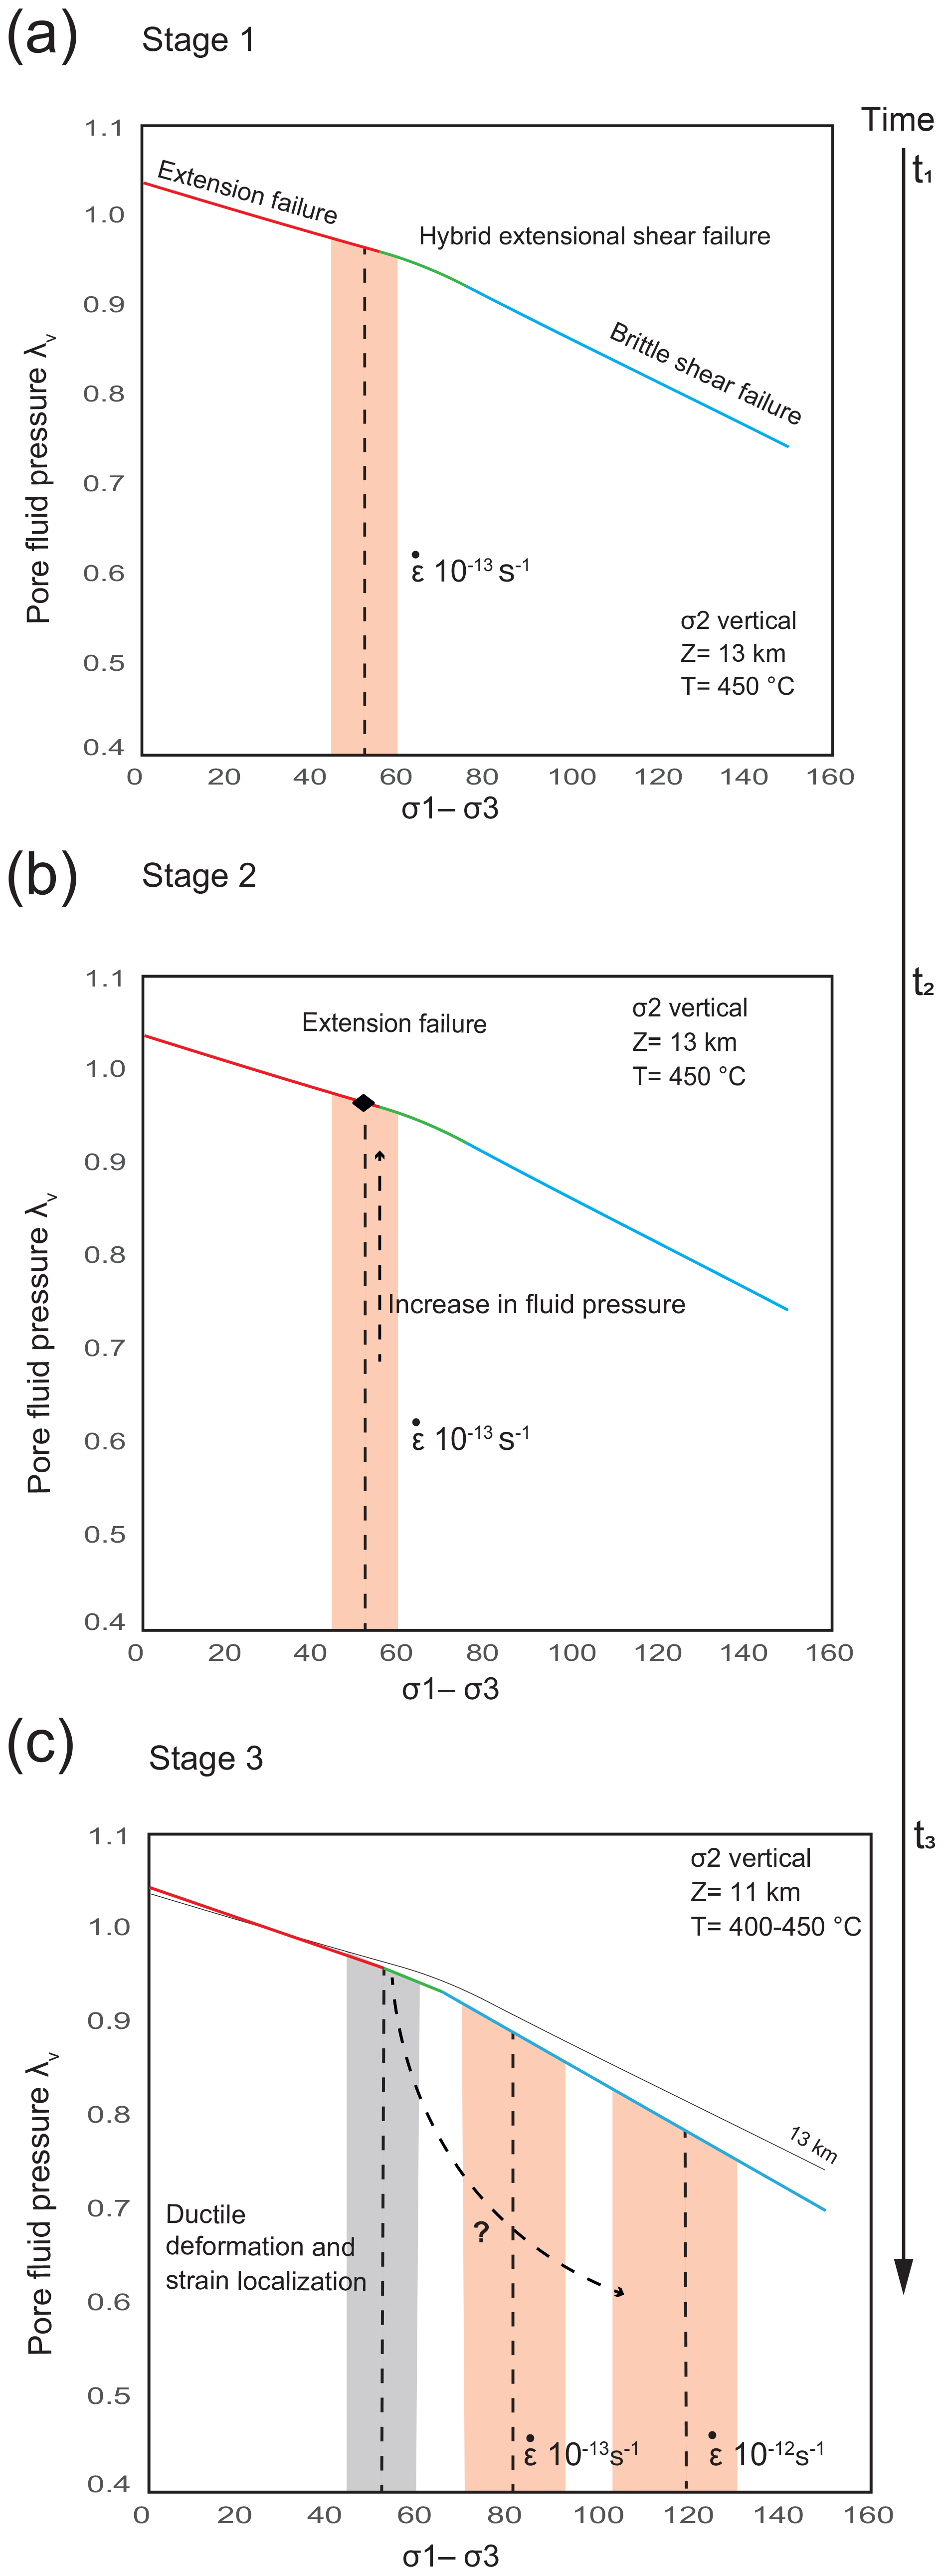
Figure 13Conceptual model of the temporal and mechanical evolution of the BFZ045 fault zone (see text for more details). BFZ045 was characterized by (a) the development of mylonite creeping at ca. 10–13 s−1, followed by (b) a transient increase in fluid pressure responsible for the emplacement of quartz veins. Ductile deformation then continued under increasing differential stress and strain rates (c).
5.1 The sequence of deformation events in BFZ045: ductile–brittle deformation history
Our microstructural observations are consistent with the general conclusion that brittle deformation along BFZ045 exploited a ductile (mylonitic) precursor (Nordbäck and Mattila, 2018; Skyttä and Torvela, 2018). Veins, cataclasites, and pseudotachylytes are localized along the mylonitic fabric of BFZ045, and only minor evidence of brittle deformation (mostly in the form of fractures filled by chlorite) is present outside of the mylonitic fault core (Figs. 2a, 3a). The first stage of deformation of BFZ045 is represented by the development of a localized N–S-trending mylonitic foliation (Figs. 2, 4a–c). Mylonitic creep was punctuated by transient brittle events, with the opening of extensional fractures along the mylonitic foliation filled by quartz veins (Fig. 4d, e). Veining was again followed by mylonitic deformation, as indicated by dislocation creep and dynamic recrystallization microstructures of quartz in the veins. Mylonite and veins were then overprinted by brittle deformation that formed, centimetre-thick cataclasites (Fig. 5a–c) and a <0.5 cm thick pseudotachylyte (Fig. 5d) that, together, form the brittle fault core of BFZ045. Cataclasites and pseudotachylytes were not overprinted by mylonitic creep, which might indicate that they formed under conditions favourable to predominantly brittle deformation along BFZ045.
The observed parallelism between stretching lineation in the mylonite and chlorite slickenlines in the cataclasites suggest that the ductile–brittle deformation history of BFZ045 occurred under a prolonged strike-slip regime with sinistral kinematics (Fig. 2b,c). This conclusion is consistent with the model of the brittle evolution of SW Finland proposed by Mattila and Viola (2014), which attributes the sinistral kinematics of NNW–SSE-trending sub-vertical faults to the ductile–brittle transition stage of the basement at ca. 1.75 Ga (“Stage 1” of deformation in Mattila and Viola, 2014). BFZ045 experienced later reactivations during the prolonged brittle history of the SW Finland basement, as indicated by calcite veins cutting the brittle fault core and by (rare) slickenlines with dextral kinematics observed in the underground exposures (Aaltonen et al., 2016). Local dextral kinematics along BFZ045 are potentially consistent with “Stage 2” of deformation by Mattila and Viola (2014) at 1.7–1.6 Ga. These later features, however, are not discussed further in this paper as they are subordinate to, and did not obliterate, the earlier history.

5.2 Deformation mechanisms and stress history during mylonitic creep of BFZ045
Microstructural observations show that ductile deformation of the mylonite BFZ045 was accommodated in quartz by dislocation creep, while feldspars experienced dominantly brittle behaviour with only limited neocrystallization in pressure shadows (Fig. 10c). Given the lack of crystal plastic deformation and recovery features in the interior of feldspar porphyroclasts, we interpret the neocrystallization in pressure shadows as a possible indication of dissolution–precipitation, which has been commonly reported in feldspars deforming at mid-crustal conditions (Stünitz and Gerald, 1993; Menegon et al., 2008; Eberlei et al., 2014; Torgersen et al., 2015; Giuntoli et al., 2018; Hentschel et al., 2019).
Quartz recrystallization microstructures (bulges at grain boundaries and within intracrystalline bands, and core and mantle microstructures with subgrains of comparable size to that of the recrystallized grains; Figs. 4, 5) suggest that bulging and subgrain rotation were the dominant recrystallization mechanisms (Hirth and Tullis, 1992; Stipp and Kunze, 2008). The average recrystallized grain size of quartz ranges between 8 and 18 µm, which falls within the <40 µm size value representative of bulging as the dominant recrystallization mechanism (defined as slow grain boundary migration coupled to localized subgrain rotation at the mantle of the host grain; Stipp et al., 2010). In all the studied samples, GOS analysis distinguished two quartz grain size populations, in which the coarser (relict) grain size contains subgrains of size comparable to the average size of the finer recrystallized grains (Figs. 7–9). The CPO of relict and recrystallized grains is the same, and this is consistent with the host-controlled development of a CPO during subgrain rotation recrystallization (e.g. Stünitz et al., 2003).
A key observation in the BFZ045 mylonite is the decrease in recrystallized grain size of quartz from the shear zone boundary (16–18 µm) towards the centre (8–12 µm; Figs. 7–9). The coarser (16–18 µm) grain size is the most representative of the partially recrystallized quartz ribbons (Fig. 7) and of the nearly completely recrystallized quartz ribbons (Fig. 8) in the BFZ045 mylonite at distances ≥4 cm from the brittle fault core, and it also occurs as relict grain size in quartz clasts embedded in the cataclasite, where it is overprinted by the finer (8–12 µm) recrystallized grains (Fig. 10). We interpret this overprint and the overall decrease in recrystallized grain size to reflect a progressive increase in stress and strain rate towards the shear zone centre during mylonitic creep (Kidder et al., 2016). Throughout the samples the CPO of recrystallized quartz is consistently inclined with a sinistral sense of shear (Fig. 6–9); this is interpreted as evidence that samples developed under constant kinematic conditions in BFZ045. Relict quartz grains of 25–28 µm in size are associated with the coarser (16–18 µm) grain size (Figs. 7–8), and un-recrystallized portions of quartz contain subgrains of similar size (≥25 µm, Fig. 7b–d). We consider that the 25–28 µm grain size population might represent an early, dynamic recrystallization event within BFZ045, which was later overprinted by recrystallization occurring under progressively increasing differential stress.
Deformation and stress history of BFZ045 can be summarized in different stages. After the regional metamorphic peak and migmatite formation (i.e. 660–700 ∘C, 3.7–4.2 kbar; Tuisku and Kärki, 2010), the basement of Olkiluoto was affected by different stages of ductile deformation (D2-D4, Aaltonen et al., 2010) under a metamorphic retrograde path toward greenschist facies conditions. The progressive change in P–T condition was favourable to the mobilization and subsequent recrystallization of carbonaceous material (e.g. Kirilova et al., 2018). We thus interpret the estimated metamorphic temperature of 530 ∘C ± 50 ∘C in the host rock as the temperature of remobilization of carbonaceous material during retrograde metamorphism that culminated in the D4 deformation stage. During the final stage of D4 a localized N–S-trending mylonitic foliation developed in the migmatites (Fig. 12a). Mylonitic creep took place under differential stresses increasing from ∼54 to ∼80 MPa, as determined from the recrystallized grain size of 16–18 µm overprinting grains of 25–28 µm. Foliation-parallel quartz veins crystallized transiently along the mylonitic foliation (Fig. 12b) and were overprinted by crystal plastic deformation and dynamic recrystallization under progressively higher stress (80–120 MPa, Figs. 8, 12c) during strain localization towards the centre of the shear zone. We are aware of the uncertainties and limitations of the palaeopiezometric calibrations, and our estimated flow stresses must be taken with care. However, the similarity between subgrain size and grain size, as well as the consistent sinistral asymmetry of the quartz c-axis CPO of relict and recrystallized grains, in all the maps support that dynamic recrystallization occurred during the sinistral strike-slip movement of BFZ045 under progressively increasing differential stresses.
We estimate that mylonitization of BFZ045 (Fig. 12a–c) occurred at ∼450 ∘C and 3.5 kbar, consistent with the retrograde greenschist facies conditions attributed to the final stages of D4 deformation in the SW Finland basement at 1.81–1.77 Ga (Lahtinen et al., 2005; Mänttäri et al., 2010; Skyttä and Torvela, 2018). Considering an average crustal density of 2.7 g cm−3, the depth of mylonitic deformation and of transient veining in BFZ045 corresponds to approximately 13 km.
The mylonite and quartz veins were eventually overprinted by more pervasive brittle deformation that formed chlorite veins, centimetre-thick cataclasites, and a <0.5 cm thick pseudotachylyte that, together, form the brittle fault core of BFZ045 (Fig. 12d). We attempted to estimate the temperature of chlorite veins cutting the mylonitic foliation and of chlorite in the cataclastic matrix (Fig. 11), but we obtained a wide temperature range of ∼300–500 ∘C that is unable to constrain the precise T of the final brittle deformation event(s). Although the conditions of formation of cataclasites and pseudotachylytes cannot be tightly constrained, it is interesting to note that the T estimates from the chlorite in the veins are generally higher than 400 ∘C. This suggests that chlorite veining occurred early in the deformation history of BFZ045 (i.e. at T≥400 ∘C) under overall ductile conditions, as also supported by the precipitation of chlorite + quartz aggregates in micro-veins and in strain shadows (Fig. 5e). This is consistent with the results by Marchesini et al. (2019), who estimated a temperature of at least 350 ∘C for the early stages of deformation and emplacement of quartz-chlorite veins along the dextral fault zone BFZ300 (conjugate to BFZ045).
5.3 Conceptual model of the fault slip behaviour of BFZ045 at the base of the seismogenic zone
Using a λ–σ failure mode diagram (Cox, 2010), we propose a conceptual model of the structural evolution of BFZ045 (Fig. 13). Strain rates during mylonitic creep were estimated using the dislocation creep flow laws of quartz by Hirth et al. (2001). Parameters and assumptions used for the calculation of the strain rates and of the λ–σ failure envelopes are listed in Table 3.
According to the failure envelope, differential stresses <80 MPa are necessary for extensional and hybrid fractures to occur. In our model, this stage of fault evolution is represented by the ∼54 MPa creep recorded by quartz grain and subgrain sizes of 25–28 µm (Fig. 7b–d). The failure envelope also shows that extensional failure and vein formation required transient high fluid pressure reaching lithostatic values (λ=1; Fig. 13b, stage 2). Although the overall geometric stress conditions during ductile deformation of BFZ045 are expected to generate en-echelon vein systems oblique to the mylonitic foliation, the foliation-parallel veins are consistent with mode I opening mode due to hydrofracturing. A regional rotation of the stress field appears unlikely, given the constant orientation of the stretching lineation and slickenlines in the core samples and the consistent asymmetry of the pre- and post-vein quartz c-axis CPO (Figs. 7–9). Thus, a transient reorientation of the stress field in the fault zone must be invoked to explain the switch from viscous creep to mode I fracturing along the mylonite foliation.
Veining was then followed by a decrease in fluid pressure (e.g. Sibson, 1989, 1993; Cox, 1995) and a switch back to mylonitic creep under progressively higher stress and strain rate conditions (Fig. 13c, stage 3). The failure mode diagram indicates that these higher stresses are expected to result in brittle shear failure mode of the fault for a pore fluid pressure factor λ>0.8. The cataclasite and pseudotachylytes in the brittle fault core likely represent the final product of BFZ045 deformation under progressively higher differential stresses and fluid pressure across the BDTZ. However, the time span between the high strain rate mylonitic creep and the formation of the brittle fault core is unknown and so are the exact P–T conditions of cataclasites and pseudotachylytes. Thus, our model for stage 3 remains somewhat speculative.
The increase in stress towards the shear zone centre (Fig. 12c) may reflect the rheological evolution of a shear zone that is narrowing with exhumation under progressively decreasing T from the ductile to the brittle crust (e.g. Kohlstedt et al., 1995; Behr and Platt, 2011). Alternatively, it might be attributed to external stress loading from seismic faulting in the overlying upper crust (i.e. seismic loading; e.g. Küster and Stöckhert, 1999; Trepmann and Stöckhert, 2003; Trepmann et al., 2017; Trepmann and Seybold, 2019). The two models are not mutually exclusive and are both equally valid to explain our observations. We are unable to discern between the two options, due to the limitations of our P–T estimates. However, the presence of pseudotachylytes along the BFZ045 fault core indicates that the fault was capable of generating earthquakes, and the seismogenic behaviour of other faults in the Olkiluoto basement has been previously discussed (Marchesini et al., 2019, and references therein). This suggests that transient seismic loading might have triggered the localized increase in creep rate during mylonitization of BFZ045.
This study shows that deformation microstructures can be used to evaluate the stress history of a shear zone deforming across the brittle–ductile transition in the continental crust and to reconstruct the cyclical brittle–ductile deformation history of fault zones. The fault zone BFZ045 exploited a mylonitic precursor in the Paleoproterozoic basement in SW Finland and records transient brittle deformation in the form of syn-kinematic quartz veins emplaced during ongoing mylonitic creep at ∼450 ∘C and 3.5 kbar, in response to transiently high fluid pressure. Mylonitic deformation continued after vein emplacement, as evidenced by the dynamic recrystallization of the quartz vein. Mylonitic creep occurred under progressively increasing differential stress towards the shear zone centre in an overall narrowing shear zone. Mylonitic deformation at the shear zone centre records peak stress conditions of around 120 MPa, and it was followed by brittle deformation that generated cataclasites and minor pseudotachylytes in the fault core.
The constraints derived from microstructural analysis shaped the proposed conceptual model of the evolution of BFZ045 slip behaviour, which highlights the important role of transiently sub-lithostatic fluid pressure in triggering vein emplacement during ongoing mylonitic deformation, as well as of the progressive increase in stress and strain rate during viscous creep towards peak conditions reached at the BDTZ in the Fennoscandian Shield. This study shows that microstructural studies leading to the acquisition of independent constraints offer the potential to reconstruct in detail the evolutionary history of fault zones that experienced a transition in deformation mode at the BDTZ. In addition to deriving a conceptual model of varying fault slip behaviours at the BDTZ, the methods and the results of this work complement and expand our knowledge thorough site characterization studies of deep geological disposal facilities.
Data are contained in the corresponding Supplement.
The supplement related to this article is available online at: https://doi.org/10.5194/se-11-489-2020-supplement.
GV, JM, LM, and MWA designed the project. FP performed the analysis and processed the data. BM contributed to the acquisition and processing of Raman data. FP, LM, and MWA drafted the manuscript and designed the figures. All authors discussed the results and contributed to the final article.
The authors declare that they have no conflict of interest.
Stephen F. Cox, Michael Stipp, Paolo Garofalo, and Francesco Giuntoli are thanked for fruitful discussions in the course of the project. Glenn Harper is thanked for support during SEM and EBSD analysis at the Electron Microscopy Centre of the University of Plymouth. Andrea Risplendente is thanked for support with EMPA analysis at the University of Milan. Many thanks go to Fabrizio Nestola for giving us access to the microRaman spectrometer of the University of Padova. Danilo Bersani is thanked for support with Raman analysis at the University of Parma. Alfredo Camacho and Georg Dresen are thanked for their reviews, which helped us prepare a much improved version of the article.
This research has been supported by Posiva OY (project no. 2104442) and the University of Plymouth.
This paper was edited by Bernhard Grasemann and reviewed by Alfredo Camacho and Georg Dresen.
Aaltonen, I., Lahti, M., Engström, J., Mattila, J., Paananen, M., Paulamäki, S., Gehör, S., Kärki, A., Ahokas, T., Torvela, T., and Front, K.: Geological Model of the Olkiluoto Site, Version 2.0., Posiva Working Report 2010-70, Posiva Oy, Eurajoki, 2010. a, b, c
Aaltonen, I., Engström, J., Gehör, S., Kosunen, P., and Kärki, A.: Geology of Olkiluoto, Posiva Working Report 2016-16, Posiva Oy, Eurajoki, 2016. a, b, c, d, e, f, g, h, i, j
Aoya, M., Kouketsu, Y., Endo, S., Shimizu, H., Mizukami, T., Nakamura, D., and Wallis, S.: Extending the applicability of the Raman carbonaceous-material geothermometer using data from contact metamorphic rocks, J. Metamorph. Geol., 28, 895–914, https://doi.org/10.1111/j.1525-1314.2010.00896.x, 2010. a
Behr, W. M. and Platt, J. P.: A naturally constrained stress profile through the middle crust in an extensional terrane, Earth Planet. Sc. Lett., 303, 181–192, https://doi.org/10.1016/j.epsl.2010.11.044, 2011. a, b, c
Bestmann, M. and Prior, D. J.: Intragranular dynamic recrystallization in naturally deformed calcite marble: diffusion accommodated grain boundary sliding as a result of subgrain rotation recrystallization, J. Struct. Geol., 25, 1597–1613, https://doi.org/10.1016/S0191-8141(03)00006-3, 2003. a
Beyssac, O., Goffé, B., Chopin, C., and Rouzaud, J. N.: Raman spectra of carbonaceous material in metasediments: a new geothermometer, J. Metamorph. Geol., 20, 859–871, https://doi.org/10.1046/j.1525-1314.2002.00408.x, 2002. a
Ceccato, A., Menegon, L., Pennacchioni, G., and Morales, L. F. G.: Myrmekite and strain weakening in granitoid mylonites, Solid Earth, 9, 1399–1419, https://doi.org/10.5194/se-9-1399-2018, 2018. a
Cox, S. F.: Faulting processes at high fluid pressures: An example of fault valve behavior from the Wattle Gully Fault, Victoria, Australia, J. Geophys. Res.-Sol. Ea., 100, 12841–12859, https://doi.org/10.1029/95JB00915, 1995. a, b
Cox, S. F.: The application of failure mode diagrams for exploring the roles of fluid pressure and stress states in controlling styles of fracture-controlled permeability enhancement in faults and shear zones, Geofluids, 10, 217–233, https://doi.org/10.1111/j.1468-8123.2010.00281.x, 2010. a, b
Cross, A. J., Prior, D. J., Stipp, M., and Kidder, S.: The recrystallized grain size piezometer for quartz: An EBSD-based calibration: EBSD-Based Quartz Grain Size Piezometer, Geophys. Res. Lett., 44, 6667–6674, https://doi.org/10.1002/2017GL073836, 2017. a, b, c, d
Derez, T., Pennock, G., Drury, M., and Sintubin, M.: Low-temperature intracrystalline deformation microstructures in quartz, J. Struct.l Geol., 71, 3–23, https://doi.org/10.1016/j.jsg.2014.07.015, 2015. a
Eberlei, T., Habler, G., Grasemann, B., and Abart, R.: Upper-greenschist facies intragrain deformation of albite in mylonitic meta-pegmatite and the influence of crystallographic anisotropy on microstructure formation, J. Struct. Geol., 69, 47–58, https://doi.org/10.1016/j.jsg.2014.10.001, 2014. a
Fossen, H. and Cavalcante, G. C. G.: Shear zones – A review, Earth-Sci. Rev., 171, 434–455, https://doi.org/10.1016/j.earscirev.2017.05.002, 2017. a
Freeman, J. J., Wang, A., Kuebler, K. E., Jolliff, B. L., and Haskin, L. A.: Characterization of natural feldspars by Raman spectroscopy for future planetary exploration, Can. Mineral., 46, 1477–1500, 2008. a
Fusseis, F. and Handy, M. R.: Micromechanisms of shear zone propagation at the brittle-viscous transition, J. Struct. Geol., 30, 1242–1253, https://doi.org/10.1016/j.jsg.2008.06.005, 2008. a
Giuntoli, F., Menegon, L., and Warren, C. J.: Replacement reactions and deformation by dissolution and precipitation processes in amphibolites, J. Metamorph. Geol., 36, 1263–1286, https://doi.org/10.1111/jmg.12445, 2018. a
Handy, M. R., Hirth, G., and Hovius, N.: Continental Fault Structure and Rheology from the Frictional-to-Viscous Transition Downward, in: Tectonic Faults: Agents of Change on a Dynamic Earth, MITP, 2007. a, b
Hentschel, F., Trepmann, C. A., and Janots, E.: Deformation of feldspar at greenschist facies conditions – the record of mylonitic pegmatites from the Pfunderer Mountains, Eastern Alps, Solid Earth, 10, 95–116, https://doi.org/10.5194/se-10-95-2019, 2019. a
Hirth, G. and Beeler, N.: The role of fluid pressure on frictional behavior at the base of the seismogenic zone, Geology, 43, 223–226, https://doi.org/10.1130/G36361.1, 2015. a
Hirth, G. and Tullis, J.: Dislocation creep regimes in quartz aggregates, J. Struct. Geol., 14, 145–159, https://doi.org/10.1016/0191-8141(92)90053-Y, 1992. a
Hirth, G. and Tullis, J.: The brittle-plastic transition in experimentally deformed quartz aggregates, J. Geophys. Res.-Sol. Ea., 99, 11731–11747, https://doi.org/10.1029/93JB02873, 1994. a
Hirth, G., Teyssier, C., and Dunlap, J. W.: An evaluation of quartzite flow laws based on comparisons between experimentally and naturally deformed rocks, Int. J. Earth Sci., 90, 77–87, https://doi.org/10.1007/s005310000152, 2001. a
Kidder, S., Hirth, G., Avouac, J.-P., and Behr, W.: The influence of stress history on the grain size and microstructure of experimentally deformed quartzite, J. Struct. Geol., 83, 194–206, https://doi.org/10.1016/j.jsg.2015.12.004, 2016. a, b
Kirilova, M., Toy, V., Rooney, J. S., Giorgetti, C., Gordon, K. C., Collettini, C., and Takeshita, T.: Structural disorder of graphite and implications for graphite thermometry, Solid Earth, 9, 223–231, https://doi.org/10.5194/se-9-223-2018, 2018. a
Kjøll, H. J., Viola, G., Menegon, L., and Sørensen, B. E.: Brittle-viscous deformation of vein quartz under fluid-rich lower greenschist facies conditions, Solid Earth, 6, 681–699, https://doi.org/10.5194/se-6-681-2015, 2015. a, b
Kohlstedt, D. L., Evans, B., and Mackwell, S. J.: Strength of the lithosphere: Constraints imposed by laboratory experiments, J. Geophys. Res.-Sol. Ea., 100, 17587–17602, https://doi.org/10.1029/95JB01460, 1995. a, b
Kouketsu, Y., Mizukami, T., Mori, H., Endo, S., Aoya, M., Hara, H., Nakamura, D., and Wallis, S.: A new approach to develop the Raman carbonaceous material geothermometer for low-grade metamorphism using peak width, Island Arc, 23, 33–50, https://doi.org/10.1111/iar.12057, 2014. a
Küster, M. and Stöckhert, B.: High differential stress and sublithostatic pore fluid pressure in the ductile regime-microstructural evidence for short-term post-seismic creep in the Sesia Zone, Western Alps, Tectonophysics, 303, 263–277, 1999. a
Lafuente, B., Downs, R. T., Yang, H., and Stone, N.: The power of databases: the RRUFF project, in: Highlights in mineralogical crystallography, Walter de Gruyter GmbH, 1–29, 2016. a
Lahtinen, R.: Crustal evolution of the Svecofennian and Karelian domains during 2.1–1.79 Ga: with special emphasis on the geochemistry and origin of 1.93–1.91 Ga gneissic tonalites and associated supracrustal rocks in the Rautalampi area, central Finland; with 7 tables, no. 378 in Bulletin/Geological Survey of Finland, Geologian Tutkimuskeskus, Espoo, oCLC: 246657564, 1994. a
Lahtinen, R., Korja, A., and Nironen, M.: Chapter 11 Paleoproterozoic tectonic evolution, in: Developments in Precambrian Geology, edited by: Lehtinen, M., Nurmi, P. A., and Rämö O. T., vol. 14 of Precambrian Geology of Finland Key to the Evolution of the Fennoscandian Shield, Elsevier, 481–531, https://doi.org/10.1016/S0166-2635(05)80012-X, 2005. a, b, c
Lanari, P., Wagner, T., and Vidal, O.: A thermodynamic model for di-trioctahedral chlorite from experimental and natural data in the system MgO-FeO-Al2O3-SiO2-H2O: applications to P–T sections and geothermometry, Contrib. Mineral. Petrol., 167, 1–19, 2014. a
Marchesini, B., Garofalo, P. S., Menegon, L., Mattila, J., and Viola, G.: Fluid-mediated, brittle-ductile deformation at seismogenic depth – Part 1: Fluid record and deformation history of fault veins in a nuclear waste repository (Olkiluoto Island, Finland), Solid Earth, 10, 809–838, https://doi.org/10.5194/se-10-809-2019, 2019. a, b, c, d, e
Massonne, H.-J. and Schreyer, W.: Phengite geobarometry based on the limiting assemblage with K-feldspar, phlogopite, and quartz, Contrib. Mineral. Petrol., 96, 212–224, 1987. a
Mattila, J. and Viola, G.: New constraints on 1.7 Gyr of brittle tectonic evolution in southwestern Finland derived from a structural study at the site of a potential nuclear waste repository (Olkiluoto Island), J. Struct. Geol., 67, 50–74, 2014. a, b, c, d, e
Melosh, B. L., Rowe, C. D., Gerbi, C., Smit, L., and Macey, P.: Seismic cycle feedbacks in a mid-crustal shear zone, J. Struct. Geol., 112, 95–111, https://doi.org/10.1016/j.jsg.2018.04.004, 2018. a, b
Menegon, L., Pennacchioni, G., and Spiess, R.: Dissolution-precipitation creep of K-feldspar in mid-crustal granite mylonites, J. Struct. Geol., 30, 565–579, https://doi.org/10.1016/j.jsg.2008.02.001, 2008. a
Mänttäri, I., Talikka, M., Paulamäki, S., and Mattila, J.: U-Pb ages for tonalitic gneiss, pegmatitic granite, and diabase dyke, Olkiluoto study site, Eurajoki, SW Finland, Tech. Rep. Posiva Working Report 2006-12, Posiva Oy, Eurajoki, Posiva Oy, 2006. a
Mänttäri, I., Engstroem, J., Lahaye, Y., and Pere, T.: U-Pb ages for PGR dykes, KFP, and adjacent older leucosomic PGRs from ONKALO underground research facility, Olkiluoto, Eurajoki, SW Finland, Tech. Rep. Posiva Working Report 2010-31, Posiva Oy, Eurajoki, Posiva Oy, 2010. a, b, c
Nguyen, P. T., Harris, L. B., Powell, C. M., and Cox, S. F.: Fault-valve behaviour in optimally oriented shear zones: an example at the Revenge gold mine, Kambalda, Western Australia, J. Struct. Geol., 20, 1625–1640, https://doi.org/10.1016/S0191-8141(98)00054-6, 1998. a
Nironen, M.: The Svecofennian Orogen: a tectonic model, Precambrian Research, 86, 21–44, 1997. a
Nordbäck, N. and Mattila, J.: Brittle Fault Systems of the ONKALO Underground Research Facility, 20, 1–80, 2018. a, b, c
Pajunen, M., Airo, M., Elminen, T., Mänttäri, I., Niemelä, R., Vaarma, M., Wasenius, P., and Wennerström, M.: Tectonic evolution of the Svecofennian crust in southern Finland, Geol. S. Finl., 47, 15–160, 2008. a
Pennacchioni, G. and Mancktelow, N. S.: Nucleation and initial growth of a shear zone network within compositionally and structurally heterogeneous granitoids under amphibolite facies conditions, J. Struct. Geol., 29, 1757–1780, https://doi.org/10.1016/j.jsg.2007.06.002, 2007. a
Pere, T.: Fault-related local phenomena in the bedrock of Olkiluoto with particular reference to fault zone OL-BFZ100, Posiva Oy, 2009. a
Saintot, A., Stephens, M., Viola, G., and Nordgulen, Ã.: Brittle tectonic evolution and paleostress field reconstruction in the southwestern part of the Fennoscandian Shield, Forsmark, Sweden, Tectonics, 30, 1–36, 2011. a
Scholz, C. H.: Earthquakes and friction laws, Nature, 391, 37–42, https://doi.org/10.1038/34097, 1998. a
Sibson, R. H.: Earthquake faulting as a structural process, J. Struct. Geol., 11, 1–14, https://doi.org/10.1016/0191-8141(89)90032-1, 1989. a
Sibson, R. H.: Conditions for fault-valve behaviour, Geol. Soc. London, 54, 15–28, https://doi.org/10.1144/GSL.SP.1990.054.01.02, 1990. a
Sibson, R. H.: Implications of fault-valve behaviour for rupture nucleation and recurrence, Tectonophysics, 211, 283–293, https://doi.org/10.1016/0040-1951(92)90065-E, 1992. a
Sibson, R. H.: Load-strengthening versus load-weakening faulting, J. Struct. Geol., 15, 123–128, https://doi.org/10.1016/0191-8141(93)90090-W, 1993. a
Sibson, R. H. and Rowland, J. V.: Stress, fluid pressure and structural permeability in seismogenic crust, North Island, New Zealand, Geophys. J. Int., 154, 584–594, https://doi.org/10.1046/j.1365-246X.2003.01965.x, 2003. a
Skyttä, P. and Torvela, T.: Brittle reactivation of ductile precursor structures: The role of incomplete structural transposition at a nuclear waste disposal site, Olkiluoto, Finland, J. Struct. Geol., 116, 253–259, 2018. a, b, c, d, e
Stipp, M. and Kunze, K.: Dynamic recrystallization near the brittle-plastic transition in naturally and experimentally deformed quartz aggregates, Tectonophysics, 448, 77–97, https://doi.org/10.1016/j.tecto.2007.11.041, 2008. a, b
Stipp, M. and Tullis, J.: The recrystallized grain size piezometer for quartz, Geophys. Res. Lett., 30, 2088, https://doi.org/10.1029/2003GL018444, 2003. a
Stipp, M., Stünitz, H., Heilbronner, R., and Schmid, S. M.: The eastern Tonale fault zone: a natural laboratory – for crystal plastic deformation of quartz over a temperature range from 250 to 700 ∘C, J. Struct. Geol., 24, 1861–1884, https://doi.org/10.1016/S0191-8141(02)00035-4, 2002. a
Stipp, M., Tullis, J., Scherwath, M., and Behrmann, J. H.: A new perspective on paleopiezometry: Dynamically recrystallized grain size distributions indicate mechanism changes, Geology, 38, 759–762, https://doi.org/10.1130/G31162.1, 2010. a
Stünitz, H. and Gerald, J. D. F.: Deformation of granitoids at low metamorphic grade, II: Granular flow in albite-rich mylonites, Tectonophysics, 221, 299–324, https://doi.org/10.1016/0040-1951(93)90164-F, 1993. a
Stünitz, H., Fitz Gerald, J. D., and Tullis, J.: Dislocation generation, slip systems, and dynamic recrystallization in experimentally deformed plagioclase single crystals, Tectonophysics, 372, 215–233, https://doi.org/10.1016/S0040-1951(03)00241-5, 2003. a
Torgersen, E., Viola, G., Zwingmann, H., and Harris, C.: Structural and temporal evolution of a reactivated brittle-ductile fault – Part II: Timing of fault initiation and reactivation by K-Ar dating of synkinematic illite/muscovite, Earth Planet. Sc. Lett., 410, 212–224, https://doi.org/10.1016/j.epsl.2014.09.051, 2015. a
Torvela, T. and Ehlers, C.: From ductile to brittle deformation: structural development and strain distribution along a crustal-scale shear zone in SW Finland, Int. J. Earth Sci., 99, 1133–1152, 2010. a
Trepmann, C. A. and Seybold, L.: Deformation at low and high stress-loading rates, Geosci. Front., 10, 43–54, https://doi.org/10.1016/j.gsf.2018.05.002, 2019. a, b
Trepmann, C. A. and Stöckhert, B.: Quartz microstructures developed during non-steady state plastic flow at rapidly decaying stress and strain rate, J. Struct. Geol., 25, 2035–2051, 2003. a
Trepmann, C. A., Stöckhert, B., Dorner, D., Moghadam, R. H., Küster, M., and Röller, K.: Simulating coseismic deformation of quartz in the middle crust and fabric evolution during postseismic stress relaxation — An experimental study, Tectonophysics, 442, 83–104, https://doi.org/10.1016/j.tecto.2007.05.005, 2007. a
Trepmann, C. A., Hsu, C., Hentschel, F., Döhler, K., Schneider, C., and Wichmann, V.: Recrystallization of quartz after low-temperature plasticity–The record of stress relaxation below the seismogenic zone, J. Struct. Geol., 95, 77–92, 2017. a
Tuisku, P. and Kärki, A.: Metamorphic petrology of Olkiluoto, Tech. rep., Posiva Oy, 2010. a, b
Viola, G., Mancktelow, N. S., and Miller, J. A.: Cyclic frictional-viscous slip oscillations along the base of an advancing nappe complex: Insights into brittle-ductile nappe emplacement mechanisms from the Naukluft Nappe Complex, central Namibia, Tectonics, 25, 1–20, https://doi.org/10.1029/2005TC001939, 2006. a
Viola, G., Venvik Ganerød, G., and Wahlgren, C.-H.: Unraveling 1.5 Ga of brittle deformation history in the Laxemar-Simpevarp area, southeast Sweden: A contribution to the Swedish site investigation study for the disposal of highly radioactive nuclear waste, Tectonics, 28, 1–29, https://doi.org/10.1029/2009TC002461, 2009. a
Wehrens, P., Berger, A., Peters, M., Spillmann, T., and Herwegh, M.: Deformation at the frictional-viscous transition: Evidence for cycles of fluid-assisted embrittlement and ductile deformation in the granitoid crust, Tectonophysics, 693, 66–84, https://doi.org/10.1016/j.tecto.2016.10.022, 2016. a
Wright, S. I., Nowell, M. M., and Field, D. P.: A Review of Strain Analysis Using Electron Backscatter Diffraction, Micros. Microanal., 17, 316–329, https://doi.org/10.1017/S1431927611000055, 2011. a
Yardley, B. and Baumgartner, L.: Fluid processes in deep crustal fault zones, Tectonic Faults-Agents of Change on a Dynamic Earth, 295–318, 2007. a